BTCUSD Analysis (MMC) : Dual Directional Outlook let's See🔍 1. Overview of Structure & Context:
On the 30-minute timeframe, BTCUSD is consolidating between two strong technical zones:
A descending trendline acting as resistance
A parallel rising support forming a compression zone
This wedge-like formation signals a potential high-impact move in either direction — a dual-directional outlook. Price is currently testing the midpoint between resistance and support, offering two reactive trade scenarios.
🟦 2. Key Zones Highlighted on Chart:
🔹 A. Parallel Support Zone (Dynamic Support):
A grey-shaded rising support has been tested multiple times.
Each bounce suggests buying strength near this diagonal zone.
This zone represents smart money accumulation potential under MMC concepts.
As price approaches this zone again, bulls are expected to step in if momentum aligns.
🔹 B. Descending Resistance Line (Supply Line):
The market is facing lower highs, a sign of bearish control at higher levels.
Each retest of this line has led to a rejection.
This line also acts as a liquidity magnet — price may spike above it to trap buyers before dropping (false breakout potential).
🧭 3. Scenarios and Trade Possibilities (Dual Directional Path):
✅ Scenario 1: Bullish Breakout – (Marked as Path 1)
If BTC breaks above the descending trendline with strong bullish volume, this confirms a structural breakout.
This setup targets:
First level: $119,600
Second level: $120,200
Once broken, the trendline can flip into support.
Ideal confirmation:
Bullish engulfing candle on breakout
Retest of broken resistance turning into support
Volume surge or momentum indicators turning bullish
⚠️ Scenario 2: Bearish Rejection & Breakdown – (Marked as Path 2)
If BTC fails to break resistance and breaks below the parallel support zone, it opens a bearish scenario.
Price may fall back to:
First level: $117,200
Final key support: $116,400 (Major Breakdown Zone)
This is a typical MMC-style mirror move: a structure break leading to liquidity run toward a previous demand zone.
Bearish confirmation:
Close below grey zone
Lower high formation near resistance
Increasing bearish volume / weak bounce
📐 4. Strategy & Trading Tips (MMC Application):
Under the Mirror Market Concepts (MMC), these zones are not just technical levels — they represent emotional price memory of both institutional and retail players.
Wait for the reaction, not prediction.
Use confluence tools (RSI divergence, volume, candle patterns).
Avoid trading inside the wedge — it's a trap zone.
Ideal entries are at breakout with retest confirmation or rejection from major zones.
📊 Risk Management Plan:
Entry Type Trigger Level SL Suggestion TP Range
Long Trade Break & retest above $118.8K Below $118.2K $119.6K → $120.2K
Short Trade Breakdown below $117.8K Above $118.2K $117.2K → $116.4K
🧠 Conclusion:
BTC is in a decision-making zone between a downward pressure line and strong support. A breakout could lead to a clean trend continuation, while a breakdown would trigger bearish momentum. The chart reflects precision MMC logic, offering a tactical map for day traders and scalpers to follow the smart money — not the noise.
Let the market decide direction. We just need to be prepared, not predictive.
Cryptoscalping

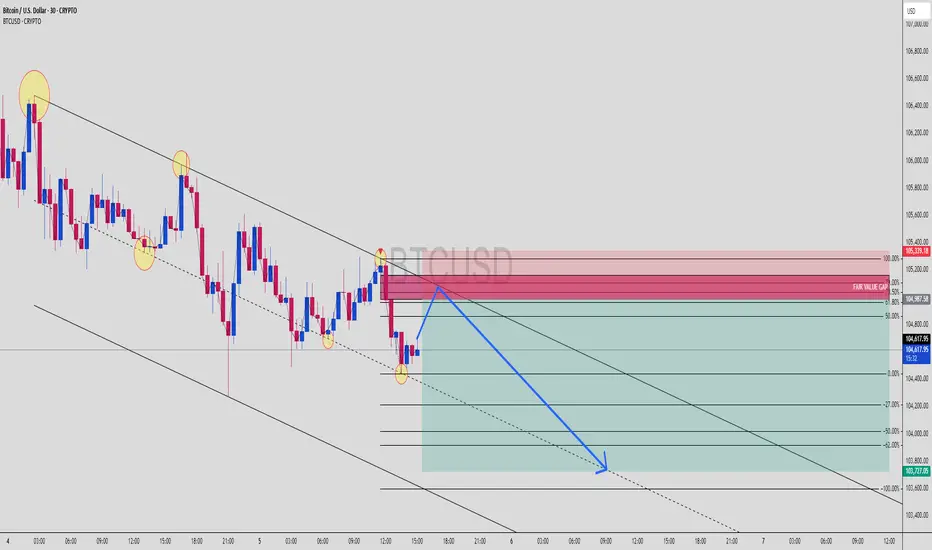
BTC Short Setup! OB + Fair Value Gap + Trend Channel ConfluenceBitcoin (BTCUSD) | 30-Min Chart – High Probability Sell Setup
Bitcoin continues to respect bearish structure inside a descending trend channel, creating prime opportunities for Smart Money traders to strike at optimal levels.
🔍 Trade Breakdown:
Bearish Market Structure
Price is forming lower highs and lower lows
Channel structure is being respected with multiple taps on both the upper and lower bounds
Liquidity Sweeps & Internal Range
Multiple yellow-highlighted zones show liquidity engineering — both buy-side and sell-side have been swept
Recent sweep + demand failure confirms bearish intent
Premium Entry Zone Setup:
🔴 Order Block Zone (OB): 105,200 – 105,400
🟣 Fair Value Gap (FVG): Overlapping with OB – perfect imbalance correction
📐 Fib Levels:
61.8% = 104,987
70.5% = 105,298
79% = 105,388
🔺 This is the kill zone — premium retracement + inefficiency fill = high confluence
Bearish Continuation Expectation:
BTC likely to react at OB zone and continue bearish leg
Projection into discount fib levels:
-27% = 104,000
-62% = 103,800
-100% = 103,727
Channel Respect = Structure Confidence:
Every key swing is aligning with channel resistance/support
Blue arrow shows expected path: liquidity sweep ➝ OB/FVG tap ➝ drop to channel low
🧠 Chart Ninja Entry Plan:
🔹 Entry Zone 105,280 – 105,388 (OB + FVG + 70.5–79% Fib)
🔻 SL Above 105,400 (above OB)
📉 Target 103,727 (channel + -100% Fib extension)
⚖️ RRR Over 1:4 — sniper-grade RR setup
💬 Ninja Wisdom:
You're not chasing moves — you're waiting where liquidity pools.
Fair Value Gaps + OB + Trend Channels = institutional signature.
Trade like Smart Money. Let retail chase candles. 🥷💸
📍 Save this setup before the market plays out
🔁 Share your thoughts below – entry, TP, SL?
👣 Follow @ChartNinjas88 for more sniper BTC setups daily
BTCUSD Rejection Brewing? OB + 79% Fib Tap Could Trigger Short!Bitcoin (BTCUSD) | 30-Min Sell Setup – Order Block + Deep Fib Confluence
This is a classic Smart Money short setup. Price swept lows, rebounded into premium pricing, and is now approaching a high-probability rejection zone — just the way institutional traders like it. 🧠💰
🔍 Breakdown:
Market Structure:
Recent move formed a lower low ➝ market structure is bearish
Current retracement is corrective, moving toward premium sell-side levels
Key Confluences:
🔴 Order Block (purple zone): ~105,200–105,300
🔴 Fib Confluence:
61.8% = 105,178
70.5% = 105,298
79% = 105,388
🔴 Price is tapping OB + 70.5–79% fib zone = sniper territory for shorts
Liquidity Perspective:
Earlier liquidity grab below 104,500 triggered this move
Now climbing back into premium pricing — potential trap before drop
Above the OB: resting liquidity + stop hunts expected
Execution Strategy:
✅ Entry confirmation: Look for M5–M15 bearish engulfing / BOS in OB zone
🎯 Entry area: 105,280–105,388 (limit or confirmation-based)
🛡 SL above 105,400 (above OB & 79%)
💰 TP zone: 104,500 (liquidity pool + fib 0%)
⚠️ Risk-to-Reward Ratio: 1:3+ potential — ideal for scalpers and intraday traders alike
🧠 Chart Ninja Notes:
You’re not chasing highs — you’re stalking where Smart Money sells to the crowd. This is premium pricing in a bearish leg, and BTC is approaching the kill zone. Patience = profit. 😤💸
📈 Game Plan Summary:
🔹 Entry Zone 105,280 – 105,388 (OB + 70.5–79% fib)
🔻 SL Zone Above 105,400
📉 Target 104,488 zone (fib 0%, equal lows)
🎯 RRR Potential 1:3+
💬 Pro Tip:
Wait for price to enter OB and stall before pulling the trigger.
The best trades happen after liquidity is swept — not before.
You’re not a retail trader. You’re a sniper. 🥷💥
📥 Save this setup & review it post-trade
🔁 Share your entry plan in the comments
⚡️ Follow @ChartNinjas88 for daily Smart Money BTC plays

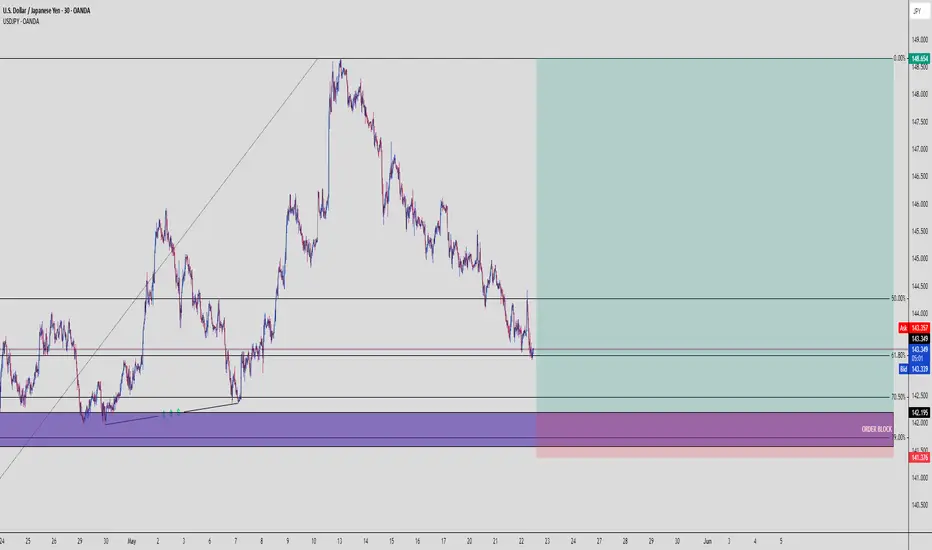
USDJPY Long Setup: Triple Confluence Zone Locked InSmart money traders love one thing more than anything — confluence. This BTCUSD setup hits all the marks:
📈 Structure Breakdown:
Market breaks structure to the upside ✅
Impulsive bullish leg breaks prior high ✅
Pullback into 61.8% golden zone + OB ✅
Rejection wick = perfect entry confirmation ✅
This is a high-probability continuation setup after BTC made a clear bullish BOS (Break of Structure) on the M30 timeframe.
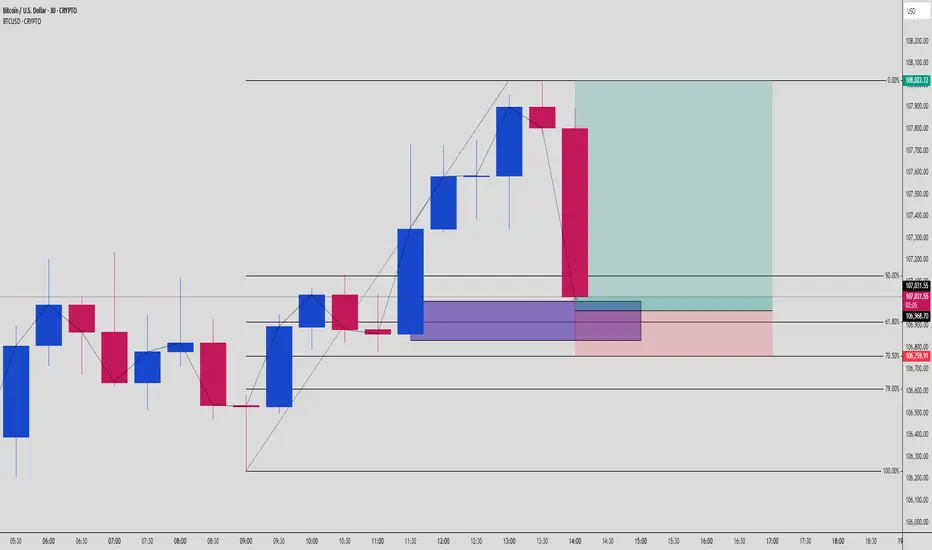
🟦 Order Block Zone:
OB Range:
Top: ~106,989
Bottom: ~106,759
This OB was the last down candle before the big bullish impulse that broke structure. Price returned to mitigate here, then instantly rejected = Smart Money entry confirmed 🔒
🧮 Fibonacci Levels:
61.8%: Sliced right into it
70.5% – 79%: Deeper liquidity zone just below
The entry wick taps right into the sweet OB/Fib confluence zone and launches 🚀. It’s giving sniper precision with a low drawdown entry.
🎯 Trade Parameters:
Entry: ~106,759
SL: Below the OB zone
TP: 108,022 (previous high)
That’s an RRR of around 3.5–4.0x — a clean asymmetric play, just the way smart money wants it.
🔍 Confirmation Factors:
Bullish BOS on M30
Price returns to OB zone + golden ratio
Clean rejection candle with demand absorption
No internal structure break = bullish narrative still valid
🧠 Key Lesson:
“When OB meets Fibonacci, don’t ask why. Load up — the market just told you why.”
Let setups like this come to you. No chasing, no emotions. Let the algo-driven footprints guide you to the money.
📈 Missed this one? Save it for your playbook — this is how high-probability trades are built.
Drop a 💰 if you caught the same move!
BTCUSD: 61.8% Fib + OB = Precision Long PlaySmart money traders love one thing more than anything — confluence. This BTCUSD setup hits all the marks:
📈 Structure Breakdown:
Market breaks structure to the upside ✅
Impulsive bullish leg breaks prior high ✅
Pullback into 61.8% golden zone + OB ✅
Rejection wick = perfect entry confirmation ✅
This is a high-probability continuation setup after BTC made a clear bullish BOS (Break of Structure) on the M30 timeframe.
🟦 Order Block Zone:
OB Range:
Top: ~106,989
Bottom: ~106,759
This OB was the last down candle before the big bullish impulse that broke structure. Price returned to mitigate here, then instantly rejected = Smart Money entry confirmed 🔒
🧮 Fibonacci Levels:
61.8%: Sliced right into it
70.5% – 79%: Deeper liquidity zone just below
The entry wick taps right into the sweet OB/Fib confluence zone and launches 🚀. It’s giving sniper precision with a low drawdown entry.
🎯 Trade Parameters:
Entry: ~106,759
SL: Below the OB zone
TP: 108,022 (previous high)
That’s an RRR of around 3.5–4.0x — a clean asymmetric play, just the way smart money wants it.
🔍 Confirmation Factors:
Bullish BOS on M30
Price returns to OB zone + golden ratio
Clean rejection candle with demand absorption
No internal structure break = bullish narrative still valid
🧠 Key Lesson:
“When OB meets Fibonacci, don’t ask why. Load up — the market just told you why.”
Let setups like this come to you. No chasing, no emotions. Let the algo-driven footprints guide you to the money.
📈 Missed this one? Save it for your playbook — this is how high-probability trades are built.
Drop a 💰 if you caught the same move!
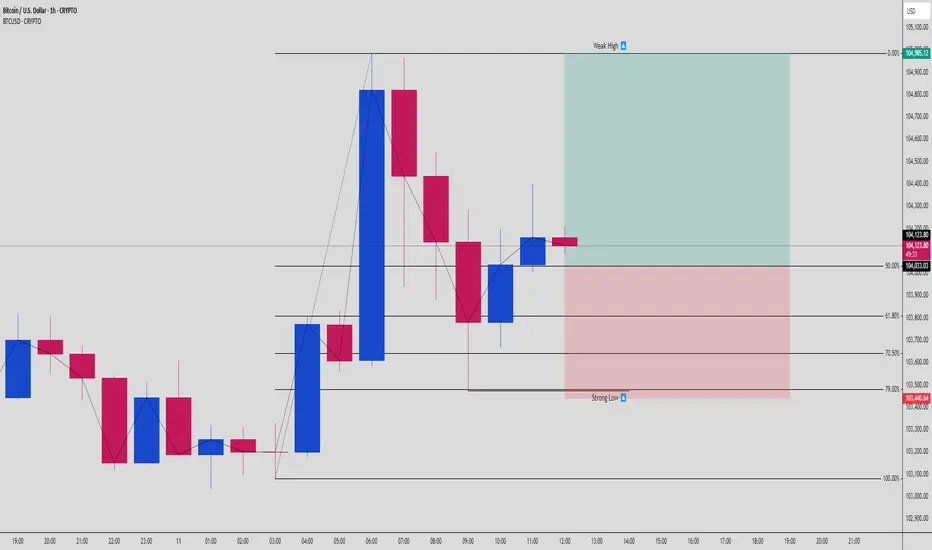
BTCUSD 1H Long Setup | Strong Low to Weak High Play📈 BTCUSD | 1H Long Opportunity | May 11, 2025
BTC just tapped into a Strong Low around the 79% Fibonacci retracement (~103,440) after a powerful bullish push. Now forming a potential long continuation setup toward the "Weak High" marked at 104,985.
🔍 KEY CONFLUENCES:
🔵 Strong Low at 103,440 = clear demand with displacement
🔁 Fib retracement zone: 61.8%–79.0% tapped perfectly
📈 High-Volume Bullish Candle = displacement confirmation
🎯 Targeting the "Weak High" = liquidity magnet
🔂 Expecting BOS (break of structure) above weak high for full validation
📊 Setup Specs:
Pair: BTCUSD
Timeframe: 1H
Entry: 104,100
SL: 103,440
TP: 104,985
RR: Approx. 1:1.25 (solid for continuation scalps)
💡 Smart Money Concepts Breakdown:
We’re playing the classic Strong Low → Weak High liquidity play. Retail might hesitate due to consolidation, but the market structure still favors bullish continuation. Watch for confirmation volume and quick reaction above the high.
📌 Chart Ninjas Reminder:
“Strong Lows are meant to hold. Weak Highs are meant to break. Trade the imbalance in between.”
"BTCUSD | FVG + Order Block Alignment | High Probability Play"⚡ BTCUSD Analysis - 1H Timeframe | April 28, 2025
📊 Price Action Breakdown:
BTC printed a textbook liquidity sweep earlier today, tapping into the Discount Zone perfectly.
Now, the market is pushing up into a high-probability reaction zone where Fair Value Gap overlaps with an Order Block.
🔥 Confluences:
Fair Value Gap (FVG) = Imbalance zone needing filling.
Order Block = Institutional demand/supply where Smart Money left a footprint.
Fibonacci 79% retracement = Sweet retracement level for low-risk entries.
🧠 Why It's Exciting:
The more confluences, the more Smart Money interest.
Price is currently kissing the edge of the FVG, teasing a deeper tap into the OB. This overlap stacks probability heavily for a reaction — either a quick scalp rejection or a full-on move downward.
🎯 Potential Play:
Entry: Inside the FVG or deep into the Order Block for premium entries.
Stop Loss: Just above the Strong High (~94,629) to avoid wicks.
Targets:
Partial at 50% retracement for safer players 🛡️
Full send toward Weak Low zone (~92,839) for maximum RRR hunters 🏹
💬 Pro Tip:
"Always let price show its hand first. Don’t assume, confirm."
🚀 Summary:
✅ Liquidity swept
✅ FVG + OB stacked
✅ 79% Fib lining up
✅ Smart Money trap possibly setting
🧘♂️ Play it with patience. The sniper eats last... but he eats the most.
✍️ Save this chart, tag your trading buddy, and prepare to strike when the premium entry triggers!
➡️ Comment "SETUP LOADING" if you’re stalking this with me!
➡️ Share this with someone who’s tired of guessing entries.

🔥Ethereum's Tightrope: Will the Bear Flag Break? 📉 Levels 👀 🐻 Bear Flag Formation: The chart shows a bear flag pattern, outlined by yellow lines, suggesting a potential continuation of the downward trend after the consolidation. Watch for a price rejection at the upper trendline of the bear flag before a possible move down.
📐 Fibonacci Retracement Levels: Critical Fibonacci zones are plotted:
The 38.2% level at about $3,307 could be the first resistance test.
The golden ratio at 61.8% retracement, $2,823, is likely to offer considerable resistance.
The 100% retracement at $2,039, marking a full return to the start of the price move, might serve as a strong support in a sustained downtrend.
🔵 Resistance Levels: The 'Shibunacci' blue lines indicate potential resistance points, with the highest at $4,451 signaling a significant barrier.
🔴 Support Levels: Marked levels hint at possible support zones, with the bottom level at $1,521 suggesting a pivotal area for bears.
📈 Price Action: Ethereum’s movement within the bear flag and around these key levels will be critical to monitor.
🔄 Indicator Analysis: 'Shibunacci' uses pivots to visualize support and resistance, and price crossing these trendlines could indicate breakouts or breakdowns.
🔮 Potential Outcomes: A break above the bear flag and past $4,451 might change the trend narrative, while a rejection and a drop through supports would confirm the bearish sentiment.
🕵️♂️ In essence, the 'Shibunacci' provides a mathematical approach to market pivot points. The bear flag points to a possible downtrend continuation, but price action near Fibonacci levels and resistance/support will offer clearer signals. Traders should also consider volume and other indicators for confirmation.
🛑 For a short, a stop loss could be considered just above the bear flag pattern or the nearest 'Shibunacci' resistance level to minimize potential loss if the trend reverses.
🚀 If the price climbs above $3,600, scalping opportunities may arise, taking advantage of smaller upward price movements while maintaining tight stop losses to protect against sudden declines.

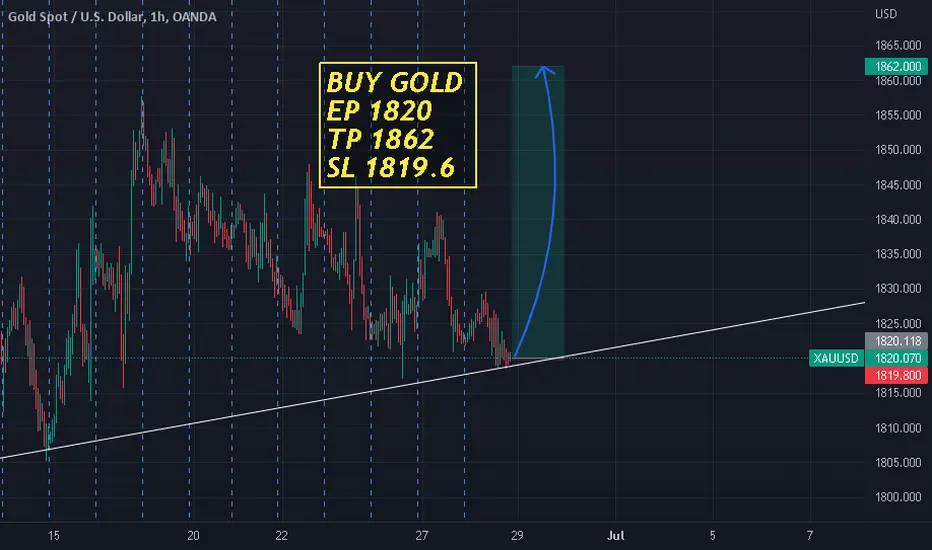
BUY GOLD NOW TO TP1862 40 PIPS #XAUUSD #SCALPINGIt is time for a reversal to rise again at level 1862
BUY GOLD FROM 1820 AND TAKE YOUR PROFIT AT 1862 AND YOUR STOPLOSS 1819
TAKE 40 PIPS EASY TRUST ME AND JUST DO IT