ONT/USDT Break Alert! Indicating Massive Bullish Movement.💎 ONT has certainly made its presence felt in the cryptocurrency market. Currently, ONT is breaking out of the key resistance level in the accumulation phase.
💎 This bullish momentum suggests that ONT may continue its upward movement, potentially reaching our target area.
💎 However, if ONT retreats into the accumulation phase by breaking below the support area, it could indicate a false breakout. In this scenario, the price might reverse and head downward, targeting the bullish OB area around 0.0328.
💎 In the event of a retreat to the support area, it's crucial for ONT to bounce decisively and reclaim the area above the resistance level to resume its bullish trend. Failure to do so could result in further downward movement, possibly reaching the strong support area.
Cryptosignal

MANA/USDT It required Breakout for Continue the upward Move!💎 MANA has indeed made its mark in the cryptocurrency market with significant market dynamics. Currently, MANA is facing resistance at the supply area.
💎 If MANA successfully breaks out above this area with a confirmed daily candle close, it can probability continue its upward movement and reach our target area.
💎 However, if MANA fails to break out above the supply area, there is a potential for the price to be rejected and gradually move downward towards the demand area around 0.574 to establish a new momentum.
💎 At the demand area, it is crucial for MANA to bounce decisively to attempt another breakout above the supply area. Failure to hold the support could indicate a bearish reversal, leading MANA back to downward movement, potentially reaching lower levels.

1INCH/USDT upward momentum frim support? 👀 🚀 1INCH 💎 Paradisers, get ready for an enticing trading adventure with #1INCHUSDT, perfectly perched at a pivotal support zone, suggesting a bullish reversal could be on the horizon.
💎 Diving into #1INCH's saga, we've witnessed a rebound off a tough resistance. Currently, it's testing a crucial resistance threshold. Surpassing this barrier with robust momentum hints at a strong chance for a bullish breakout. We're eagerly awaiting clear evidence that resistance has transformed into support. With the momentum maintained, we're looking to target significant resistance levels at $0.9229, and perhaps even $1.1666.
💎 If the energy behind CRYPTOCAP:1INCH begins to falter, be on alert for a bullish resurgence from the dependable support at $0.5418. Yet, falling beneath this key mark may indicate a tilt towards bearish trends.

XRP USDT - RİPPLE | 1H | TECHNICAL CHARTHello traders, BINANCE:XRPUSDT I have determined the formation target on the chart. I wish everyone success.
Like and comment if you find value in our analysis.
Feel free to post your ideas and questions at the comments section.
Good luck
Wish you many pips
PS: Thank you very much that you support me with your likes and Comments
If you have another analysis at this pair, please share in comments, I will be glad to discuss with you.

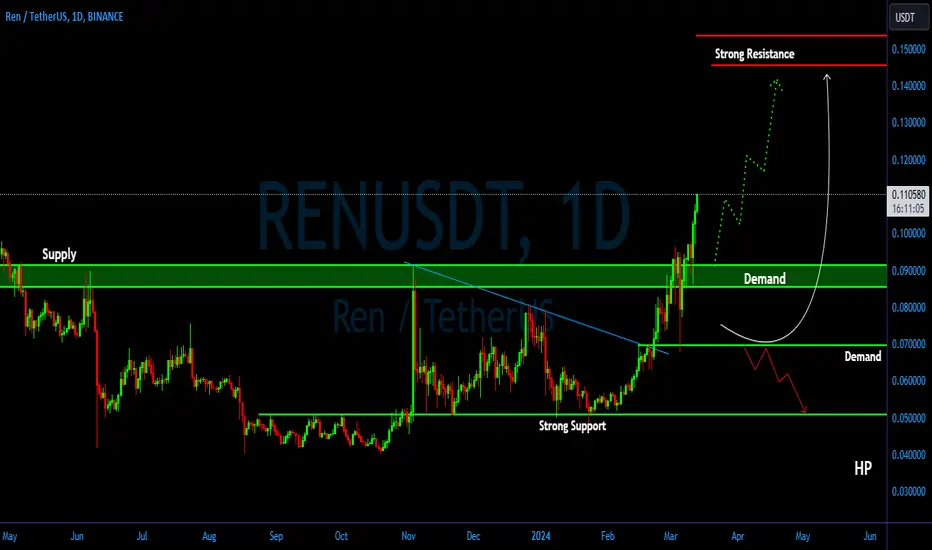
REN/USDT Break Alert! Indicating Continue the Bullish Movement.💎 REN has indeed left its mark in the cryptocurrency market. Currently, REN has successfully broken through the supply area and is currently undergoing a retesting phase at the demand area, which was previously the supply area.
💎 This sets the stage for a potential continuation of the upward movement, probability of reaching our target area.
💎 However, if REN retraces back to the demand area for a retesting phase, it needs to bounce decisively from this level to sustain the upward movement. Failure to hold the demand area could lead to a breakdown below it, potentially pushing the price toward the next demand area around $0.0697.
💎 At the demand area, it is crucial for REN to bounce convincingly, reclaiming the area above the previous resistance for continued upward momentum. Failure to do so may result in a continuation of the downward movement, eventually testing the strong support area.
ZEC/USDT resistance turned to support? What next💎Paradisers, it's time to set our sights on a promising trading opportunity with #ZECUSDT, currently poised at a critical support zone, hinting at an upcoming bullish reversal.
💎ZCASH's Market Trajectory: As we delve into the journey of #ZCASH, we've noted a bounce back from significant resistance. Presently, the price is challenging a key resistance level. A break above this level, accompanied by sustained momentum, signals a high probability of a bullish advance. We're on standby for solid confirmation that the resistance has indeed become support. With continued upward momentum, the price aims to assault key resistance levels at $43.31 or even $50.21.
💎Bullish Bounce and Bearish Warning: Should SEED_DONKEYDAN_MARKET_CAP:ZEC 's momentum start to wane, keep your eyes peeled for a potential bullish bounce from the solid support at $29.30. However, a descent below this pivotal level could signify a shift toward bearish territory.
💎 Market Dynamics and Strategy: As always, we encourage Paradisers to be vigilant and adaptable, ready to adjust strategies in response to market fluctuations. Stay tuned for further developments, and remember, patience and diligence are your strongest allies in these trading waters. Your ParadiseTeam is here to navigate you through this exhilarating journey!

TWT/USDT Indicating upward move and is attempting to break out.💎 TWT has notably made its mark in the cryptocurrency market. Currently, TWT ispoised for an upward move and is attempting to break out of the supply area.
💎 If TWT successfully breaks above the resistance area, it could probability reach our target area in the bearish OB zone.
💎 However, if TWT fails to break out above the resistance area, there is a possibility of a retracement back to the support area around $1.4 - $1.3 to establish new momentum.
💎 In the support area, TWT needs to bounce and resume its upward movement to attempt another breakout above the supply. Failure to hold the support and a breakdown below could signal a shift to a bearish trend, potentially leading to a return to the demand area.

ENJ/USDT Breakout the Key area, Indicating Bullish Momentum!💎 ENJ has recently encountered significant market dynamics. Currently, ENJ has successfully broken above the supply area.
💎There may be a retesting phase at the demand area, which was previously the supply area, before continuing its upward movement and possibly reaching our target area.
💎 During the retesting phase, it is crucial for ENJ to bounce from the demand area if it wants to sustain its upward movement. However, if ENJ fails to maintain the demand area, there is a possibility of a breakdown below the support area, leading to a return to lower price levels.
💎 At the support area, it is imperative for ENJ to bounce and reclaim the area above the resistance for continued upward movement. Failure to do so could signal a bearish trend for ENJ, potentially leading to further downward movement in price.

HIGH/USDT upwardtrajectory what next? 👀 🚀 HIGH Analysis💎 Paradisers, gear up for a thrilling trading prospect with #HIGHUSDT, strategically nestled in a crucial support zone, suggesting a bullish twist ahead.
💎 Diving into #HIGH's voyage, following a recoil from significant resistance, it's ascending from an essential support mark at $2.063. Maintaining this position is key for triggering a bullish wave. Eye the forthcoming target, resistance at $2.683, where overcoming it could elevate the price to $3.117.
💎 Should the momentum for AMEX:HIGH begin to diminish, be on the lookout for a bullish bounce off the robust support at $1.595. Yet, dropping below this essential level could hint at transitioning towards bearish realms.

UNI/USDT Break Alert!! Indicating Continue upward Movement!💎 UNI has recently encountered significant market dynamics. Currently, UNI has successfully broken out the supply area.
💎 There may be a retesting phase at the demand area, which was previously the supply area, before continuing its upward movement and reaching our target area.
💎 During the retesting phase, it is crucial for UNI to bounce from the demand area if it intends to sustain its upward movement. However, if UNI fails to maintain the demand area, there is a possibility of a breakdown below the support area, leading to a return to lower price levels.
💎 At the support area, it is imperative for UNI to bounce and reclaim the area above the resistance for continued upward movement. Failure to do so could signal a bearish trend for UNI, potentially leading to further downward movement in price.

ALGO/USDT facing resistance in the supply area. Breakout ??💎 ALGO has recently encountered significant market dynamics. Currently, it is facing resistance in the supply area.
💎 If ALGO manages to successfully break out above this supply area, confirmed by a daily candle close, there is potential for continued upward movement, possibly reaching our target area.
💎 However, if ALGO fails to break out above the supply area, there is a risk of price rejection, leading to a gradual downward movement towards the support area to seek new momentum.
💎 The support area holds crucial significance for ALGO. The price needs to bounce from this level to attempt another breakout above the supply. Failure to sustain the support area, indicated by a breakdown, would be a bearish sign.
💎 In such a scenario, ALGO may switch back to a bearish trend, potentially leading to further downward movement towards the demand area or even lower levels.

ADA has formed a bullish patternADA has formed a bullish pattern
🔵Entry Zone 0.7201 - 0.7399
🔴SL 0.6703
🟢TP1 0.8054
🟢TP2 0.8996
🟢TP3 0.9632
Risk Warning
Trading Forex, CFDs, Crypto, Futures, and Stocks involve a risk of loss. Please consider carefully if such trading is appropriate for you. Past performance is not indicative of future results.
If you liked our ideas, please support us with your likes 👍 and comments.

SNX has formed a bullish flagSNX has formed a bullish flag
🔵Entry Zone 4.476 - 4.605
🔴SL 4.233
🟢TP1 5.158
🟢TP2 6.078
🟢TP3 8.018
Risk Warning
Trading Forex, CFDs, Crypto, Futures, and Stocks involve a risk of loss. Please consider carefully if such trading is appropriate for you. Past performance is not indicative of future results.
If you liked our ideas, please support us with your likes 👍 and comments.

CRV/USDT bullish trajectory what next? 👀 🚀 CRV Analysis💎 Paradisers, get ready for an exciting trading opportunity with #CRVUSDT, perfectly positioned at a vital support zone, hinting at an upcoming bullish turn.
💎 Exploring #CURVE journey, after a bump against a major resistance, it's now climbing from a key support level at $0.7162. Staying above this level could very well pave the way for a bullish surge. Keep your sights on the next goal, the resistance at $0.8793, with a breakthrough potentially pushing the price up to $1.1246.
💎 If the drive behind LSE:CRV starts to wane, anticipate a bullish resurgence from the firm support at $0.6368. However, a fall beneath this pivotal point might signal a shift into bearish territory.

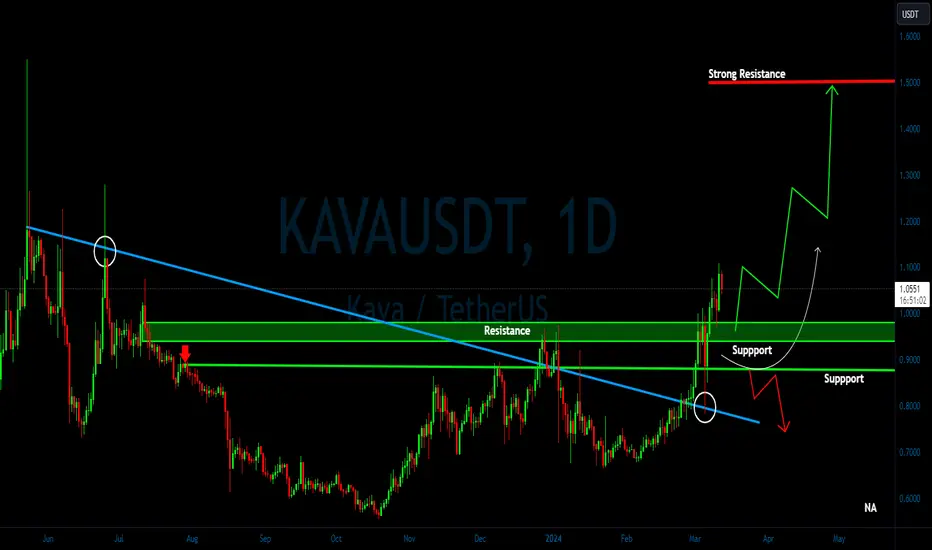
KAVA/USDT Poised for Bullish Breakthrough? 👀 🚀KAVA Analysis💎Paradisers, turn your gaze to #KAVAUSDT as it weaves an intriguing story in the trading world. Positioned within a support zone, it's priming for a potential bullish breakthrough.
💎 A glance at #KAVA's past maneuvers shows a knack for moving through descending channels and launching into upward trajectories. Currently, with the price edging past the critical resistance at $0.9786, we're on the lookout for a bullish wave post-retest, transforming resistance into a launching pad for growth.
💎 Alertness is the watchword for seasoned #KAVA traders. Prepare for a possible bullish wave originating from the support level of $0.8854, particularly if our breakout hopes take a detour. However, dipping below this pivotal point might reveal challenges in maintaining a bullish momentum.
FLOW/USDT planning potential move from key support? 👀 🚀 💎Paradisers, gear up as #FLOWUSDT is on the verge of a noteworthy shift. The current market behavior displays robust momentum from a key support level, suggesting it might breach the resistance at $1.418. We're closely monitoring the situation for a solid confirmation. The moment resistance turns into support marks our cue to act.
💎Aiming for New Heights:Our initial target after the breakout is the resistance at $2.037. Surpassing this barrier opens the door to the next challenge at $2.299. It's crucial to remain cautious, as the market could present psychological traps during this ascent. Await firm confirmation before executing any trades to navigate through these tactical deceptions successfully.
💎 Prepared for Any Downturn:Acknowledging the unpredictable nature of the market, we're also braced for possible downturns. Should the #FLOW price fall beneath the $1.418 support, a bullish recovery from the lower support at $1.084 could occur, yet a drop below this level would necessitate a strategy recalibration. Planning short positions might be wise in this scenario, indicating reduced buying interest and a tilt towards bearish sentiment.
💎Mastering Market Dynamics:As astute traders, we're equipped to consider every potential outcome, poised to adapt our strategies according to the evolving market conditions. Stay vigilant and patient, as these qualities are indispensable for successfully navigating the trading seas. Rest assured, the Paradise Team stands with you, ready to assist at every turn of this thrilling voyage!
