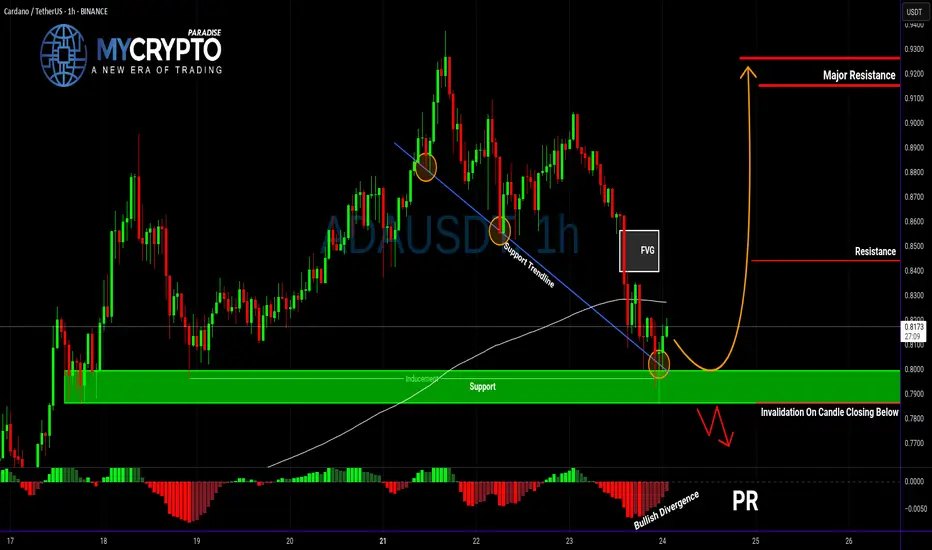
ADA About to Explode or Collapse?Yello Paradisers — is ADA gearing up for a breakout, or are we walking straight into a bull trap? After the recent pullback, the market is throwing mixed signals, but this setup is becoming too important to ignore. Here’s what we’re seeing right now on ADAUSDT.
💎ADA is currently showing positive signs of strength after a solid retracement. Current support zone is not only a historical price pivot, but it's also aligned with a supportive trendline, the 200 EMA, and a developing bullish divergence on the chart. All these factors combined are increasing the probability of a short-term bounce — but that doesn't mean we go in blind.
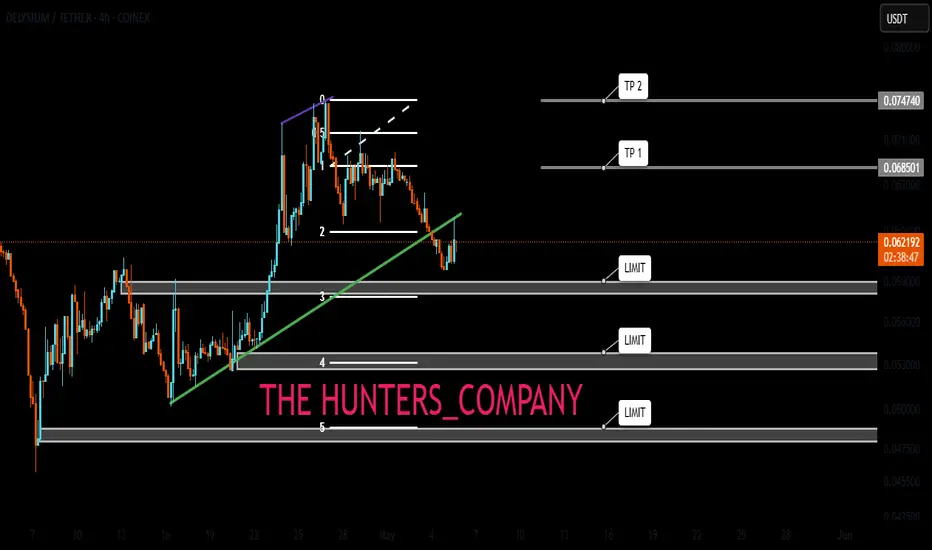
💎For aggressive traders, entering at the current price might make sense, especially if you’re targeting the first resistance level. However, it’s important to note that this entry offers a relatively limited reward compared to the risk — roughly a 1:1 risk-reward ratio — so it’s crucial to size your position accordingly and keep tight control over your stop loss.
💎If you're looking for a cleaner setup with a better risk-to-reward profile, patience is key. A more favorable scenario would be waiting for a proper pullback and a confirmed retest of the support zone. Ideally, you want to see a strong bullish candle at the support level to signal continuation — that’s when the setup shifts from average to high-probability.
💎But be cautious. If the price breaks down and closes a candle below our support zone, the entire bullish idea becomes invalid. In that case, it’s much wiser to step back and allow the market to develop more structure before re-engaging. Forcing trades in uncertain conditions is where most traders lose, and we don’t want to be part of that crowd.
🎖Strive for consistency, not quick profits. Treat the market as a businessman, not as a gambler. Be patient, Paradisers — only those who follow structured strategies and risk management will thrive in the long run.
MyCryptoParadise
iFeel the success🌴
Cryptosignals
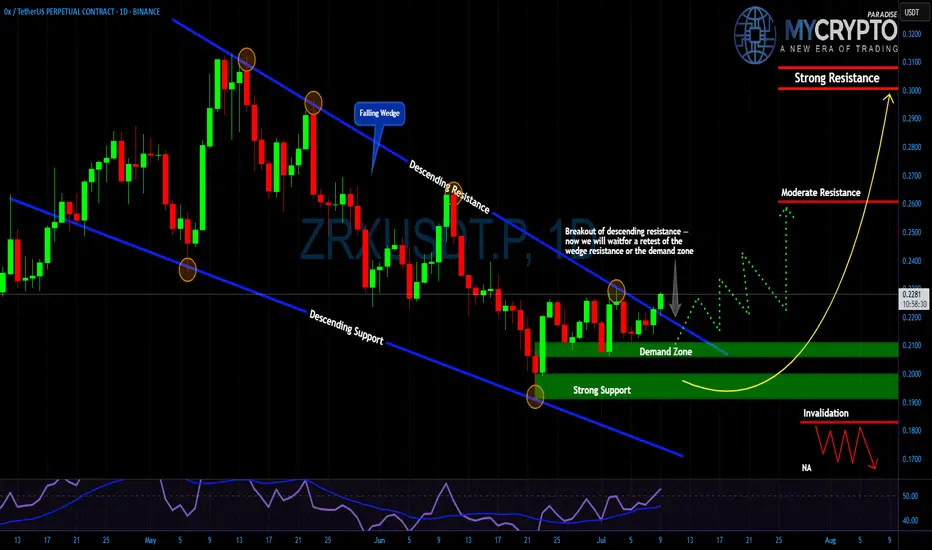
ZRX Just Broke Out… But Is It a Bull Trap Before a Collapse?Yello Paradisers did you catch that breakout from the falling wedge, or are you about to get faked out like the rest?
💎#ZRX/USDT has finally broken out of its descending resistance after weeks of compression. While this is a promising signal, this move alone is not enough. What really matters now is how price behaves on the retest. We're watching closely for a pullback either into the previous wedge resistance or directly into the key demand zone between $0.205 and $0.215. That area needs to hold if the bulls want to keep momentum on their side.
💎The structure remains valid as long as we stay above the $0.180 level. A break below that zone would completely invalidate this bullish setup and open the door to a deeper drop. On the upside, if buyers step in with volume, the path toward $0.260 and possibly $0.300 becomes much more realistic.
💎This is not the moment to chase. Let retail traders jump in too early our job is to position smartly, not emotionally. Watch the retest, measure the reaction, and act only when the market confirms.
This is where most retail traders get trapped, they chase the move too late or panic-sell too early. Don’t be that trader. Stay focused. Be precise.
MyCryptoParadise
iFeel the success🌴
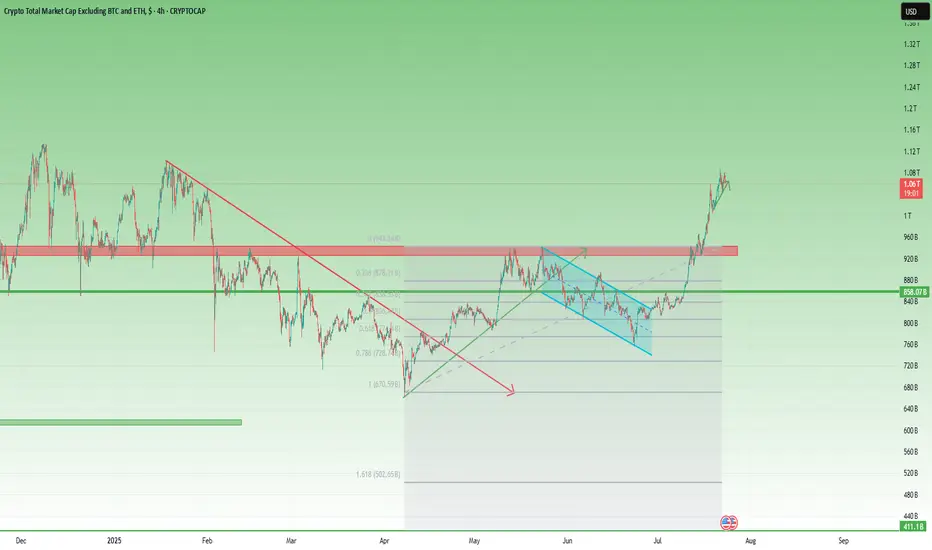
Total3 – Back Above 1T, but Will It Offer a Second Chance?📈 What happened since April?
After the sharp low in early April, Total3 began to recover steadily.
Toward the end of the month, it broke above the falling trendline that had been holding since January — a key technical shift.
This triggered a strong recovery rally, pushing total altcoin capitalization (excluding BTC & ETH) to the 930–940B resistance zone.
📉 Then came the pullback…
Price printed a double top near resistance, followed by a drop — but not a bearish one.
Instead, the correction was orderly, forming a bullish flag, with the low landing right on the 61.8% Fibonacci retracement. Classic healthy structure.
🚀 The latest breakout
Earlier this month, Total3 launched a very impulsive leg up, reclaiming the 1 trillion level with strength.
At the time of writing, we’re trading back above 1T, and momentum remains on the bulls’ side.
However, the chart does look a bit overextended in the short term, suggesting a correction could follow soon.
🧭 Trading Plan – Will We Get a Retest?
The textbook play would be to wait for a deep pullback toward previous support levels.
BUT – I don’t believe we’ll get a full retest of the breakout. Altcoins may stay elevated or correct only modestly.
Instead, I’ll be watching the 1T zone and slightly below — that’s where I’ll look to load up on interesting altcoins.
📌 Conclusion:
Total3 has broken structure, reclaimed key levels, and is showing classic bullish continuation behavior.
The market may not offer you the perfect entry — but small dips near 1T could be all we get before another move higher. 🚀
Be prepared. Don’t wait for perfection in a market because rarely gives it.
Can #GALA Sustain the Current Bullish Momentum or Will it Fall?Yello, Paradisers! Is this #GALA pullback just a healthy retest before another explosive rally, or are we about to see a deeper drop that will wipe out impatient bulls? Let’s break it down:
💎After weeks of trading inside a descending channel, #GALAUSDT finally broke above the descending resistance, sparking renewed bullish momentum. The breakout has pushed the price toward the $0.020 zone, but now #GALA has encountered a resistance zone (previously support). The question remains: will GALA maintain this level or revisit lower supports before proceeding higher?
💎The current structure shows #GALAUSD attempting to convert its previous resistance into new support around $0.018–$0.020. A clean retest of this support zone would significantly increase the probability of a sustained bullish continuation. The 50EMA acting as support and positive macro trend in crypto market reinforces our bullish bias.
💎If buyers remain in control, the first upside target is the moderate resistance at $0.0253. However, the major profit-taking and strong selling pressure are expected near the $0.0312 zone, where the strongest resistance lies. A successful break and hold above this level would confirm a more aggressive bullish trend.
💎On the flip side, the bullish setup becomes invalid if #GALA loses the strong demand zone at $0.0162–$0.0134. A confirmed close below $0.0134 would flip the structure bearish and open the door for another leg down.
Stay patient, Paradisers. Let the breakout confirm, and only then do we strike with conviction.
MyCryptoParadise
iFeel the success🌴

TIA- Is the Coin Finally Ready to Wake Up?After its launch on Binance in November 2023 and the immediate 10x pump, BINANCE:TIAUSDT has been, to put it mildly, a constant disappointment.
Since then, the hype has faded, and the price slowly deflated — leaving holders frustrated and the chart uninspiring.
🔍 Recent Signs of Life
However, something has started to shift.
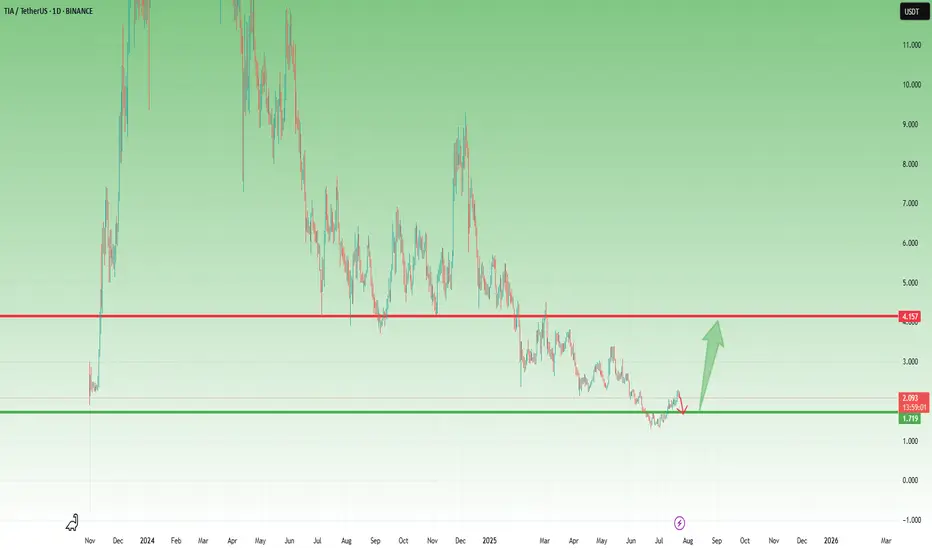
After a fresh dip to 1.35, the coin formed a small double bottom and managed to recover above the 2.00 zone.
⚠️ Important to note: the rise hasn’t been impulsive.
But in the context of a broader altcoin revival — which I've outlined in my recent dominance analyses — TIA could become a decent candidate for a relief rally.
🔽 What I’m Watching
The recent structure looks like a bearish flag, and there’s a decent chance the pattern breaks down first before any real rally begins.
That’s why I’m watching the 1.70 area closely.
If price dips into that zone and gives a positive reversal signal, I’ll look to buy the dip.
🎯 Target and Potential
My upside target for this move is around 4.00, which would represent over 100% potential from the entry zone.
No moon calls. Just technical setup + potential market rotation + favorable risk/reward.
✅ Conclusion
TIA isn’t a favorite.
But sometimes, unloved charts offer the cleanest reversals.
I’ll let the market speak near 1.70.
If it holds and gives confirmation — I’m in. 🚀
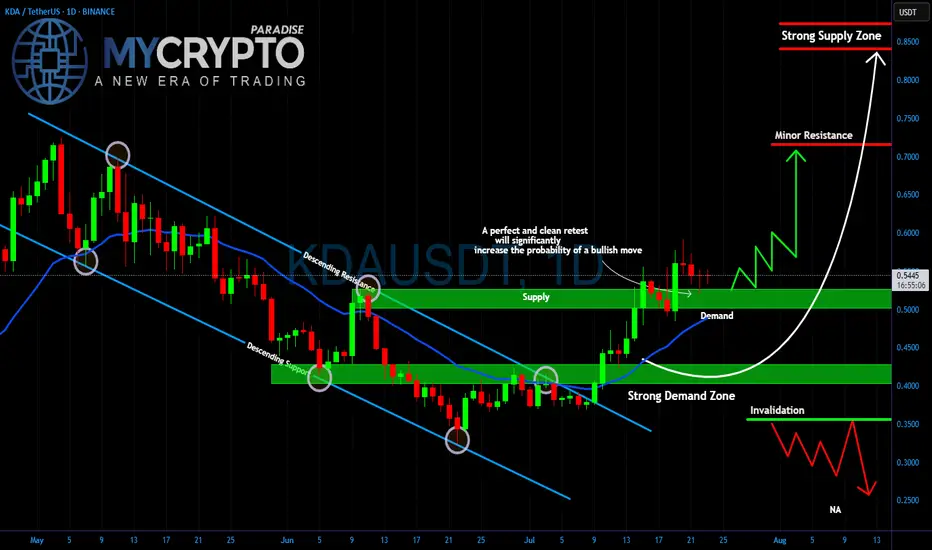
KDA Breakout or Fakeout? Critical Retest AheadYello Paradisers, is #KDA setting up for a major bullish move, or are we looking at another trap designed to wipe out impatient traders? The price has broken out of the descending channel that has been controlling the market for weeks, and now all eyes are on the retest.
💎The strong demand zone around $0.40–0.45 has been the key accumulation area for weeks, holding firmly every time the price dipped. Right now, #KDAUSDT is trading above the $0.50–0.55 demand level, which is acting as a critical support. A clean and confirmed retest of this zone would dramatically increase the probability of a bullish continuation.
💎If buyers step in aggressively, the first target will be the minor resistance at $0.70. Breaking above that could open the way for a push toward the strong supply zone at $0.85, where heavy selling pressure is expected. But if the demand fails and price drops below $0.35, this bullish scenario is invalidated, and a deeper move towards $0.25 becomes likely.
Trade smart, Paradisers. This game rewards patience and discipline, not reckless entries. Stick to your strategy, and you will stay ahead of the herd.
MyCryptoParadise
iFeel the success🌴
Altcoin Season May Be Real This TimeBitcoin Dominance Finally Breaks – Altcoin Season May Be Real This Time
Since late 2022, Bitcoin Dominance has been on a steady rise — and during this time, the vast majority of altcoins have bled heavily, losing value both in USD and BTC terms.
The long-awaited “altcoin season” became a meme more than a market event.
Every rally was short-lived, and rotation never truly materialized.
Until now...
________________________________________
📉 A Technical Break That Matters
Looking at the BTC.D chart, we finally see something meaningful:
➡️ A clear technical breakdown under confluence support given by the horizontal one and the rising trend line, which held for months and provided the structure for BTC outperformance.
At the same time, Bitcoin is stable around the 120k zone, and the price action suggests strength — not mania, not collapse — just solid consolidation at high levels, and most probably preparing for new ATHs.
This environment historically tends to be favorable for alts.
________________________________________
USDT Dominance (USDT.D) Also Pointing Lower
The USDT.D chart adds even more confluence to the idea:
• It's now pointing towards support
• The structure suggests there’s room for a further drop, which historically means more money flowing into risk assets — particularly altcoins
When stablecoins dominance drops, it usually reflects increased market participation and risk-on behavior — exactly what altcoins need to finally shine.
________________________________________
🔍 What Am I Doing?
I’ve already started buying selected altcoins and I'm looking to add more on dips.
This technical shift is meaningful. It’s not about catching hype, it’s about recognizing a real potential rotation.
In conclusion, I’ll be looking for strong altcoin setups to buy on pullbacks,
as I believe the next weeks and months could offer the kind of upside that can at least double my investment (yeah, yeah, I'm not "to the mooner, hoping for 100x ).

IMXUSDT – Major Breakout or Another Painful Trap Ahead?Yello Paradisers, is this the real start of a powerful bullish reversal on #IMX, or just another classic setup to liquidate impatient traders before the true move begins? The next few days will decide everything.
💎#IMXUSDT has broken out of a falling wedge, which is a typical bullish reversal structure, and is now retesting the strong demand zone between $0.45 and $0.49. As long as the price holds above this level, the bullish scenario remains intact, with $0.659 as the first key resistance to watch.
💎A clean break above $0.659 could open the way toward $0.734, while the critical resistance zone at $0.843 will be the ultimate test of whether IMX can shift into a sustained uptrend.
💎However, the invalidation level sits at $0.401. If this level fails, expect a fast move back toward $0.30, which will likely wipe out many traders who jumped in too early.
This is exactly where most retail traders get trapped. They either chase the move too late or panic-sell too early.
MyCryptoParadise
iFeel the success🌴

PEPE WILL WE GO TO .000035 ? Evening
so if we can break this orange level here ie this top in price action then a nice run up to .000035 makes send.
stay tuned this is wild one
what do you think Pepe will do ?
Kris/ Mindbloome Exchange

SOLANA DRIVING UP TO 294 Good evening everyone
It looks like SOL made a nice W pattern and now breaking its weekly high is driving up to 294
Enjoy happy trading this bull run
Kris/ Mindbloome Exchange
Trader Smarter Live Better

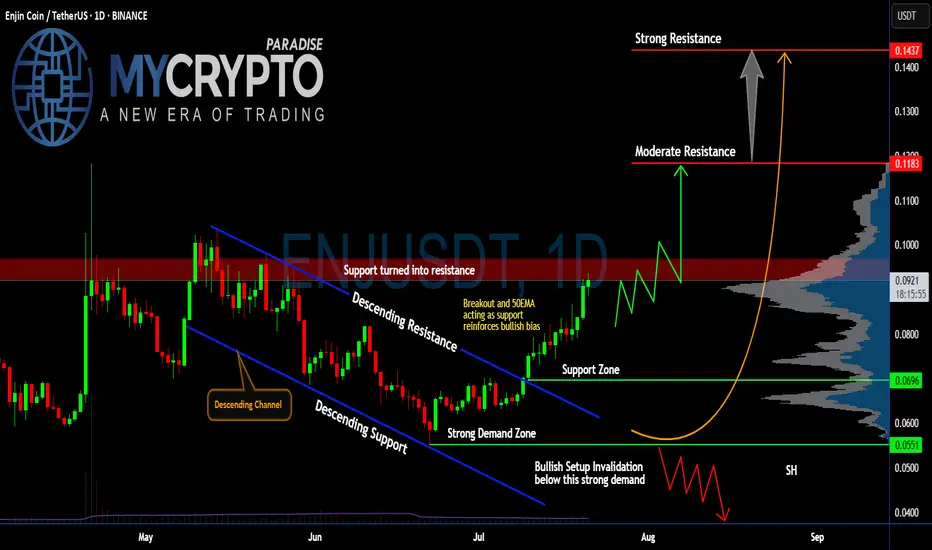
Will #ENJ Soar Further or a Trap is Set Ahead? Watch Closely Yello, Paradisers! Is this breakout on #ENJUSDT the start of a strong bullish reversal, or just another trap before a brutal flush to shake out late buyers? Let’s break it down:
💎After weeks of bleeding inside a clear descending channel, #EnjinCoin has finally broken out of the descending resistance, showing the first real bullish momentum in a while. Price is currently trading around $0.0917, with the 50EMA now acting as fresh support—this adds weight to the bullish bias for #ENJ.
💎If bulls can break above the resistance zone (previously support) between $0.091 and $0.096, we could see a push toward the moderate resistance at $0.1183. That’s the first major hurdle where sellers are expected to step in. A clean breakout above this level would open the door for a larger move toward the strong resistance at $0.1437, where a heavy supply zone sits, and profit-taking will likely accelerate.
💎The strong demand zone between $0.0551 and $0.0696 has been respected multiple times in the past, with aggressive buying every time price dipped into it. This is classic accumulation behavior, which often precedes stronger impulsive legs up—if volume keeps supporting this move.
💎But don’t get trapped, Paradisers. If the price breaks back below $0.0696 and especially loses the strong demand at $0.0551, the bullish setup for #ENJUSD will be invalidated. That would likely trigger a deeper correction, pushing us back toward $0.04. We’ll wait patiently for the next high-probability setup before taking any new positions.
Stay patient, Paradisers. Let the breakout confirm, and only then do we strike with conviction.
MyCryptoParadise
iFeel the success🌴
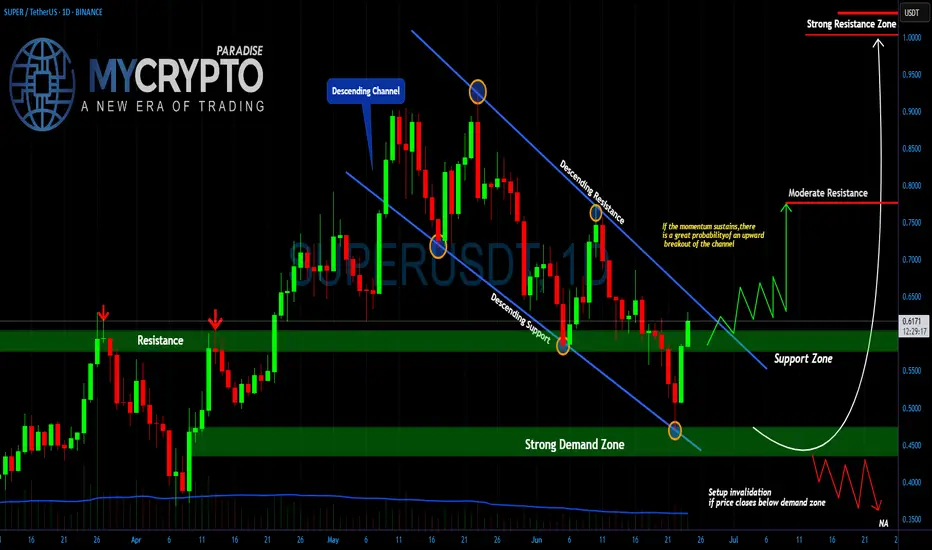
SUPER Breakout Incoming or Just Another Trap Before the Flush?Yello, Paradisers is SUPER about to explode out of this structure, or are we being lured into a fakeout before the next rug pull? This setup is too clean to ignore, and the next few candles will tell us everything.
💎The daily chart on #SUPERUSDT reveals a well-respected descending channel that has dictated price action for over two months. After multiple rejections from the upper boundary and rebounds off the lower trendline, the price has now shown its first serious signs of momentum since bottoming in the strong demand zone around $0.45–$0.50. This zone has held firmly, marking the third time price has bounced from this key level a textbook area of interest where buyers consistently step in.
💎What's notable here is the confluence between the demand zone and the descending support line. The most recent bounce was not only from this dual-support area, but also accompanied by a shift in momentum that has pushed the price back toward a critical inflection point the resistance-turned-support zone at $0.58–$0.62. This level has acted as resistance before and now becomes the level to reclaim for the bullish scenario to stay valid.
💎If the price breaks and closes above the upper boundary of the descending channel and holds above the $0.60–$0.62 region, the path opens toward the moderate resistance at $0.75. Should bullish momentum continue, we could be looking at a retest of the psychological and historical strong resistance zone near the $1.00 mark where we’d expect both aggressive profit-taking and liquidity to build up.
💎On the flip side, any failure to break out and sustain above the current resistance would likely send price back down to retest the demand zone. If the structure gives in and closes below $0.45 on the daily timeframe, this would invalidate the bullish thesis completely and could trigger a sharper drop toward $0.35 or even lower as the broader market liquidates over-leveraged longs.
MyCryptoParadise
iFeel the success🌴
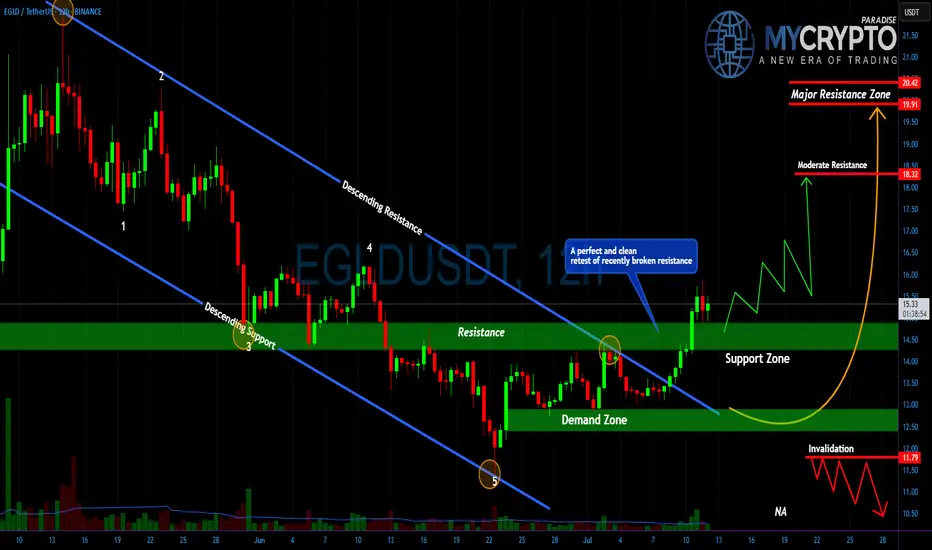
Most Will Get Trapped on EGLD’s Next Move Don’t Be One of ThemYello Paradisers, did you catch the EGLD breakout or are you still waiting for confirmation that’s already gone? While most traders are sleeping on this setup, it has just completed one of the cleanest breakout-and-retest patterns we’ve seen in weeks, and what comes next could leave many trapped on the wrong side.
💎#EGLDUSDT recently broke through its descending resistance with strength and has now retested that same level, which is acting as solid support in the $14.30–$15.00 range. This successful flip of resistance into support is a textbook bullish signal, and it’s holding beautifully indicating strong buyer presence and increasing the probability of continued upside.
💎If this support holds firm, #EGLD is eyeing a move toward the $18.00–$18.25 region, where moderate resistance is expected. A break above this could open the path toward the $19.90–$20.40 zone, a significant resistance level that may shape the next macro structure on this chart.
But it’s not all upside. If EGLD fails to hold the $13.00 level and especially the key invalidation point at $11.85 this entire bullish setup breaks down, and sellers will likely take control. The bullish momentum would collapse fast, and the door would open to much deeper downside levels.
MyCryptoParadise
iFeel the success🌴
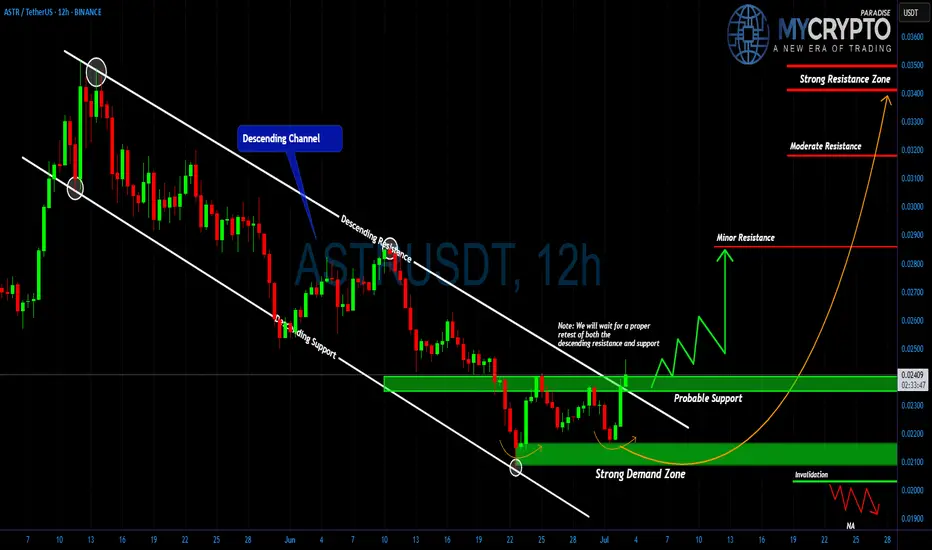
Is ASTR About to Break Out or Break Down? Don’t Miss ItYello Paradisers! Are you positioned correctly, or will you once again find yourself on the wrong side of the market when the real move begins? If you’ve been with us, you know we’ve been waiting for this kind of setup with patience, and now it's time to pay attention.
💎#ASTR/USDT has been moving inside a clean descending channel, respecting both the upper resistance and lower support lines consistently. However, recent price action suggests a potential shift in momentum. After tapping into the strong demand zone between 0.0200 and 0.0215, the price has shown multiple sharp rejections from the lows, indicating that buyers are quietly stepping in.
💎Currently, the price is attempting to break out of the descending structure. We are closely watching how it reacts around the 0.0240 area, which is now acting as probable support. A successful retest of this level would be a significant structural shift, and it opens up the path to retest 0.0280 our first minor resistance. If momentum continues to build and that level breaks, the doors are wide open toward the 0.0310–0.0320 zone, with the final strong resistance sitting around 0.0345.
💎On the flip side, invalidation occurs if the price fails to hold above 0.0210. A clean break below that level could send #ASTR back toward 0.0190, nullifying the current bullish setup. Until then, we remain cautiously optimistic, waiting for the market to confirm direction before committing fully.
Stay sharp, Paradisers. The market is about to pick a side and we’ll be on the right one.
MyCryptoParadise
iFeel the success🌴
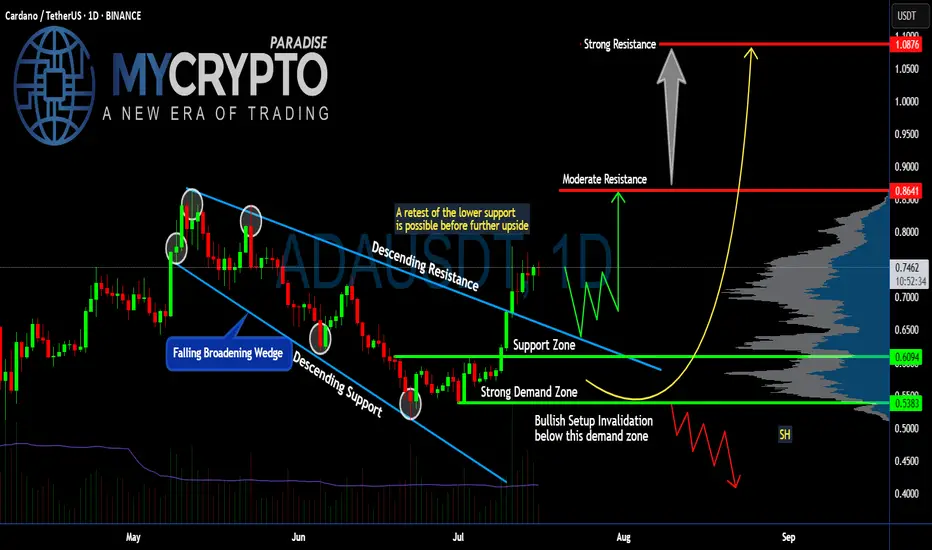
Is #ADA Ready For a Major Move or a Trap is Ahead? Watch this Yello, Paradisers! Is this breakout on #Cardano the start of a major upside move or just another bull trap waiting to flush out impatient traders? Let’s break down the latest #ADAUSDT setup:
💎After weeks inside a falling broadening wedge, #ADA finally broke above the descending resistance, signaling a potential trend reversal. The breakout above $0.70 has pushed the price toward the current $0.74 zone. The soaring volume and a positive broader market outlook reinforce our bullish bias. While this looks bullish, the key question is whether #ADAUSD will hold above its reclaimed support or retest lower levels first.
💎The structure is straightforward: #ADA reclaimed the support zone around $0.70 after bouncing strongly from the demand zone near $0.61–$0.60. This demand zone remains the critical area to watch—any healthy retest here would provide a high-probability continuation setup for bulls.
💎If buyers maintain control, the first target sits at the moderate resistance of $0.86. That’s where the next notable selling pressure is expected. But the real battle will take place near the strong resistance at $1.08—a zone where major distribution and profit-taking could occur.
💎However, the bullish setup becomes invalid if #ADAUSD loses the $0.61–$0.60 demand zone. A confirmed close below $0.538 would flip the structure bearish, signaling a potential continuation to lower lows.
Stay patient, Paradisers. Let the breakout confirm, and only then do we strike with conviction.
MyCryptoParadise
iFeel the success🌴
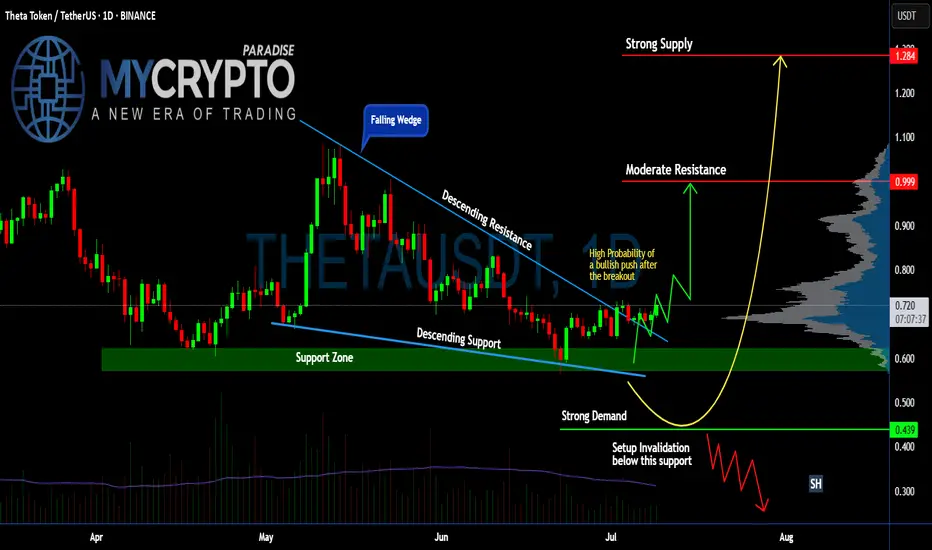
Is #THETA Ready For a Major Reversal or Another Fakeout ahead?Yello, Paradisers! Is this breakout the beginning of a bullish reversal for #THETA or just a setup to trap the herd before a sharp dump? Let’s break down the setup of #ThetaNetwork:
💎After weeks of slow bleeding inside a falling wedge, #THETAUSDT has broken out of this pattern. The price is currently hovering around $0.718, and it’s the first time in weeks we’re seeing real bullish momentum starting to build. The volume is slowly picking up, so the probability of a bullish push is higher.
💎A clean breakout above the descending resistance now opens the door toward moderate resistance at $0.999. That’s the next key hurdle where we expect sellers to show up. If bulls are strong enough to clear that zone, we’re targeting the strong supply level at $1.284, where significant distribution will likely begin.
💎Why this setup matters: The support zone between $0.60 and $0.66 has acted as strong demand for multiple weeks now for #THETAUSD. Price wicked into it again recently and got bought up quickly, forming a potential higher low. This kind of accumulation behavior often precedes a strong leg up if volume confirms the move.
💎However, if price loses the key support at $0.60, and more importantly breaks below the setup invalidation level at $0.439, we’ll treat this as a failed breakout and expect a deeper correction. That would bring us back into the lower demand zones, and we’ll sit on our hands until the next proper high-probability entry appears.
Stay patient, Paradisers. Let the breakout confirm, and only then do we strike with conviction.
MyCryptoParadise
iFeel the success🌴
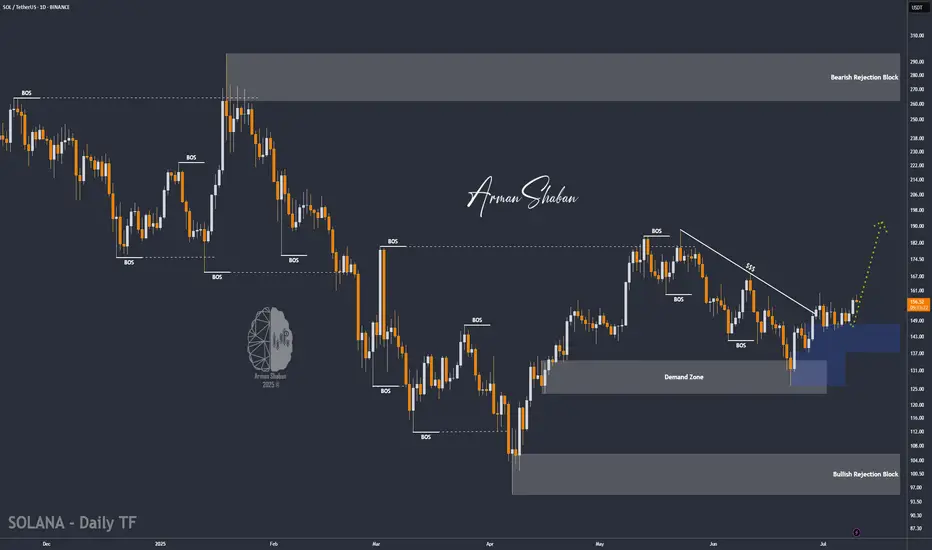
SOL/USDT : SOL Rebounds Strong – Is a 25% Rally Just Beginning?By analyzing the Solana (SOL) chart on the daily timeframe, we can see that after dropping to the $147.75 zone, the price experienced renewed buying pressure and has since rallied to around $159, delivering over 6% return so far.
This cryptocurrency shows strong bullish potential, with short-term gains possibly exceeding 25%.
The next upside targets are $168.5, $187, $220, and $263.
Please support me with your likes and comments to motivate me to share more analysis with you and share your opinion about the possible trend of this chart with me !
Best Regards , Arman Shaban
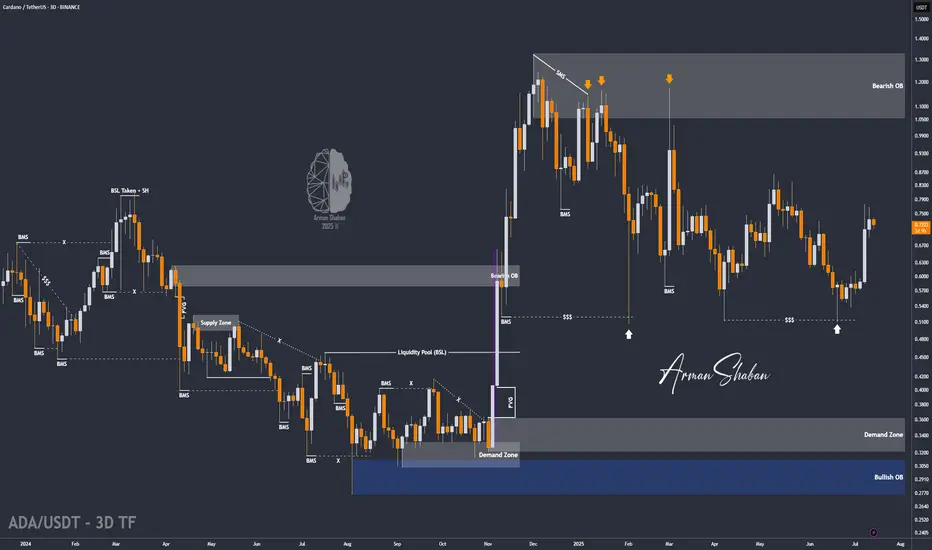
ADA/USDT : +50% in 21 Days, More Rise Ahead? (READ THE CAPTION)Over 50% growth in just 21 days — Cardano’s explosive rally continues, and the $0.76 target has now been hit! Since our last analysis, ADA has kept pushing higher, successfully reaching the next key level and bringing the total return from this move above 50%. Currently trading around $0.73, with strong bullish momentum still in play, I expect it won’t be long before we head toward the next targets. Upcoming levels to watch: $0.93, $1.05, and $1.33 — we’re getting closer to that 100% gain!
Please support me with your likes and comments to motivate me to share more analysis with you and share your opinion about the possible trend of this chart with me !
Best Regards , Arman Shaban
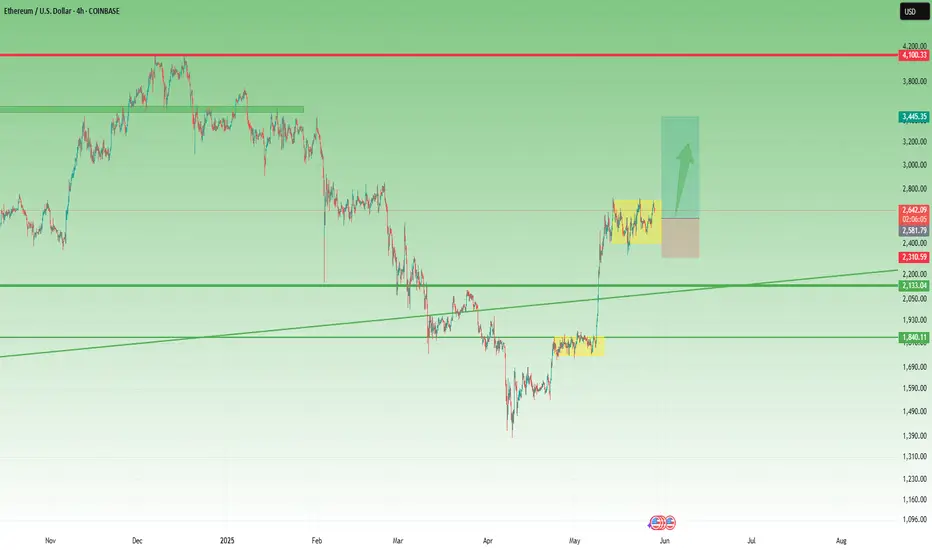
Ethereum – Calm Before the Next Leg Up?Ethereum had a disappointing start in 2025.
After pushing above $4,000 in mid-December 2024 — with headlines full of "$10K ETH coming!" — the new year began around $3,500, and what followed was a slow bleed.
By early April, Ethereum printed a shocking low at $1,380 — a level few believed was even possible.
But the bounce from there? ⚡
It was explosive — nearly +100% in just one month, with price topping around $2,700.
Since then, we’ve been consolidating — and that’s completely normal after such a vertical move.
🔍 So, what’s next?
Technically, ETH is forming a rectangle, a structure that often resolves as a continuation pattern.
The spike down to the $2,300 zone on May 19th was telling — buyers stepped in aggressively and pushed price back above $2,500, which now acts as a comfort zone for bulls.
📌 Conclusion
I’m looking to buy dips, ideally near $2,550, and my target is the $3,500 zone.
No need to reconsider the bullish outlook as long as price holds above $2,300.
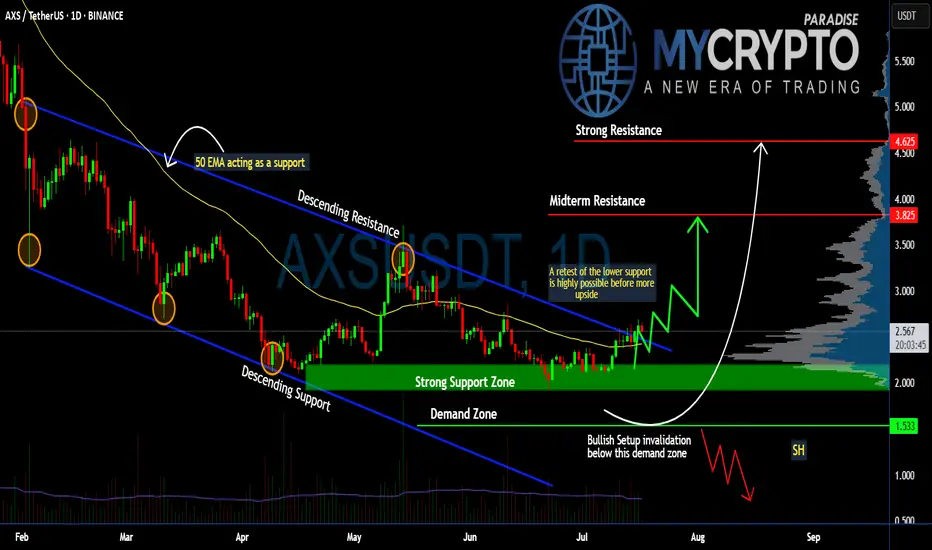
Can #AXS Bulls Sustain the Momentum or Will it Fall? Key LevelsYello, Paradisers! Will #AXS finally deliver a strong upside move, or are we just seeing another setup to trap impatient bulls before a deeper drop? Let’s break down the latest #AXSUSDT structure:
💎After months inside a descending channel, #AxieInfinity has finally broken above the descending resistance, showing early signs of a potential trend reversal. The current price trades around $2.56, but history tells us a retest of lower levels is still highly possible before any sustained upside move. The soaring volume and a positive broader market outlook reinforce our bullish bias.
💎The structure is clear: the strong support zone sits between $2.20–$2.00, and this is the first critical level to watch. A healthy retest here would provide a high-probability continuation setup for bulls. Below that, the demand zone at $1.53 is the last stronghold—losing this level would invalidate the bullish scenario completely.
💎If buyers maintain control, the first upside target stands at the midterm resistance of $3.82, where some profit-taking and selling pressure are expected. A clean breakout above this zone could push the price toward the strong resistance at $4.62, where major distribution could occur.
💎However, the bullish setup becomes invalid if #AXSUSD loses the $1.53 demand zone. A confirmed daily close below this level would flip the structure bearish and open the door for a move to new lows.
Stay patient, Paradisers. Let the breakout confirm, and only then do we strike with conviction.
MyCryptoParadise
iFeel the success🌴
Will LINKUSDT Explode Soon — or Collapse Into a Trap?Yello Paradisers, are you prepared for the next big LINK move? The breakout you’ve been waiting for just happened — but before you jump in, let’s break down what’s really going on behind the chart.
💎LINKUSDT has officially broken out of its descending channel — a significant structural shift that immediately increases the probability of a bullish continuation. On top of that, we’ve seen a bullish CHoCH (Change of Character), a powerful sign that demand is stepping in. These are early but critical signs that bulls may be regaining control.
💎However, experienced traders know not to act on the first sign of strength alone. We now need to see how price behaves on the pullback. If LINK pulls back and takes out the inducement (removing weak hands), we’ll be looking for a bullish internal CHoCH (I-CHoCH) on the 1H timeframe. If that forms, the probability of a solid bounce from the support zone becomes extremely high — giving us the confirmation we need to position for upside.
💎On the other hand, if price breaks down and closes a candle below the support zone, this entire bullish setup becomes invalid. In that case, it would be wise to remain patient and wait for better, more reliable price action to develop before making any move. This is exactly where most traders lose by forcing trades instead of waiting for clear signals.
🎖A big liquidation event, which will first take both longs and shorts and fully get rid of all inexperienced traders before the real move happens, is very close to happening again. so make sure you are playing it safe Paradisers. It will be a huge money-maker for some and a total disaster again for the majority.
MyCryptoParadise
iFeel the success🌴

NEON : How long does the decline last?Hello friends
If you are a holder of this currency or have bought it, you should know that the token release is coming and this will cause the price to drop, so be careful.
We have identified good buying ranges for you, where you can buy in case of a drop, with risk and capital management.
*Trade safely with us*

AGI : The fall is comingHello friends
As the price has reached a strong resistance area, you can see that the price has been corrected and lower lows have been made. Now, given the token release that this currency has, there is a possibility of further decline, so we can buy at lower points with capital and risk management and move with it to the specified targets.
*Trade safely with us*