PENGU Just Triggered a Massive Breakout! Key Levels to WatchYello, Paradisers! Are you watching what’s unfolding with #PENGU after months of quiet accumulation? Because this chart is finally waking up, and it’s happening right now.
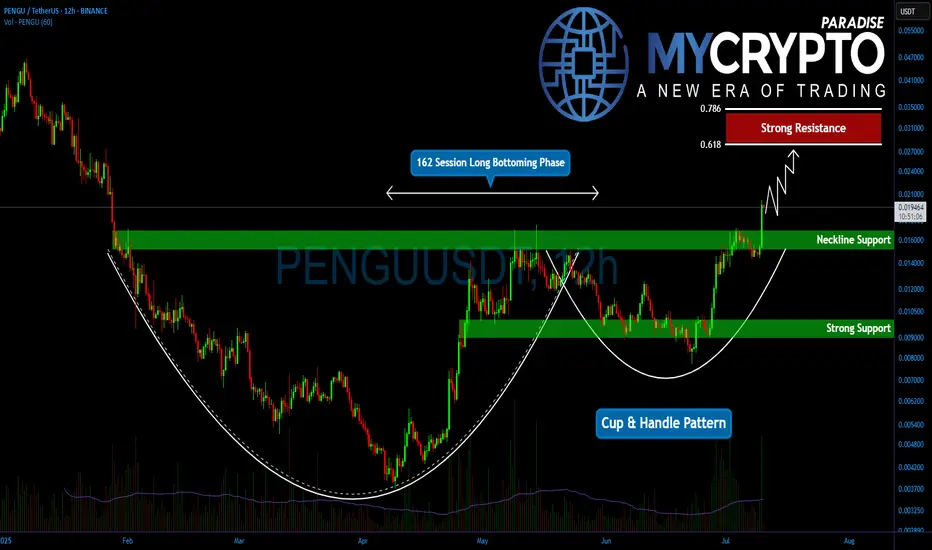
💎After a prolonged bottoming phase that lasted approximately 162 sessions, PENGU has completed a classic cup and handle formation, and we’re now seeing the start of what could be a powerful breakout.
💎#PENGUUSDT has surged above the neckline resistance at $0.01680, and—more importantly, this breakout is backed by strong volume, giving the move real credibility. It’s not just a wick; it’s a genuine push.
💎Now that the neckline is broken, PENGU has room to push higher. But let’s be clear, price is likely to face moderate resistance at the $0.02280 level. That’s a spot where some short-term profit-taking can’t be ruled out, especially from early entries. It’s a natural reaction zone and a moment to watch for how price behaves under pressure.
💎Still, if momentum holds, the pattern suggests a potential move toward the $0.02820 to $0.03200 region. That zone is no joke. It includes the 61.8% and 78.6% Fibonacci retracement levels, two of the most powerful technical resistance points in any market cycle. This makes that area a major decision zone and one that should be approached with caution.
💎On the other side, support is now established between $0.01680 and $0.01500. This is the previous resistance zone, and any retest into this range is likely to see strong demand stepping in. It would not be surprising to see buyers defend this area aggressively, especially if the retest is clean and orderly.
Strive for consistency, not quick profits. Treat the market as a businessman, not as a gambler. This is the only way you will make it far in your crypto trading journey. Be a PRO.
MyCryptoParadise
iFeel the success🌴
Cryptosignals
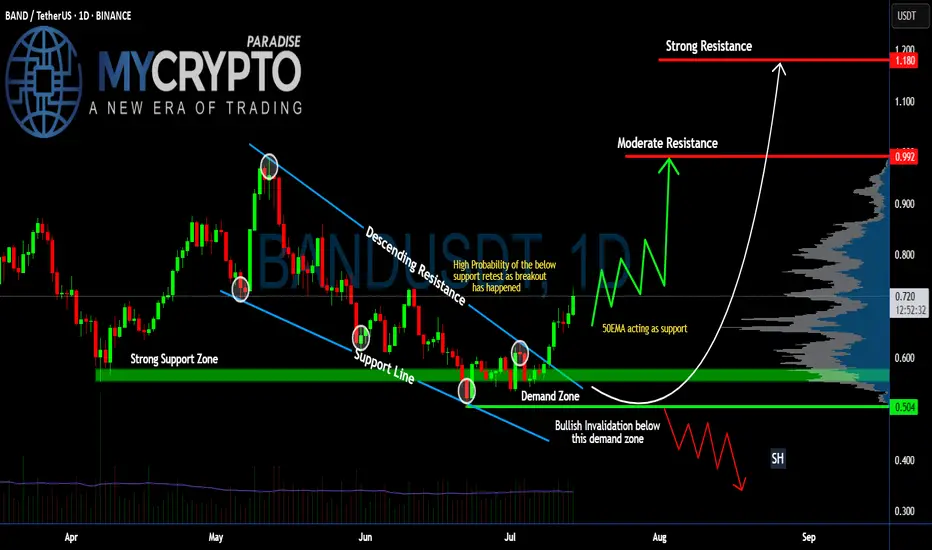
Can #BAND Bulls Maintain this Momentum or Will Bears Win? Yello, Paradisers! Is #BANDProtocol breakout from the falling wedge legit—or are bulls walking straight into a trap? Let's dig into the latest setup of #BANDUSDT:
💎After trading for weeks inside a falling wedge, #BAND has finally broken out with solid momentum. The breakout above the resistance trendline at around $0.66 has already occurred, and the price is currently hovering near the $0.72 zone. While this move is promising, it’s now all about whether this breakout can hold or fake out.
💎The structure here is clear: #BANDUSD reclaimed the demand zone between $0.60–$0.66 after bouncing off strong support at $0.504. This zone now becomes the most important area to watch in the short term. A retest of this level would offer a high-probability continuation setup, especially since the 50EMA is now acting as dynamic support beneath the price.
💎If bulls can maintain control, we have a clear path toward the moderate resistance at $0.992. That’s where the next wave of selling pressure is expected. But the real prize is the strong resistance zone near $1.180. That’s the level where major distribution could occur, and it's where we’ll be watching closely for profit-taking signs.
💎However, the bullish thesis breaks down completely if the price drops back below the $0.60–$0.66 demand zone. In that case, our invalidation point sits firmly at $0.504. A close below that support would indicate bears are back in control, and we’d shift to a defensive stance, targeting lower re-entry zones.
Stay patient, Paradisers. Let the breakout confirm, and only then do we strike with conviction.
MyCryptoParadise
iFeel the success🌴
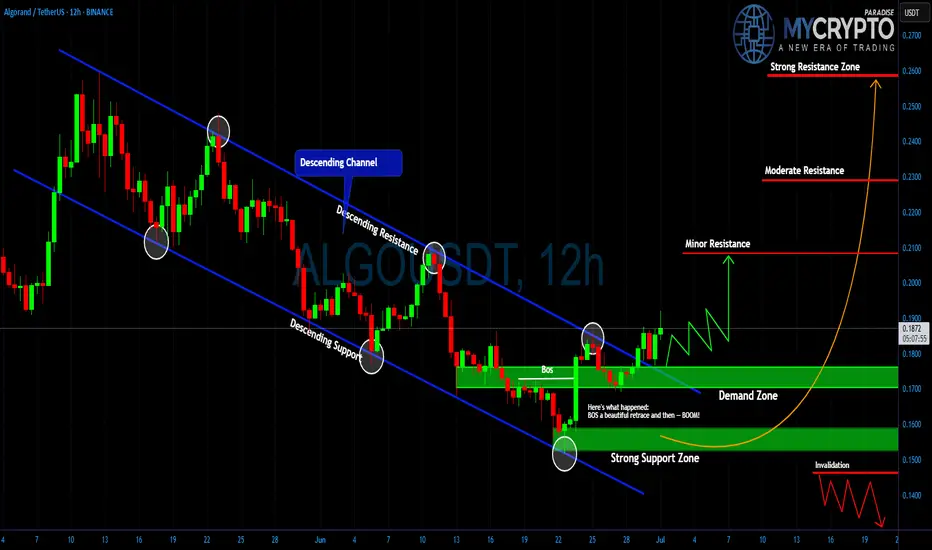
ALGO: Surprise Rally Ahead?Yello Paradisers, did you spot that breakout from the descending channel in time or are you still waiting for confirmation that already happened?
💎#ALGO/USDT has officially broken out of its multi-week descending channel after a textbook Break of Structure (BoS). Price action gave us a beautiful retrace into the demand zone, and from there boom momentum began shifting. This move is now showing early signs of bullish continuation, but as always, the majority will only realize it once the big move is already done.
💎#ALGO had been trading within a clearly defined descending channel, with price reacting precisely between the descending resistance and descending support lines. The breakout occurred after a strong candle pierced the descending resistance, and more importantly, we got a BoS followed by a clean retest of the demand zone around $0.165–$0.175. That reaction was sharp and decisive, indicating strong interest from buyers stepping in.
💎As of now, it is trading near $0.186 and forming higher lows, which supports the idea of an ongoing trend reversal. The structure has changed, and bulls are slowly regaining control. If price sustains above $0.190, the doors open for further upside. The first key level that could slow momentum is minor resistance near $0.210. If that level breaks with volume, moderate resistance around $0.230 becomes the next critical zone. Above that, the major target sits at $0.260, a strong resistance area where a lot of liquidity could be triggered.
💎On the flip side, the strong support zone between $0.145 and $0.155 remains our invalidation area. If price drops below this range, the bullish setup collapses, and we reassess the entire structure. But unless that happens, the bias remains cautiously bullish.
Trade Smart. Stay Patient. Be Consistent.
MyCryptoParadise
iFeel the success🌴
TRBUSDT: Massive Bullish Setup or a Fakeout Trap?Yello Paradisers — is TRBUSDT gearing up for a major breakout, or is this just another fakeout before a deeper drop? Our previous calls have been consistently accurate, and now this chart is flashing multiple signals that deserve your full attention.
💎Currently, TRBUSDT has formed a textbook falling wedge pattern, a well-known bullish reversal signal. What's adding strength to this setup is a clear bullish divergence, suggesting that momentum may be shifting in favor of the bulls. Even more compelling, the price is now holding firmly inside a bullish Order Block (OB) zone, which is aligned with the 200 EMA — a powerful confluence that increases the probability of a bullish move significantly.
💎For aggressive traders, this could be a valid spot to enter immediately, capitalizing on the current structure and zone. However, for those looking for a more calculated entry with improved risk-to-reward, waiting for a pullback could provide a much better setup — with the potential to offer over 4.5 RR, making it a high-probability trade idea.
💎That said, it’s important to manage risk carefully. If TRBUSDT breaks down and closes candle below the bullish OB zone, this would invalidate the bullish setup entirely. In that case, the smart move would be to wait patiently for new price action to form before making any decisions. Reacting emotionally here could lead to unnecessary losses, so discipline is key.
🎖Strive for consistency, not quick profits. Treat the market as a businessman, not as a gambler. If you want to be consistently profitable, you need to be extremely patient and always wait only for the best, highest probability trading opportunities.
MyCryptoParadise
iFeel the success🌴

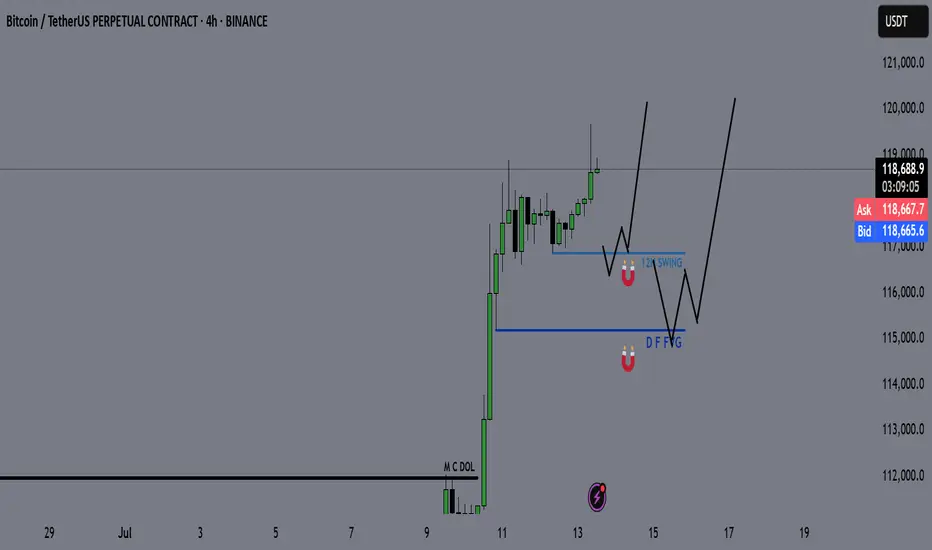
Bitcoin - BTC | Weekly Market Recap & Outlook 13.07.2025What Happened Last Week?
Bitcoin broke out of the recent downtrend structure and established a bullish leg with clear momentum.
The breakout was supported by volume and price structure, suggesting a trend reversal rather than a temporary deviation.
Weekly Bias and Strategy
The current outlook is bullish.
A retracement or sideways consolidation between the $120,000 and $114,000 zone is possible.
This zone may act as accumulation before further upside.
Key Points of Interest (POIs):
12H Swing Liquidity (turquoise line)
Daily FVG (blue line)
These levels will be monitored for long setups with confirmation on lower timeframes.
Macro Consideration – Fed Chairman Jerome Powell
Recent market speculation has increased regarding Jerome Powell potentially stepping down as Chair of the Federal Reserve.
If such a resignation is confirmed, it may act as a significant bullish catalyst for Bitcoin and other risk assets, possibly accelerating upside without allowing for any meaningful pullback.
Summary
• Bullish breakout confirmed
• Long bias maintained unless major invalidation occurs
• Watching retracement levels for entries
• Macro catalyst (Powell resignation) may trigger strong continuation without retrace
PENGU = ETF Catalyst + Whale Accumulation = +30% More Upside?Today, on the weekend, I want to analyze the Pudgy Penguins project with the PENGU ( BINANCE:PENGUUSDT ) token from a fundamental and technical perspective .
Please stay with me.
Why did PENGU surge nearly 40% in just 48 hours? Here’s what’s driving it:
------------------------------------------
Fundamental Analysis:
1. ETF Momentum via Cboe:
On June 26, Cboe officially filed a 19b-4 form for a new ETF that includes Pudgy Penguins and PENGU as major components.
Although not yet approved, this single move has fueled strong institutional anticipation, similar to what happened with Bitcoin ETFs in early 2023.
The market often prices in future narratives — and this ETF storyline has been a powerful one.
2.Whale Accumulation Signals
According to Nansen data, large holders have increased their balances by 11.37%, and notable wallets linked to public figures by 7% over the last 30 days.
Such coordinated accumulation often precedes major price moves, and that pattern seems to be repeating here.
3.NFT Ecosystem Boost
The Pudgy Penguins NFT collection saw a 400%+ surge in sales volume.
This sharp increase in NFT activity has reignited attention toward the broader Pudgy ecosystem, which naturally benefits its native token, PENGU.
Risk Note:
The ETF is not yet approved — we're still in the hype phase.
Volatility remains high, and strong pullbacks are common in low-liquidity tokens like PENGU.
If whale activity continues and institutional narratives grow, the upside potential remains — but so does the downside risk.
------------------------------------------
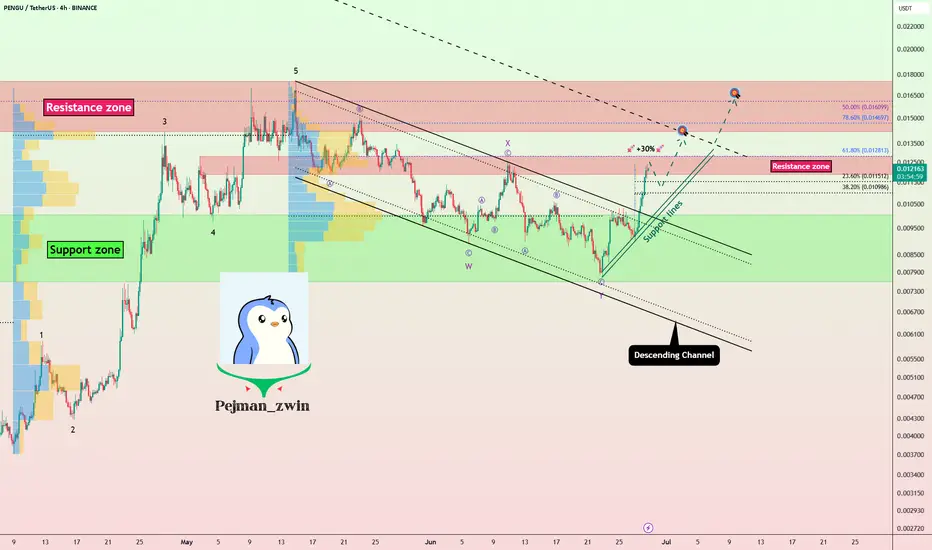
PENGU token started to rise from the Support zone($0.01-$0.0076) . One of the signs of a continuation of the uptrend was the break of the upper line of the descending channel .
Educational Note: One of the price targets after a channel break can be as wide as the width of the broken channel.
In terms of Elliott Wave theory , it seems that the PENGU token has completed the Double Three Correction(WXY) , and we can wait for the next impulsive waves .
I expect the PENGU token to attack the Resistance zone($0.0128-$0.0118) again, and if this zone is broken , it can increase to at least $0.0137(+30%) .
What is your idea about the Pudgy Penguins project?
Note: If the PENGU token drops below $0.01, we can expect a break of the Support zone($0.01-$0.0076).
Please respect each other's ideas and express them politely if you agree or disagree.
Pudgy Penguins Analyze (PENGUUSDT), 4-hour time frame.
Be sure to follow the updated ideas.
Do not forget to put a Stop loss for your positions (For every position you want to open).
Please follow your strategy and updates; this is just my Idea, and I will gladly see your ideas in this post.
Please do not forget the ✅' like '✅ button 🙏😊 & Share it with your friends; thanks, and Trade safe.
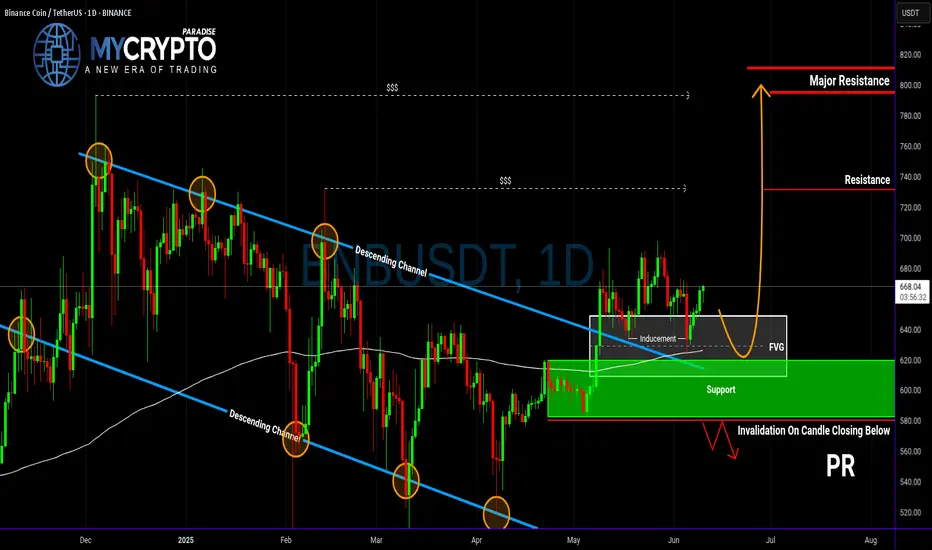
Is BNB About to Explode—or About to Collapse?Yello Paradisers! Could this be the beginning of the next BNB rally, or just another classic trap to liquidate early longs before the real move begins? Let’s dive into this high-probability setup before it’s too late.
💎BNBUSDT is currently showing good signs of bullish continuation. The price has successfully broken out of a descending channel and performed a precise retest of that structure—an early confirmation of strength. Following this, we’ve seen a strong reaction from a Fair Value Gap (FVG) and the 200 EMA, both of which align perfectly with the inducement taken just before the bounce. This confluence of technical signals significantly increases the probability of a sustained bullish move in the near term.
💎If price pulls back from current levels, it could offer us a more attractive risk-to-reward opportunity for long entries. Traders who are targeting higher RR ratios, such as 1:2 or beyond, may prefer to wait for a deeper pullback into our predefined support zone for a cleaner entry. This zone remains critical for maintaining our bullish bias.
💎However, if the price breaks down and we see a full candle close below that support zone, the entire bullish scenario becomes invalid. In such a case, it would be more prudent to stay on the sidelines and wait for a clearer and more favorable price action setup to emerge before jumping back in.
We are playing it safe right now. If you want to be consistently profitable, you need to be extremely patient and always wait only for the best, highest probability trading opportunities.
MyCryptoParadise
iFeel the success🌴
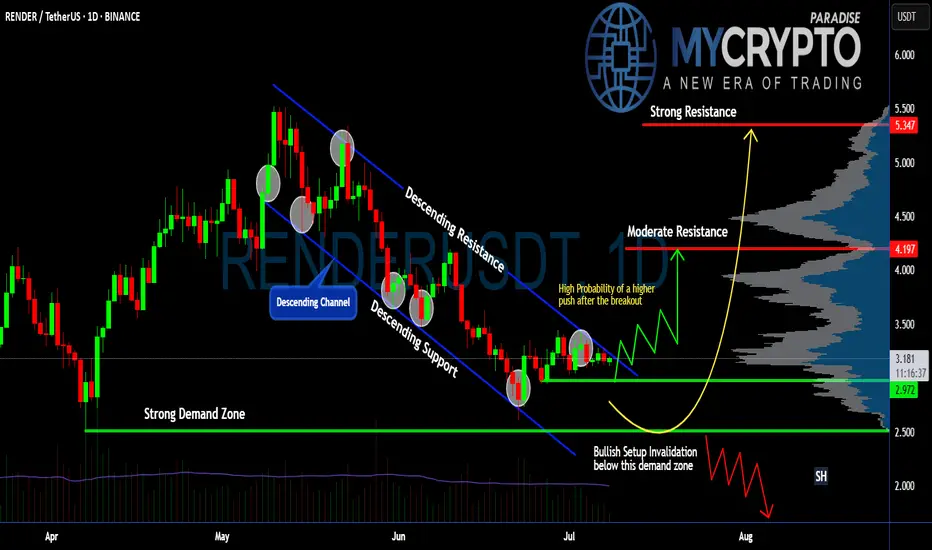
Is #RENDER Ready for a Reversal or Will it Continue to Fall?Yello, Paradisers! Is this just another range before a full reversal or a sneaky trap waiting to punish early buyers of #RENDER? Let's see the latest analysis of #RENDERUSDT:
💎After several weeks of slowly bleeding within a clean descending channel, #RENDERUSDT is now attempting a breakout from that structure. While the move isn’t confirmed just yet, this is the first real signal that sellers are losing momentum, and a shift could be on the table. Price is currently hovering just above the $3.15–$3.20 zone, and the next few candles will be key.
💎If buyers step up and push #RENDER through this upper trendline with strength, we have a clear runway toward the moderate resistance at $4.20. And if that gets taken out, the next strong resistance area comes in at $5.35, where we expect heavy distribution. But for now, it’s all about reclaiming and holding above this descending structure.
💎So what gives this setup real potential? The demand zone at $2.97 held like a fortress. If it fails, the next line of defense is a strong demand zone at $2.50. Buyers defended it multiple times and sparked a mini-reversal off the bottom of the channel. This demand zone is our launchpad, and as long as the price stays above it, bulls are still in control.
💎But make no mistake: if price loses $2.97, the bullish setup is invalidated. That would open up a deeper drop back toward $2.50 or lower, and we’ll step aside to wait for a better entry again.
Stay patient, Paradisers. Let the breakout confirm, and only then do we strike with conviction.
MyCryptoParadise
iFeel the success🌴
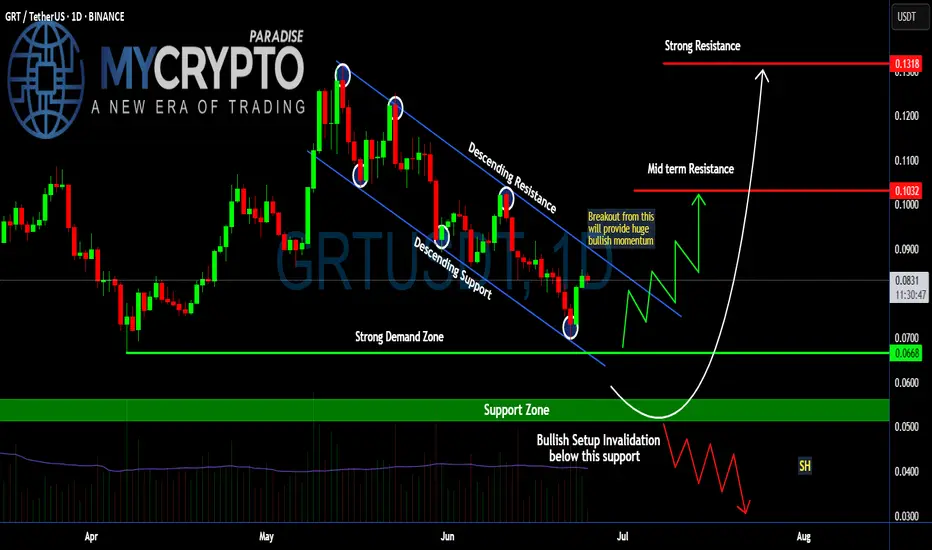
Is a Breakout Imminent for #GRT or Another Bull Trap is Ahead?Yello, Paradisers! Are we looking at a clean breakout setup that could send #GRT flying or is this the perfect trap to wipe out early bulls? Let's see the latest #GRTUSDT moves:
💎The daily chart on #GRTUSD is showing a perfectly formed descending channel, with price now hovering just above the lower boundary—a zone that has consistently held as strong descending support. After multiple rejections from the upper boundary and rebounds off the lower trendline, the price has now shown its first serious signs of momentum since bottoming in the strong demand zone
💎This structure has been in play since early May for #TheGraph, with each bounce from the support line giving temporary relief, only for the price to get slapped down at the descending resistance. But this most recent bounce looks different—it’s happening directly above a well-defined demand zone between $0.0668–$0.0700, a level that has historically attracted strong buyer interest.
💎A breakout above the descending resistance trendline, ideally with a strong daily close above $0.085–$0.090, would invalidate the bearish pressure and likely trigger a sharp leg up. The mid-term resistance sits around $0.1032, and clearing that would open the door to a retest of $0.1318, a level that previously acted as a strong rejection zone.
💎If the price fails to reclaim the descending channel and rolls over again, especially losing $0.0668 on a daily close, the bullish structure would be invalidated. That would shift focus toward the support zone at $0.053, and if that breaks, the next target becomes $0.0300—a brutal drop that would liquidate most late longs and signal deeper downside.
Stay disciplined. The next big opportunity will come to those who wait, not those who chase.
MyCryptoParadise
iFeel the success🌴
BTC/USDT : Breaks Out – New Highs In Sight After Smashing $111K!By analyzing the Bitcoin (BTC) chart on the weekly timeframe, we can see that the price has finally started to rally as expected—successfully hitting the $111,700 target and even printing a new high at $111,999 with an impressive pump.
This analysis remains valid, and we should expect new all-time highs soon.
The next bullish targets are $124,000 and $131,800.
THE WEEKLY TF ANALYSIS :

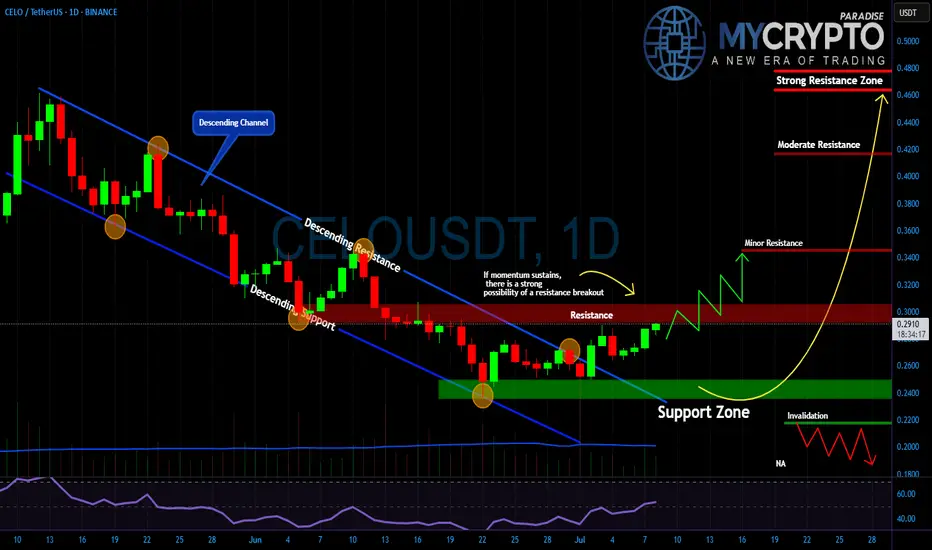
CELO About to Explode or Fakeout Incoming?Yello, Paradisers! Is this the breakout we’ve been patiently waiting for or just another trap to liquidate late buyers?
💎After weeks of grinding lower inside a clear descending channel, #CELO/USDT has finally broken out to the upside. That breakout alone isn’t enough, but it’s a critical first signal that sellers are losing control. Price is now pushing right into the key resistance zone at $0.29–$0.30, and what happens here will decide the next major move.
💎If momentum holds and price reclaims this level with conviction, we could see an explosive move toward $0.34 and potentially even the stronger resistance zones at $0.41 and $0.47 in the coming weeks. But if buyers fail to defend this push, and price rolls over, then the bullish setup quickly falls apart.
💎What gives us more confidence? The support zone at $0.24–$0.25 held beautifully buyers stepped in hard, and the market reversed cleanly from there. But if #CELO drops back below $0.22, the setup is invalidated and we'll wait patiently again for the next high-probability entry.
This is where most retail traders get trapped, they chase the move too late or panic-sell too early. Don’t be that trader. Stay focused. Be precise.
MyCryptoParadise
iFeel the success🌴
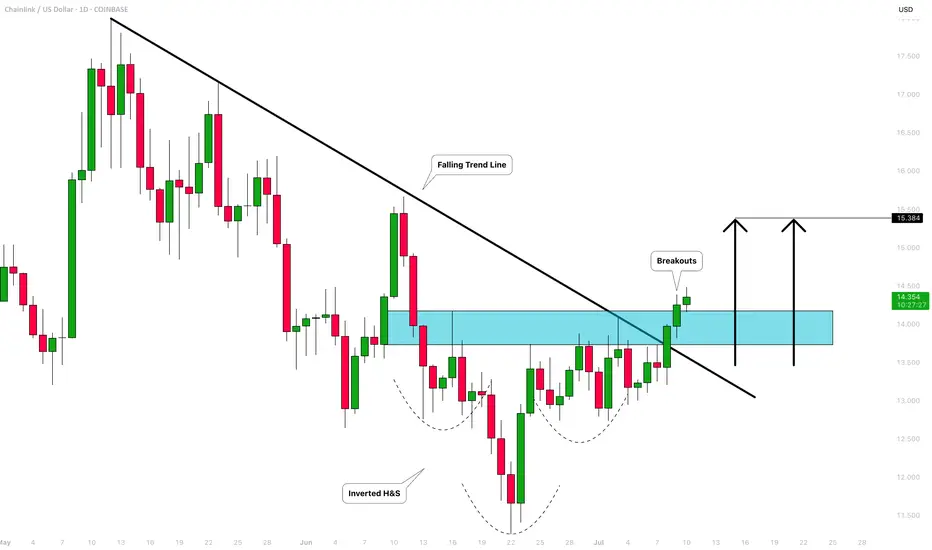
CHAINLINK (LINKUSD): Very Bullish Outlook
I see 2 strong bullish confirmations on LinkUSD on a daily time frame.
The price violated 2 significant structures: a vertical falling resistance - a trend line
and a neckline of an inverted head & shoulders pattern.
With a high probability, the market will rise more.
Next resistance - 15.38
❤️Please, support my work with like, thank you!❤️
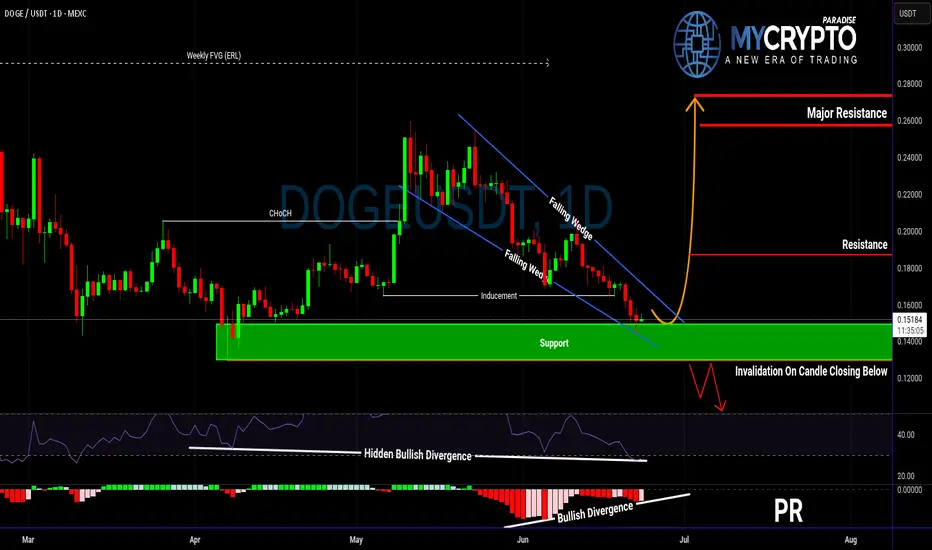
Is DOGE About to Explode or Collapse?Yello Paradisers! Are you ready for what could be DOGE’s most explosive move in weeks? DOGEUSDT is currently developing a very interesting bullish setup that deserves attention.
💎The pair has formed a falling wedge — a pattern that often precedes a breakout to the upside. This comes right after a confirmed bullish Change of Character (CHoCH), indicating that buyers are quietly stepping back in.
💎Even more important, we’ve seen a classic inducement grab, meaning early liquidity has been taken out, clearing the way for a potential real move. On top of that, there’s hidden bullish divergence on the RSI and clear bullish divergence on the MACD. This combination of signals significantly increases the probability of a bullish reversal from the current support zone.
💎If DOGE prints a convincing bullish candlestick pattern at these levels, it could offer a high-probability long opportunity with a strong risk-to-reward ratio. But be careful — if the price breaksdown and closes candle below this key support, the bullish scenario becomes invalid, and it’s better to wait for a more favorable structure to develop.
Strive for consistency, not quick profits. Treat the market as a businessman, not as a gambler. This is the only way you will make it far in your crypto trading journey. Be a PRO.
MyCryptoParadise
iFeel the success🌴
TIA Coin: Unlock 118% Profit Potential (1D)From the point where we placed the red arrow on the chart, it appears the TIA correction has begun.
Despite the current bullish market trend, TIA has not yet experienced a pump, and it seems the price hasn't reached its bottom yet. This correction seems to follow a large, time-consuming diamond-shaped diametric pattern, and we are currently in the early or middle stages of wave G.
Recently, the price lost a minor trendline, marked with a red dotted line, indicating that wave G might continue its path.
We have identified a low-risk buy zone on the chart for catching the next bullish wave in TIA. We are targeting buy/long positions in this zone.
Price targets are clearly indicated on the chart.
A daily candle close below the invalidation level will invalidate this analysis and suggest a potential reversal.
invalidation level: 1.089$
For risk management, please don't forget stop loss and capital management
When we reach the first target, save some profit and then change the stop to entry
Comment if you have any questions
Thank You

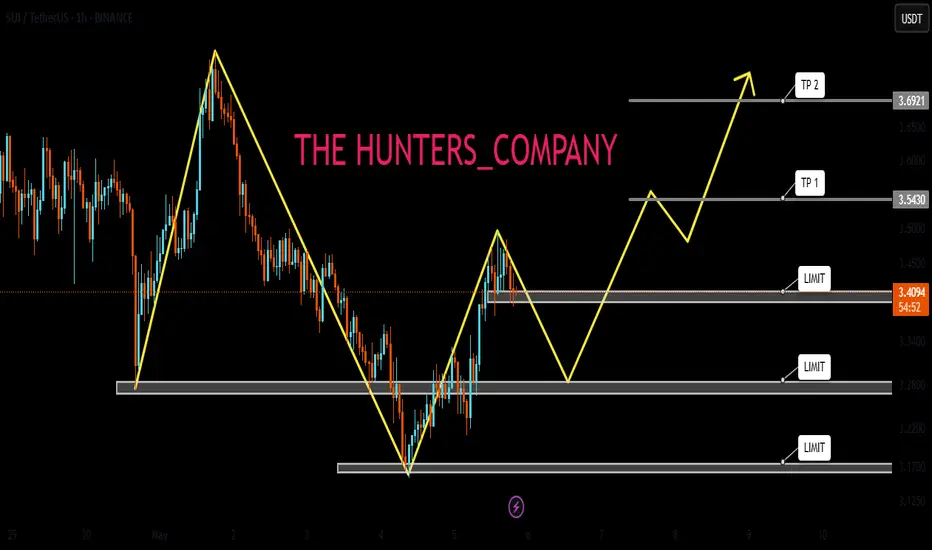
SUI SIGNAL...Hello friends
As you can see, buyers entered the price correction and a reversal pattern is being built...
Due to the buying pressure and the entry of buyers, we can buy within the specified ranges and move towards the set targets, of course with capital and risk management.
*Trade safely with us*
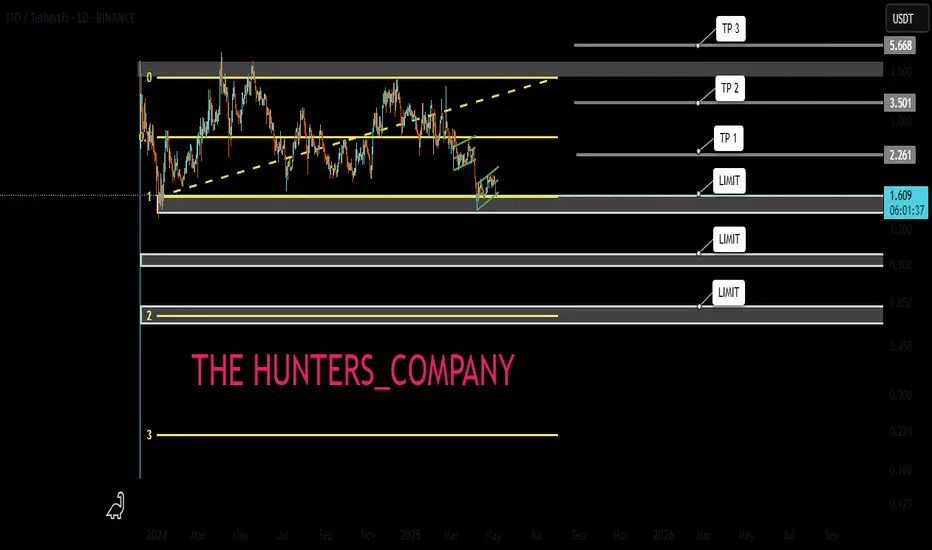
JTO : Price at a critical point: Falling or rising?Hello friends
Given the long-term range that this currency has made, the price has now reached the bottom of the range, which is very sensitive, and this currency also has a token release, which can be a warning.
In case of a drop, we have identified important supports for you, so that you can buy with risk and capital management.
*Trade safely with us*
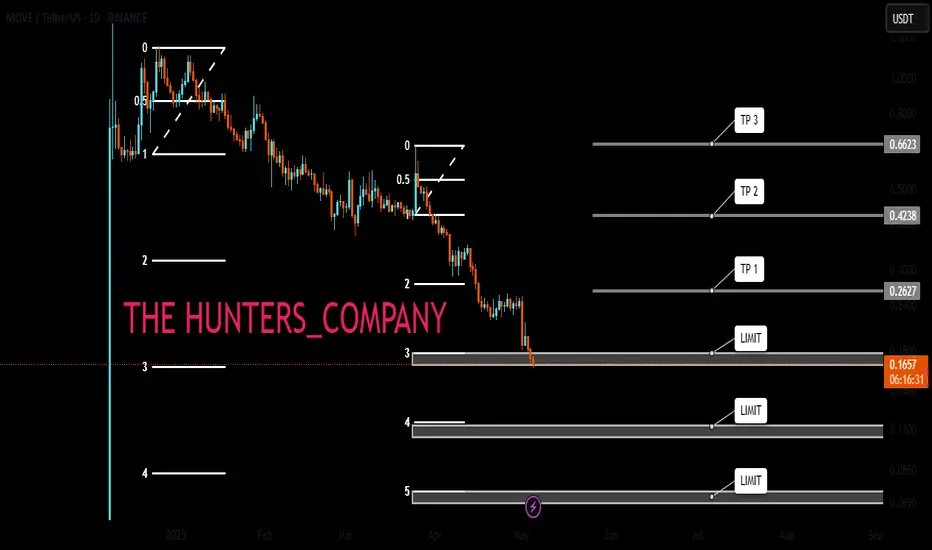
MOVE : Where to buy ?Hello friends
Given the upcoming token release, the price is expected to continue to fall, so be careful.
In case of a fall, we have identified important support levels for you, where you can buy with capital and risk management.
*Trade safely with us*
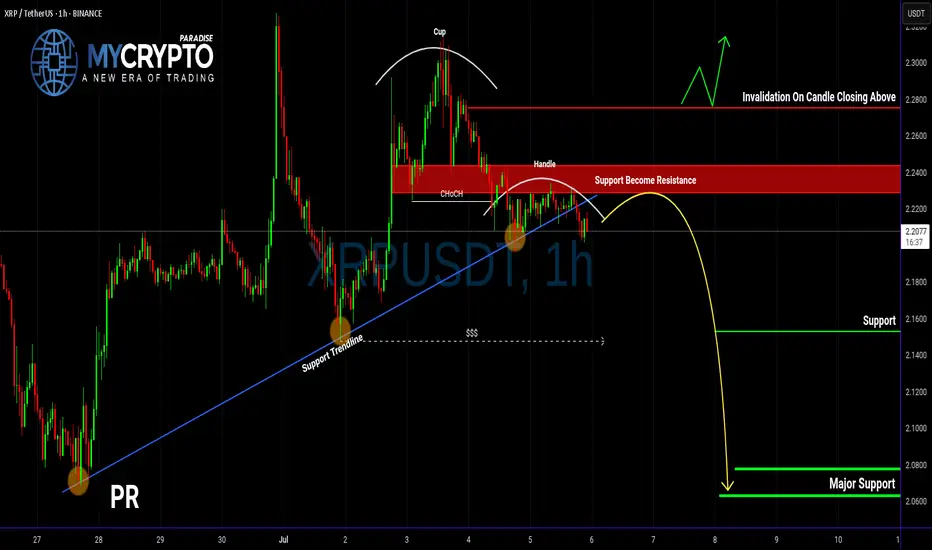
XRP Breakdown Ahead? Don’t Get Caught LongYello, Paradisers! Are you about to fall into a classic trap on XRP? The signs are stacking up, and if you're not careful, this move could catch a lot of traders on the wrong side of the market.
💎XRPUSDT is showing clear signs of weakness. A bearish CHoCH (Change of Character) has formed, and an inverse Cup & Handle pattern is currently playing out. On top of that, price action has decisively broken below the key support trendline. These signals together significantly increase the probability of a deeper bearish move in the coming days.
💎From the current price level, XRP is offering a 1:1 risk-to-reward setup. While this may attract more aggressive or short-term traders, the safer and more strategic approach is to wait for a proper pullback before entering. That would allow for a more favorable risk-to-reward and confirmation of the trend direction, reducing the likelihood of being caught in short-term noise.
💎It’s also crucial to watch the invalidation level. If XRP manages to break back above that zone and close a candle above it, this would invalidate the current bearish idea entirely. In such a case, it's better to stay patient and wait for clearer price action before making any decisions.
🎖Strive for consistency, not quick profits. Treat the market as a businessman, not as a gambler.
MyCryptoParadise
iFeel the success🌴
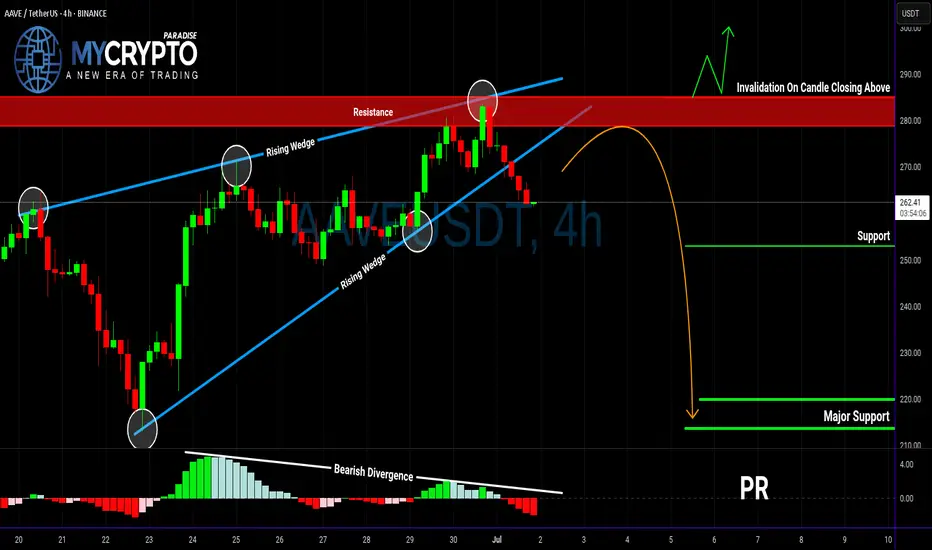
AAVE Breakdown Could Trigger Major DropYello Paradisers — did you spot the bearish setup forming on AAVEUSDT? If not, you might already be a step behind, but there’s still a high-risk-reward opportunity on the table — if you approach it with discipline.
💎Currently, AAVEUSDT is looking increasingly bearish. The asset has confirmed a bearish Change of Character (CHoCH), broken down from a rising wedge pattern, and is showing clear bearish divergence on the chart. These combined signals suggest that the probability of further downside is increasing.
💎From here, there are two main scenarios we’re monitoring. First, AAVE could attempt a pullback to fill the Fair Value Gap (FVG) above, which would offer a clean short-entry zone with strong risk-reward potential. Alternatively, price could reject directly from the nearby Bearish Order Block (OB), offering another chance for well-structured entries. Both setups depend on confirmation and timing, so patience is key.
💎However, if AAVE breaks and closes decisively above the current resistance zone, the bearish thesis becomes invalid. In that case, the best move is to wait on the sidelines and allow new, higher-quality price action to form before re-engaging.
💎This market demands patience and discipline. You don’t need to catch every move — just the right ones. Stay sharp, stay focused, and let the market come to you.
Strive for consistency, not quick profits. Treat the market as a businessman, not as a gambler.
MyCryptoParadise
iFeel the success🌴
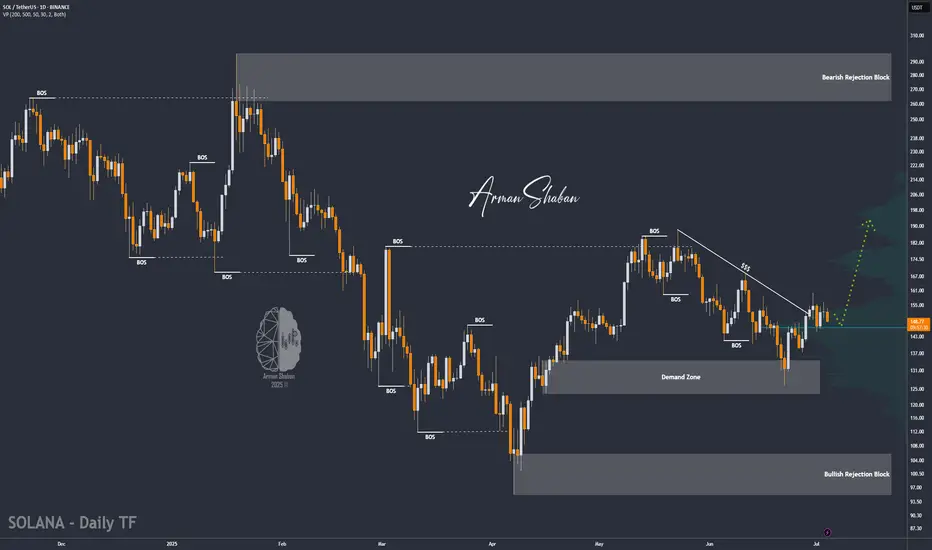
SOL/USDT : Strong Bullish Move Ahead?By analyzing the #Solana chart on the daily timeframe, we can see that the price is currently trading around $149.62. If the price holds above the key level of $146.28, we could expect the beginning of a strong bullish wave, potentially delivering over 25% short-term returns.
If this scenario plays out, the next bullish targets are $168.50, $187, $220, and $263.
(Personal research is strongly recommended for long-term investment decisions.)
Please support me with your likes and comments to motivate me to share more analysis with you and share your opinion about the possible trend of this chart with me !
Best Regards , Arman Shaban
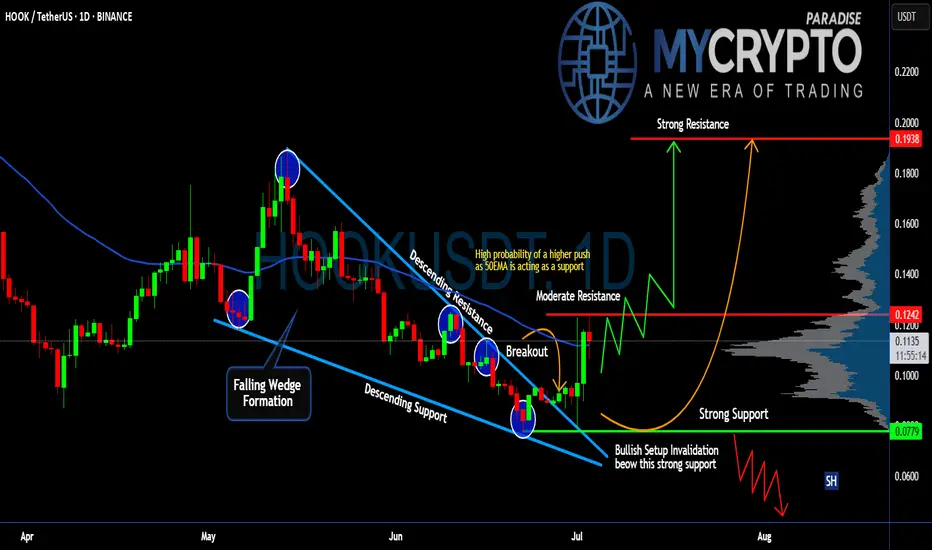
Will #HOOK Continue to Rise or a Trap is Being Set? Must Watch Yello Paradisers! Have you seen the recent price action of the #HookedProtocol or not? Let's see what's happening with #HOOK and its next move:
💎#HOOKUSDT has been moving in a clear falling wedge pattern, with price respecting both the descending resistance and support levels since late April. After multiple rejections from the lows, we finally saw a breakout from the wedge, which is a potential sign that bulls are preparing for a shift in structure.
💎Currently, #HOOKUSD is trading near 0.1120, and the 50EMA is now acting as support, which increases the probability of a continued move higher. The first area we are watching is 0.1242, which now acts as the moderate resistance. If the market manages to hold above this level, it opens up the path toward 0.1938, the next strong resistance, and a level where profit-taking becomes critical.
💎However, if bulls fail to hold the structure and price breaks back below 0.0779, then the entire bullish setup becomes invalid. In that case, we’ll likely revisit the 0.0600 region, and the trapdoor opens for late buyers who ignored the warning signs.
Stay sharp, Paradisers. The market is about to pick a side and we’ll be on the right one.
MyCryptoParadise
iFeel the success🌴
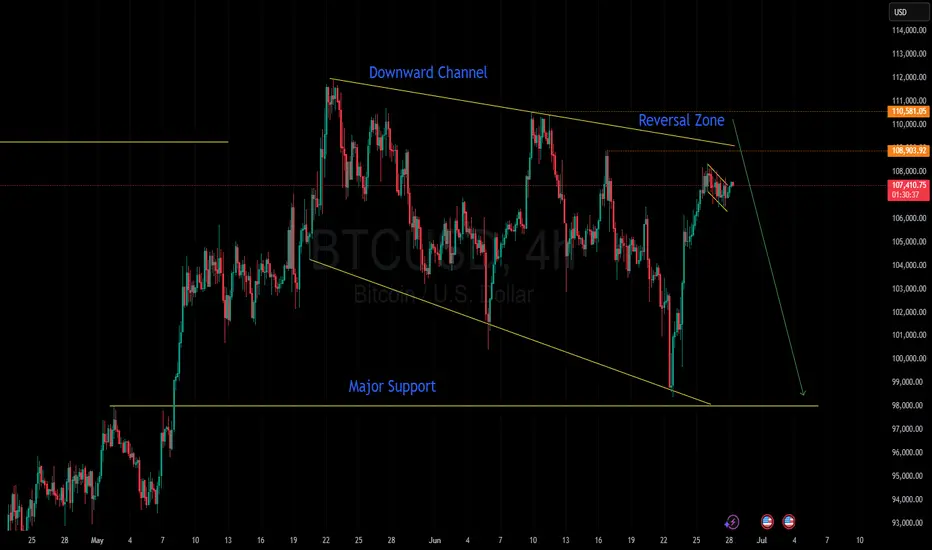
Bitcoin’s not done dropping. Selling pressure’s still on!Welcome aboard ✌️
In order for Bitcoin to climb higher, we first need a deeper correction.
Right now, price is stuck inside a channel — and it’ll take stronger momentum to break out.
🔻 So for now, I’m expecting further downside. Stick with me and don’t miss this bearish wave!
BINANCE:BTCUSD OANDA:BTCUSD
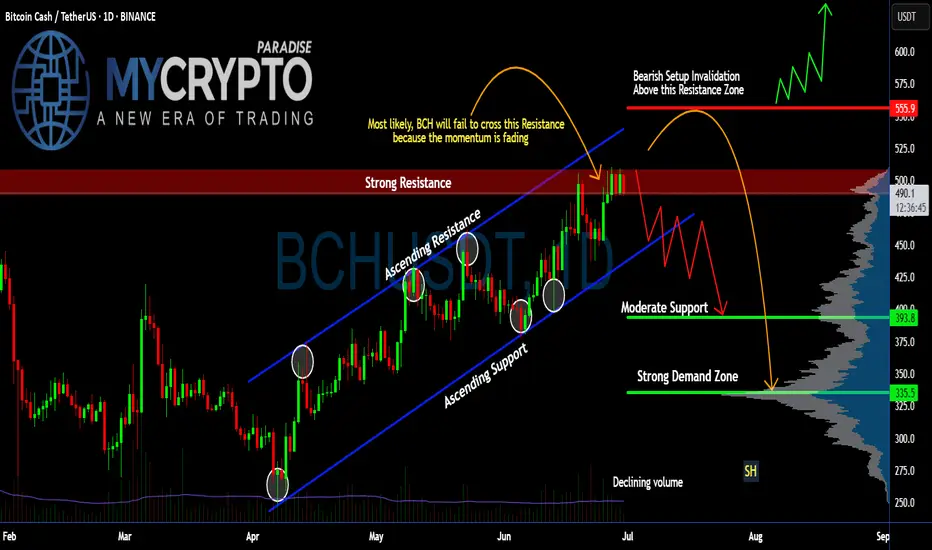
Is #BCH About to Fall or Will it Continue to Rise? Key LevelsYello Paradisers! Have you seen what’s cooking on #BCHUSDT lately? Let’s dive into the latest structure on #BitcoinCash and what may unfold next:
💎#BCH has been trading within a well-respected ascending channel since early April, consistently bouncing between dynamic ascending support and resistance levels. However, the current move into the $500–$505 resistance zone is showing clear signs of momentum exhaustion, as price stalls and volume fades.
💎The strong resistance area between $500 and $505 has rejected price multiple times, and this recent rejection aligns with both the channel resistance and a bearish momentum divergence in volume. Unless #BCHUSD can break and hold above this zone, bulls are fighting a losing battle.
💎The invalidation of the bearish setup lies above $555. Only a confirmed breakout and sustained hold above this level would negate the current bearish structure and open room for a larger bullish expansion. Until then, the risk of a deeper retracement is very real.
💎Currently trading around $490, #BCH looks vulnerable to a drop toward the moderate support zone near $393, with the strong demand zone between $335 and $340 being the high-probability area for a smart-money reaccumulation—if the market flushes weak hands first. This zone also lines up with previous high-volume nodes on the VRVP.
Trade smart, Paradisers. This setup will reward only the disciplined.
MyCryptoParadise
iFeel the success🌴