CYBER/USDT Bullish Rally on the Horizon? 🚀👀 Cyber Analysis💎Yello, Paradisers! shift your gaze to CYBERUSDT! We've observed some intriguing price movements. Notably, there's a clear rejection from the bearish OB, hinting at the asset's potential trajectory.
💎In our recent assessment, CYBER has managed to break free from a downward trendline, aiming for an upward momentum. At this juncture, we foresee two potential outcomes:
💎The CyberConnect may experience a minor pullback, seeking bullish momentum from the support level at $6.03 to retest the bearish OB.
💎If CYBER struggles to maintain its position above the $6.03 demand threshold, it might lean on the underlying demand zone for bullish support. However, a descent below this marker could signal a bearish trend.
💎Always be on your toes and tailor your strategies with these possibilities in mind!
Cryptotrader

MANA/USDT Had a Good Bull Rally | What's the Next Move? 💎Yello, Paradisers zoom in on MANAUSDT! It's currently tracing an ascending channel, suggesting a potential adjustment due to the looming supply zone.
💎Lately, Decentraland has maintained a steady climb within this upward channel. Yet, a shift or correction might be on the horizon. It's essential to highlight that MANA is navigating towards a crucial support mark at 0.3445.
💎Beyond this point, there's a distinct supply zone marked by an untouched OB. If MANA descends past the support, it's poised to gravitate towards the demand zone indicated on our chart.
💎Enhance your trading decisions for Decentraland with ParadiseFamilyVIP. Dive deeper into our expert insights on MANA and other promising coins, refining your crypto approach.

BTC Bitcoin updateWe don't yet have a SELL signal.
However, my custom tweaked indicators are showing we have a pivot point (buy PUTS from) and we have an overbought signal.
I would recommend not getting overly bullish here and or taking some profit's and banking them before you possibly lose them if you've had the right positions for this move UP.
Always best to secure some of these gains while waiting for better confirmation of next moves.
If your LT holder and don't plan on looking at it much over the next 6-18 months, then maybe less of an ordeal to ponder. But for those actually trading this, especially those trading with leverage, even if that means you're using something like OTC:GBTC or some other proxy stock with 1x leverage given by your broker. You should consider de-risking a bit here.
Just my $0.02
Preservation of capital should ALWAYS be on your mind.

STARL/USDT Ready for a Bullish Rally? STARL Analysis Today 💎Paradisers, gear up and take note of STARLUSDT's captivating movements, as it currently resides within a descending channel, signaling a potential ascent to challenge the higher resistance levels.
💎Recent analysis indicates its triumphant emergence from a descending channel, charting a path skyward. The primary anticipation is for the asset to target the supply zone at $0.00000550. If it breaks past this threshold, there's a strong inclination towards a surge to the resistance set at $0.00000794.
💎Conversely, should the asset falter in sustaining its momentum, a bullish revival as previously discussed remains probable. Yet, any descent below this point could redirect its course to a downward trend.
💎Refine your trading decisions for STARLINK with ParadiseFamilyVIP. Delve into expert insights on STARL and other potential coins, optimizing your crypto approach.

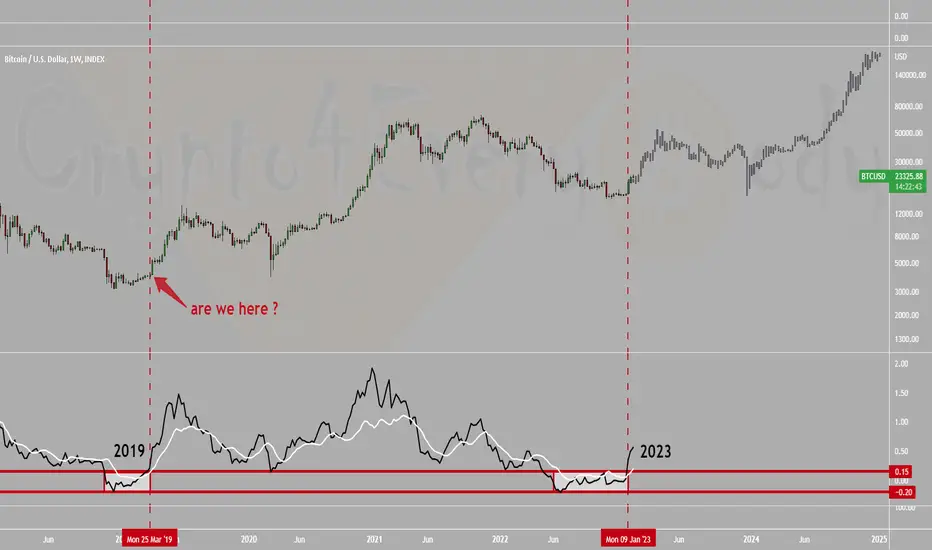
Bitcoin - Cycle Channel Oscillator left the white box⬜️Bitcoin
Last time the Cycle Channel Oscillator left the white box⬜️BTC went up +1,500%🚨🚨🚨
We left the box again dear Crypto Nation👀
Doesn't it look similar to you so far❓
Let me know your thoughts in the comments🤗
⬇️⬇️⬇️
Likes and Follow for updates appreciated🤗
Disclaimer:
Not financial advice
Do your own research before investing
The content shared is for educational purposes only and is my personal opinion
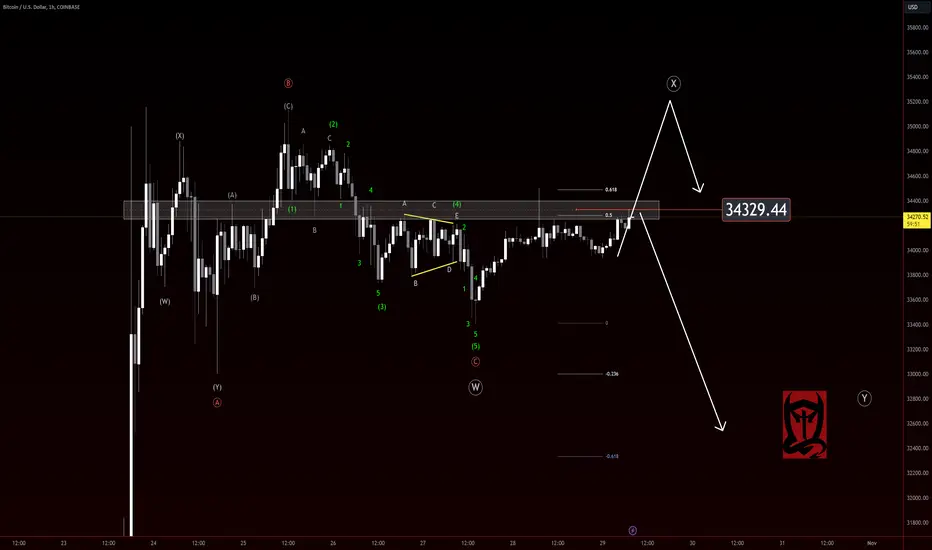
Bitcoin Impulse downIf you find this information inspiring/helpful, please consider a boost and follow! Any questions or comments, please leave a comment! Also, check out the links in my signature to get to know me better!
I am seeing an impulse down. Is it a completed corrective structure, or a signal for some more retracement?
MINA/USDT Ready for an Explosive Journey? MINA Analysis Today 💎Yello, Paradisers! focus on MINAUSDT! Its trajectory within the descending channel is nothing short of intriguing in the 1H timeframe. With evident buying momentum, it's poised for a potential upward swing.
💎In the last couple of days, Mina has been navigating this descending channel. After a recent touchpoint with the channel's lower boundary, it's reigniting its bullish momentum. There is a high probability that it will climb toward the projected resistance and supply zone.
💎Yet, caution is key. If MINA slips below the demand zone, it's highly probable it will retreat to the support for another evaluation.
💎Hone your trading decisions for MINA with ParadiseFamilyVIP. Delve into our expert analyses on MINA and other potential tokens, refining your crypto approach.

MBOX/USDT Likely to Go a Bull Ride? MBOX Analysis 💎 Yello, Paradisers! shift your focus to MBOXUSDT. It's currently charting a path within a trading channel, suggesting a potential bullish swing.
💎 For quite some time, MBOX has been maneuvering within this descending channel. The current dynamics hint at a possible ascent towards the Bearish OB and the overhead supply zone.
💎 As it stands in the demand zone, a breach past the .2655 threshold could bolster the bullish trend. While beginners might contemplate shorting around this level, it's wise to adopt a panoramic view.
💎 Conversely, if MBOX dips below the .2400 demand mark, it might be gearing up to touch a sturdier support zone. As always, keep a keen eye and plan your moves with foresight.
💎 Refine your trading insights for MOBOX with ParadiseFamilyVIP. Dive deeper into our expert perspectives on MBOX and other promising tokens, enhancing your crypto strategy.

🚀 #LRC/USDT Ready to Soar! Join the Rally Now! 📈🔥Attention all traders! 🚨 It's time to jump on the #LRC/USDT rocket ship! Loopring is showing impressive potential, and we're in for an exhilarating ride. Don't miss out on this opportunity to join the rally! 📊🚀
Chart Analysis:
Pair: LRC/USDT
Timeframe: Daily
Key Observations:
Bullish Momentum: Loopring (LRC) has been demonstrating significant bullish momentum lately. The price is on the rise, indicating strong market interest. 📈💥
Support Zone: There's a solid support zone in place, suggesting a robust foundation for potential upward movement. 🧱🚀
Technical Breakout: A recent technical breakout is a positive sign, indicating a potential surge. 🚀📊
Trading Plan:
Entry: Consider entering a long position now while the price is on the rise. Look for confirmation of the bullish trend. 📈🔥
Stop Loss: Implement a well-placed stop loss to manage risk effectively. Protect your capital. 🛡️💰
Take Profit Targets: Set profit targets based on your trading strategy and risk tolerance. Be prepared for both short-term and long-term scenarios.
#Loopring #CryptoRally #BullishTrend #LRCAnalysis #Cryptocurrency #TradeSmart #CryptoTrader
Disclaimer: This is not financial advice. Make sure to do your research and consider consulting with a financial advisor before making any trading decisions. Always use proper risk management strategies.
Get ready for an exciting journey with Loopring! Join the conversation in the comments and share this post with your trading buddies. Let's make this analysis go viral! 🚀🔥💹
Note: TradingView posts are for educational and informational purposes only. Remember to conduct your research and employ proper risk management when trading cryptocurrencies. 📚📊

CELR/USDT Likely to Go for a Bullish Momentum | CELR Analysis💎Yello, Paradisers! shift your focus to CELRUSDT. It's currently charting its course within a descending channel and suggesting a potential bullish breakout.
💎For an extended period, CELR has been confined within this descending channel. The current dynamics suggest a potential move towards the Bearish OB and the overhead supply zone.
💎As it hovers in the demand zone, a breach past the .01304 threshold will amplify the chances of bullish momentum. While some novices might consider shorting at this point, it's wise to adopt a more holistic view.
💎Conversely, if the price dips beneath the .01250 demand point, there's an increased likelihood of revisiting a stronger support level. As always, it's essential to stay alert and plan your moves strategically.
💎Enhance your trading insights for CelerNetwork with ParadiseFamilyVIP. Dive deeper into our expert perspectives on CELR and other promising coins and optimize your crypto strategy

APE/USDT Had an Explosive Bullish Run | What's Next?💎Yello, Paradisers! shift your focus to APEUSDT! It's currently positioned within a strategic trading zone, hinting at a potential adjustment due to the looming supply zone above.
💎In the past few days, APE has been charting its path within this trading channel. Indicators suggest a high probability of an impending correction. Importantly, APE has consistently maintained a significant resistance level at $1.306, facing rejections on two distinct instances.
💎Yet, there's an additional supply zone ahead with an untouched OB. If APE sustains its current bullish drive, it could approach the above supply zone and then go for a correction.
💎Hone your trading strategies for Apecoin with ParadiseFamilyVIP. Delve deeper into our expert perspectives on APE and other potential coins, enhancing your crypto journey.

INJ/USDT Ready for Bullish Momentum? INJ Analysis🚀 💎Yello Paradisers! Let’s dive deep into INJ! It’s evident that it’s maneuvering above a trading channel and is about to explode.
💎 A meticulous examination reveals a transition from demand to supply in INJUSDT, leading to a significant decline in price, touching the channel support.
💎 Rebounding from this support, the asset is rekindling its bullish momentum, targeting the surpassing of the supply zone. Fascinatingly, a breach of channel resistance could catapult us to the Extreme OB level.
💎 It’s also imperative to acknowledge that a breach below the 6.40 level could likely prompt a retest of the bullish OB level.
💎 Employ wise trading tactics and implement stringent stop-loss protocols
💎 Keep your senses tuned to market fluctuations and stay poised for more insights!

SAND/USDT Ready for an Epic Bullish Journey | SAND Analysis💎Paradisers, focus your attention on SANDUSDT as it presents an intriguing trajectory. Positioned within a demand zone, it has seemingly established buying liquidity and is primed for a potential bullish surge.
💎SAND has been navigating a descending channel formation for an extended period. Recently touching the channel's support, it's now reigniting its upward momentum, fueling confidence in its ability to move towards our projected resistance level.
💎Nonetheless, it's imperative to stay watchful. If the price breaches the demand zone, there's a strong possibility it will revert back to the support level for a retest.
💎Refine your mastery of entry and exit points for Sandbox with ParadiseFamilyVIP. Delve into expert insights on SAND and other promising coins, enhancing your trading strategy.

STG/USDT Ready for an Explosive Journey | STG Analysis💎Yello, Paradisers, shift your gaze to STGUSDT. This coin is currently undergoing a significant transition after successfully breaching a descending channel and hinting at a potential bullish phase.
💎There is a higher probability that it will continue its bullish stance because it has emerged from the descending channel, setting its sights higher on the above supply zone pegged at 0.45. At this level, novices might consider shorting.
💎Yet, for those who stay updated and proactive, if STG can overcome this supply barrier, the chances of it aiming for the bearish OB increase considerably.
💎Conversely, given the ever-changing nature of the market, if SargateFinance faces resistance around the 0.4186 supply point, it will likely revisit the support below.
💎As always, prudence and strategic insight are paramount. Refine your trading decisions for STG with ParadiseFamilyVIP. Dive deep into our expert analyses on STG and other potential tokens to streamline your trading approach.

AVAX/USDT Ready for Bull Momentum? 🚀AVAX Analysis Today💎Paradisers, set your sights on AVAXUSDT! Its current trajectory is both intriguing and promising, as it stands strong at a pivotal support point, hinting at a potential upward swing.
💎In recent days, Avalanche has been charting its course within a descending triangle. Breaking past the triangle's support, it's now on an upward trajectory.
💎The first resistance hurdle is set at the $9.36 benchmark, followed by a sterner test at $10. Given its stance in the demand zone, we're optimistic about its chances to tackle these resistance points.
💎Yet, it's essential to stay alert: if AVAX dips below its current support, a bearish downturn towards the marked support could be on the horizon.
💎Sharpen your trading decisions for AVAX with ParadiseFamilyVIP. Delve into our expert analyses on AVAX and other potential tokens, refining your crypto game plan.

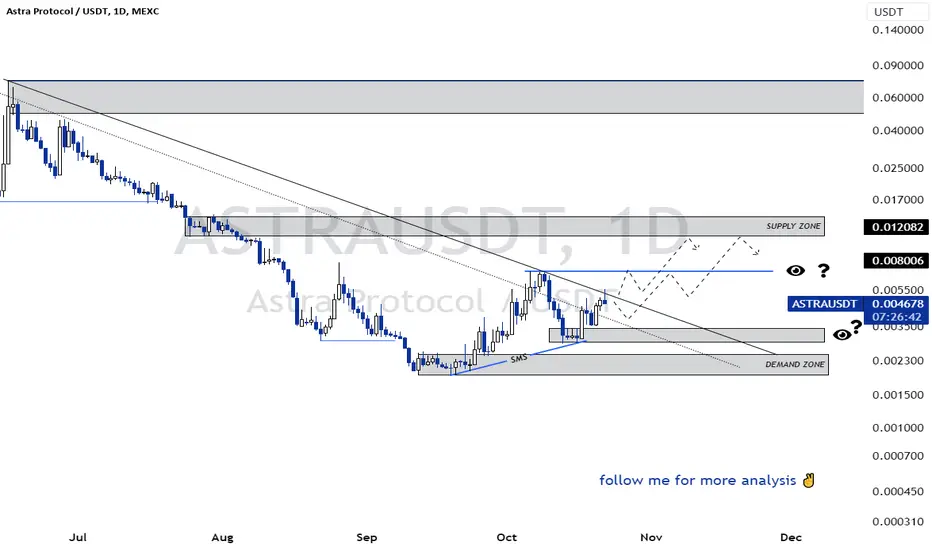
SasanSeifi 💁♂ASTRA/ USDT DAILY 0.00800🤔Hey there! Upon examining the daily chart, as you can see, the price encountered a negative reaction as it approached the downtrend line in the 0.0052 range and is currently trading in the price range of 0.0046. The expectation we can have is that after a minor correction and maintaining the crucial support ranges of 0.0041 and 0.0034, along with a reconfirmation, we might see positive fluctuations. In the case of positive fluctuations and a break of the downtrend line, the initial target would be the liquidity zone of 0.0070. To better understand the continuation of the trend, we need to observe how the price reacts when it approaches the important resistance zone. After a possible pullback, further growth might follow. The potential scenarios in the above image have also been indicated. Maintaining the support ranges is crucial for the desired scenario. Additionally, if the price falls below the support ranges, there is a higher likelihood of further correction.
✨What's your opinion? Do you agree?
🔵Remember, always conduct your own analysis and consider other factors before
making any trading decisions. Good luck!"✌️
❎ (DYOR)...⚠️⚜️
Sure, if you have any more questions or need further clarification, feel free to ask. I'm here to help!
if you found my analysis helpful, I would appreciate it if you could show your support by liking and commenting. Thank you!🙌✌
AAVE/USDT has an Exciting Bull Run | What's Next for AAVE? 💎Yello Paradisers! shift your gaze to AAVEUSDT! It's currently positioned within a strategic trading zone, hinting at a potential adjustment due to the looming supply zone above.
💎In recent times, Aave has been charting its course within this trading channel. There is a high probability that it's going for a correction. Importantly, it has consistently maintained a key resistance level at $88.05, facing rejections on two distinct occasions.
💎Yet, there's an additional supply zone ahead with an untouched OB. Should AAVE sustain its current momentum, it could very well approach this supply zone and then go for a correction.
💎Sharpen your trading strategies for Aave with ParadiseFamilyVIP. Delve deeper into our expert perspectives on AAVE and other potential coins, enhancing your crypto journey.

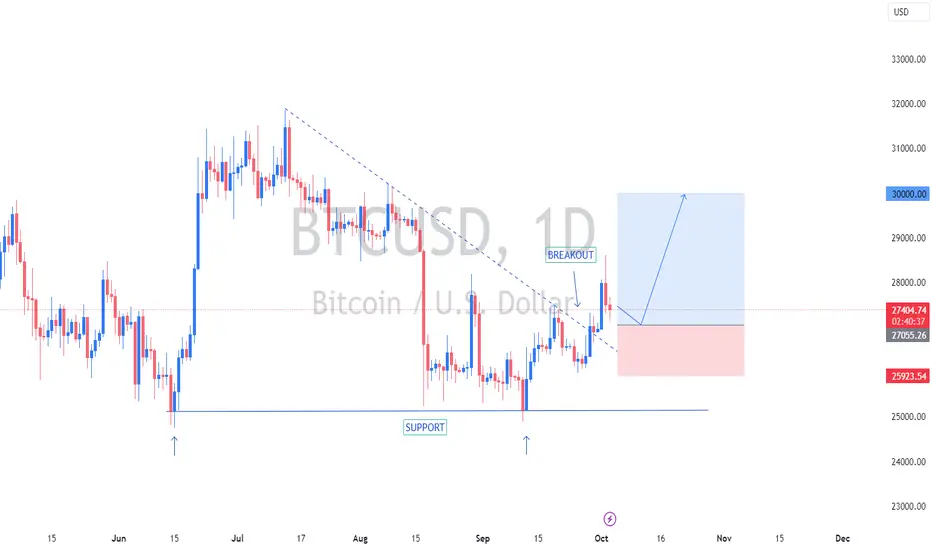
BTC (D1) : SETUP BUY - Otc.04Hello Traders,
🔹BTC has a good entry at zone 26,500-27,000
🔹Target is 30k and RR : 1:2.6
Manage your capital correctly and carefull,
Goodluck to you !
BLZ/USDT Ready for Explosive Bull Rally?🚀 Bluezelle Analysis 💎Yello Paradisers, set your sights on BLZUSDT! It's currently holding strong at a pivotal support, hinting at a potential upward swing.
💎From our observations, BLZ has been tracing a descending channel in 4HR. Presently, it's maneuvering within this channel, with the upper boundary acting as resistance. Based on our projections, there's a significant chance that BLZ will aim for the supply zone in the near future.
💎However, if Bluzelle can't maintain its position above the support and breaks through, anticipate a marked descent. In case of support breaches, we have highlighted the next potential support.
💎Refine your trading strategies for BLZ with ParadiseFamilyVIP. Dive into our expert analyses on BLZ and other potential tokens, streamlining your crypto journey.

LQTY/USDT on the Move, Get Ready! Liquity Analysis 💎Paradisers, stay alert! LQTY/USDT is gearing up to break free from a triangular channel and is currently navigating a demand zone. We're bullish about its chances for an upward surge.
💎Lately, the asset has been moving within a specific range. It previously hit a resistance at a bearish order block around the $0.925 level. Given its renewed upward momentum, it looks set to challenge this resistance once more.
💎Keep an eye on the overhead supply zone and the bearish order block confirmed on longer timeframes; these could be the next targets for LQTY.
💎If the Liquity falls below the demand zone and key support, be prepared for a potential downward move.
💎Keep your charts refreshed and stay tuned for more updates!

MATIC is Ready For an Explosive Bullish Move 🚀| MATIC Analysis💎 Paradisers, stay alert! MATIC/USDT is currently traversing a demand zone, and we are holding a positive outlook for a potential upward journey.
💎 In the past few days, its movement has been restricted to a specific range. It previously faced resistance at the bearish order block, close to the $0.52 level.
💎 Given its ongoing upward momentum, MATIC appears ready to challenge this level once more.
💎 Keep a close eye on the supply zone and the bearish order block discerned on longer time frames; these are probable targets in the short term for Polygon.
💎 However, if the MATIC falls below the demand zone and vital support, be ready for a potential downward shift.
💎 Stay vigilant and keep an ear out for more insights! 🌴

BCH/USDT Likely Ready For Bullish Rally?🚀BCH Analysis💎Paradisers, focus on BCHUSDT! Its current trajectory within the demand zone is nothing short of compelling. With evident buying momentum, it's poised for a potential bullish surge.
💎Historically, BitcoinCash has navigated within a descending channel. After its recent encounter with the channel's lower boundary, it's reigniting its bullish momentum. We're optimistic about its chances to rise towards the projected resistance.
💎Yet, caution remains essential. If BCH slips below the demand zone, it's highly probable it will retreat to the support for further assessment.
💎Enhance your trading decisions for BCH with ParadiseFamilyVIP. Delve into our expert analyses on BCH and other potential tokens, refining your crypto approach.

BAND/USDT Ready for a Potential Correction? BAND Analysis💎Paradisers, set your sights on BNADUSDT! It's currently positioned within a strategic trading zone, hinting at a potential adjustment due to the looming supply zone.
💎In recent times, BandProtocol has been maneuvering through a defined trading channel. There is a high probability that it might be gearing up for a potential correction.
💎Importantly, it has consistently encountered significant resistance at 1.541, facing pushbacks from this level on multiple instances.
💎Yet, there's an additional supply zone marked by an untouched OB. If BAND maintains its bullish trajectory, it's plausible it might approach this supply zone.
💎Hone your trading decisions for BAND with ParadiseFamilyVIP. Delve deeper into our expert analyses on BAND and other potential tokens, refining your crypto approach.
