BTCUSD – Bullish Recovery Setup Forming Near Trendline Support🧠 Market Structure & Technical Breakdown
The BTCUSD 4H chart showcases a well-formed descending triangle or falling wedge structure with clearly respected major and minor descending trendlines. Currently, price action is testing a dynamic support zone, highlighted in green, which has been a strong reaction area in the past.
This area aligns with a bullish accumulation zone, from which buyers have previously stepped in to initiate impulsive moves. Given the confluence of diagonal support and horizontal price reactions, we may be on the verge of a bullish breakout opportunity.
📍 Key Zones & Trendlines
✅ Green Support Channel (Demand Zone): Acting as a key pivot for multiple recent rejections, this area (~114,000–113,000) is now being revisited again, offering potential buy interest.
📉 Minor Trendline: A short-term descending resistance around 120,000—likely the first barrier in case of a bounce.
📉 Major Trendline: A more extended dynamic resistance line connecting swing highs, currently intersecting near the 124,000 region.
🔄 Potential Price Scenarios
Primary Bullish Setup (MMC Plan):
Price bounces off the green demand zone.
Breaks above the minor trendline (~120K).
Pullback retest to confirm breakout.
Continuation toward the major breakout level (~124K and beyond).
Invalidation / Bearish Case:
A clean breakdown below 113,000 with strong bearish momentum would negate this setup, likely targeting the psychological support near 110,000.
🧠 MMC Mindset: Trade with Patience & Confluence
This is a classic accumulation-to-breakout scenario. Smart traders wait for confirmation—especially as BTC often exhibits false breakdowns before a major move. Monitor candle behavior, volume, and reaction to the minor trendline.
Let the market show signs of strength (like bullish engulfing, pin bars, or a breakout-retest) before committing to the upside. Avoid FOMO; the key is discipline and precision entry at structural break points.
✅ Trade Plan Summary:
Watch zone: 113,000–114,500 for bullish price action
Breakout level: Minor trendline (~120,000)
Target zone: 123,500–124,000 (Major resistance)
Stop-loss idea: Below 112,800 (Invalidation of structure)
Cryptotrading

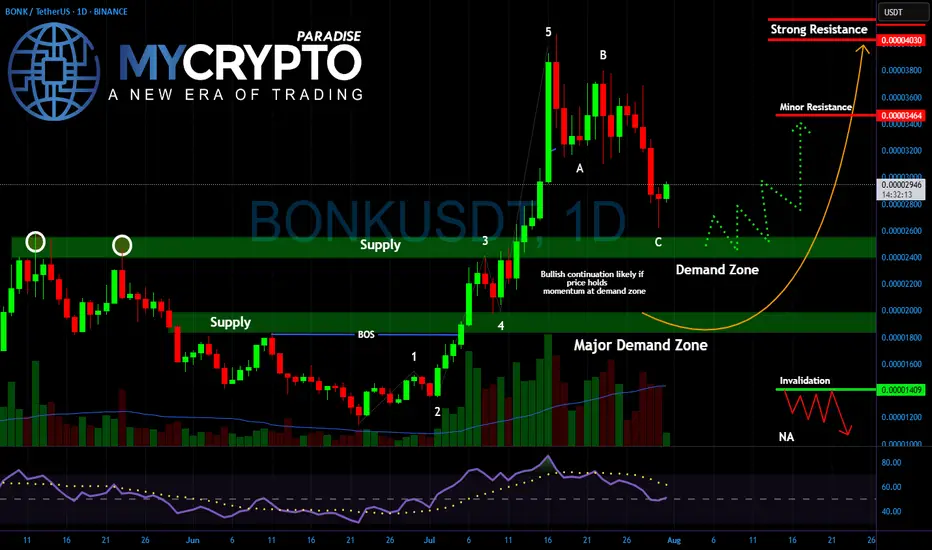
BONK About to Break Out or Break Down?Yello Paradisers! Are you ready for the next explosive move in #BONK? After nailing the last rally and spotting the impulsive 5-wave structure early, we’re now entering a critical phase — and what happens next could decide whether BONK flies or collapses.
💎The recent pullback has followed a clean A-B-C corrective structure, landing perfectly into the key demand zone between 0.00002600 and 0.00002200. This zone now acts as the battlefield between smart money buyers and weak-handed sellers. Price action is slowing down, volume is drying up, and RSI is resetting all classic signs of a potential bullish continuation. But if buyers fail to step in with conviction, the market could easily sweep lower to test the major demand zone closer to 0.00001800.
💎As long as price holds this area and confirms a reversal with follow-through momentum, we could see #BONK heading back toward 0.00003460 as the first stop, and possibly a retest of the 0.00004030 resistance. However, if price closes below 0.00001409, that would invalidate the bullish setup and confirm a deeper corrective phase.
Patience and strategy win the game, Paradisers! The market is designed to shake out weak hands before the real move happens.
MyCryptoParadise
iFeel the success🌴
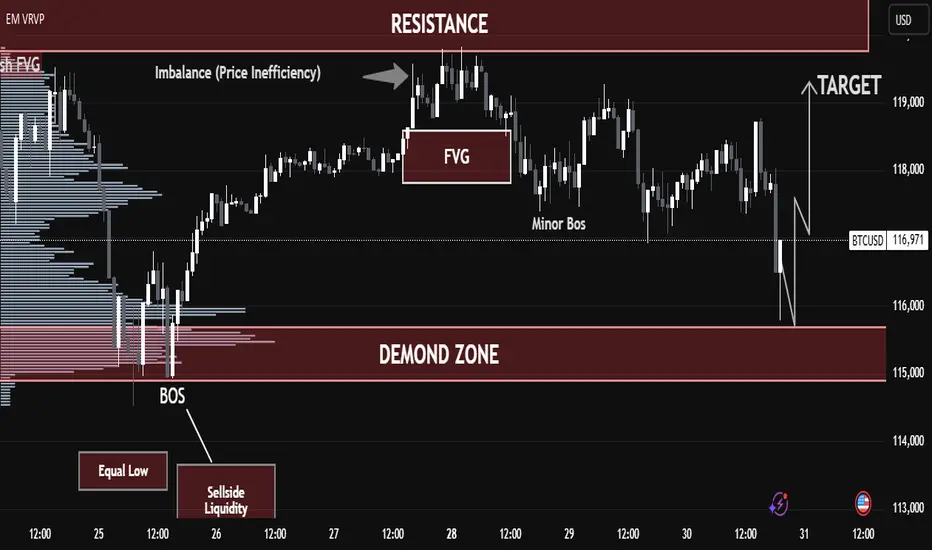
BTC/USD – Strong Buy Opportunity from Demand Zone BTC/USD – Strong Buy Opportunity from Demand Zone
🟢 Technical Outlook:
Bitcoin (BTC/USD) has tapped into a well-defined Demand Zone near 115,000–116,000, showing early signs of a potential bullish reversal. This level aligns with key liquidity zones, smart money concepts, and price inefficiencies — offering high-probability long setups.
🧠 Key Technical Highlights:
🔻 Equal Lows + Sell-Side Liquidity:
Market swept equal lows, grabbing liquidity below support — a common institutional setup before a bullish push.
✅ Break of Structure (BOS):
A prior BOS indicates a shift from bearish to bullish structure after liquidity collection.
📉 Fair Value Gap (FVG):
Price created and respected an FVG after the BOS, validating bullish intent.
📊 Imbalance Filled:
A prior price inefficiency has now been filled, completing a clean move from imbalance back into structure.
📈 Target Zone: 119,000 USD
Marked as the logical next stop — sitting near prior resistance and a liquidity zone.
🎓 Educational Insight:
This is a textbook Smart Money Concept scenario:
Sell-side liquidity sweep
Demand zone tap
Imbalance rebalancing
Shift in market structure
It shows how institutions often engineer liquidity grabs before a large directional move.
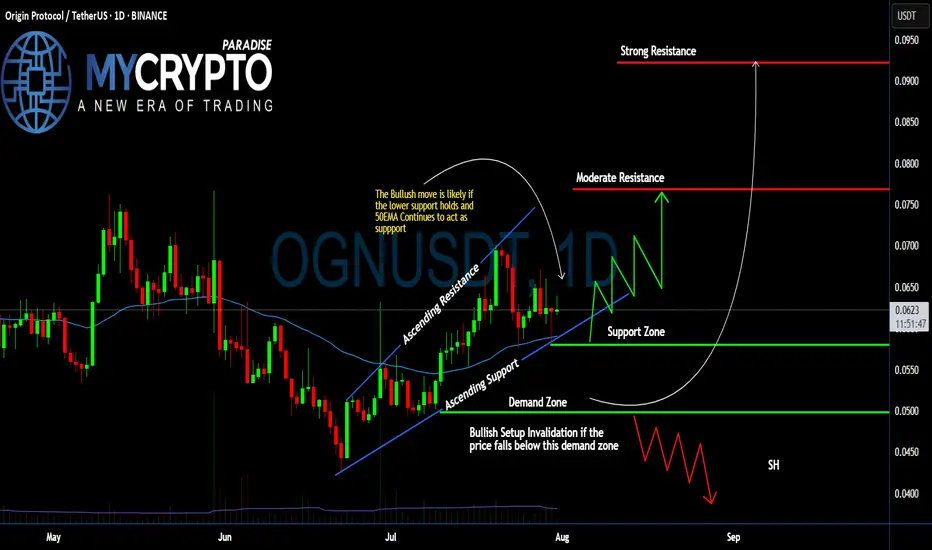
#OGN Ready For a Massive Bullish Move | Must Watch For BullsYello, Paradisers! Is #OriginProtocol about to explode to the upside, or is this a bull trap in disguise waiting to liquidate the impatient? Let’s break down what’s brewing on #OGNUSDT:
💎After forming a clean ascending channel, #OGN has been respecting both the ascending resistance and ascending support levels. Price is currently trading just above the 50 EMA, which has been acting as a dynamic support line since early July. This structure shows clear buyer interest around the $0.058–$0.062 zone—an area that aligns with volume cluster support.
💎The bullish scenario remains valid as long as #OGNUSD holds above the demand zone between $0.0499–$0.0580, and especially if it stays above the 50 EMA. As long as this structure is maintained, we could see a bounce toward the moderate resistance level at $0.076, where previous sellers stepped in and price stalled.
💎If buyers can break through that moderate resistance with strength and rising volume, the next key target lies at $0.092, which aligns with a strong resistance level and high-volume node on the visible range. This area is likely to trigger a reaction, so traders should remain agile.
💎However, if price breaks down below the demand zone, this would invalidate the current bullish setup and open the door for a potential move back toward the $0.045–$0.040 area. A broader shakeout would likely accompany this and could trap many late long entries.
Stay patient, Paradisers. Let the breakout confirm, and only then do we strike with conviction.
MyCryptoParadise
iFeel the success🌴
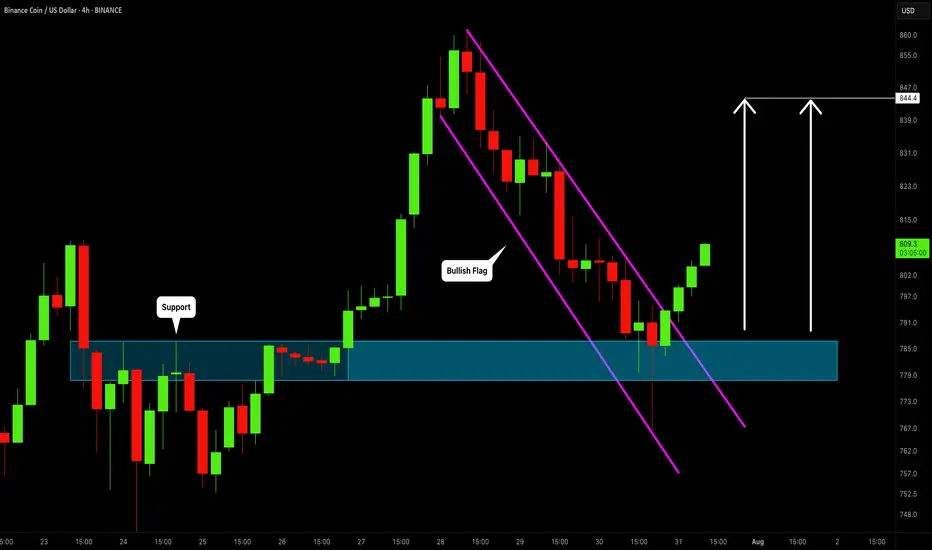
BINANCE COIN (BNBUSD): Bullish Continuation Ahead
BNB is going to resume growth after a retest of a recently broken structure.
A bullish breakout of a resistance line of a bullish flag provides a strong bullish confirmation.
I think that the price will go up to 844 level.
❤️Please, support my work with like, thank you!❤️
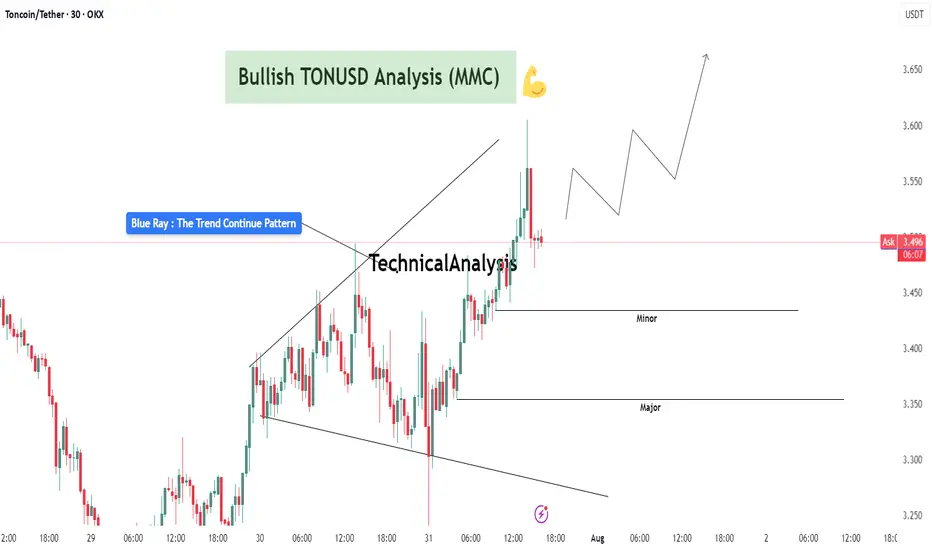
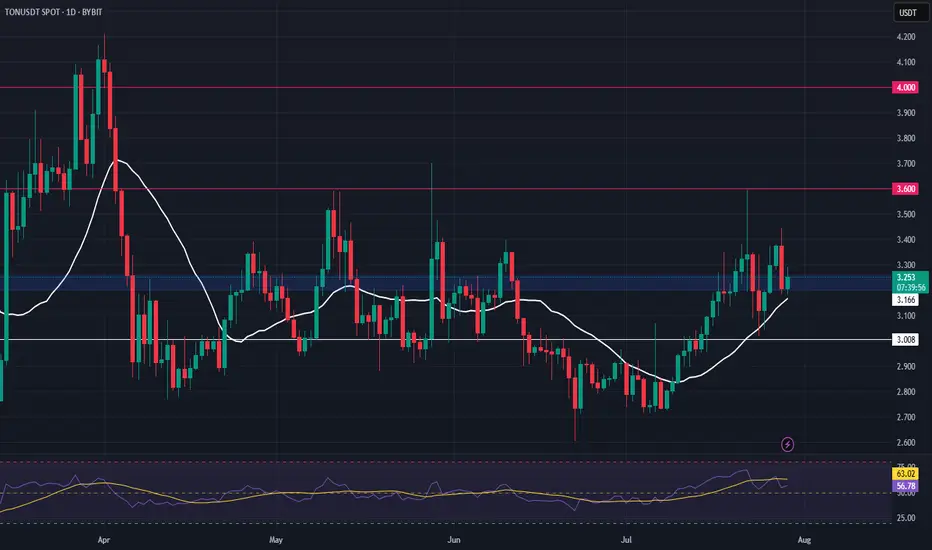
TONUSDT Analysis : Bullish Setup Breakout – Advanced MMC Analyze“Blue Ray Pattern Breakout Confirms Bullish Trend Continuation”
The 30-minute chart of TONUSDT highlights a clean and structured bullish setup based on the MMC (Mirror Market Concepts) methodology. The price action exhibits disciplined market behavior, respecting structural levels, breakout dynamics, and volume-based reactions.
🔷 1. Blue Ray Pattern – Trend Continuation Phase
This chart begins with the formation of the Blue Ray, a visual representation of trend consolidation and energy buildup. This pattern functions as a trend continuation flag or wedge. Prices compressed within a narrowing range, forming higher lows and lower highs, signaling accumulation under buyer control.
Once the pattern matured, we witnessed a decisive bullish breakout, where the price closed above resistance with conviction. This event marked a clear market intention shift and established a new impulsive leg.
🔍 2. Breakout Confirmation and Follow-Through
Post-breakout, TONUSDT experienced:
High-volume candles with elongated bodies, indicating increased buyer participation.
Immediate upside momentum that pushed the asset into a short-term overextended condition – often a healthy sign of strength when followed by a controlled pullback.
The breakout wasn’t just a false move – it was sustained, and the price held above the broken structure, proving that supply was absorbed and buyers were dominant.
🔑 3. Demand Zones (Minor and Major)
Two key MMC demand zones are highlighted:
🔹 Minor Demand Zone (~3.43–3.45):
This is the most immediate support and current price is hovering just above it. It's the first zone of interest for buyers and may serve as a re-entry or scaling point.
🔸 Major Demand Zone (~3.34–3.36):
In case of deeper retracement or volatility, this zone is expected to act as a strong bounce region based on past structure and MMC’s reversal logic. Price memory here suggests accumulation or reactive interest.
📐 4. Structure, Momentum, and Higher Timeframe Confluence
TONUSDT is in a confirmed uptrend, forming a clear sequence of higher highs and higher lows.
The structure supports a bullish flag breakout with minimal overhead resistance.
The projected path drawn on the chart illustrates a stair-stepping price pattern with continuation toward 3.60–3.70, if current levels hold.
📊 5. MMC Strategy Bias – Bullish
Using the MMC lens:
Blue Ray breakout confirms continuation
Volume absorption succeeded at the base of the flag
No signs of dominant supply entering post-breakout
Wave projection supports ongoing momentum
Structure favors buying dips, not shorting spikes
💡 Trader’s Takeaway:
TONUSDT is providing a textbook bullish opportunity under the MMC framework. As long as price stays above the Minor Demand Zone, continuation upward toward 3.60 and beyond remains in play. If price dips to the Major Zone, watch for strong buyer reactions for fresh entries.
Ideal for MMC traders and technical analysts looking to align with structured, logic-based entries and exits. This setup reflects market strength, technical clarity, and volume confirmation – a powerful trio for continuation plays.
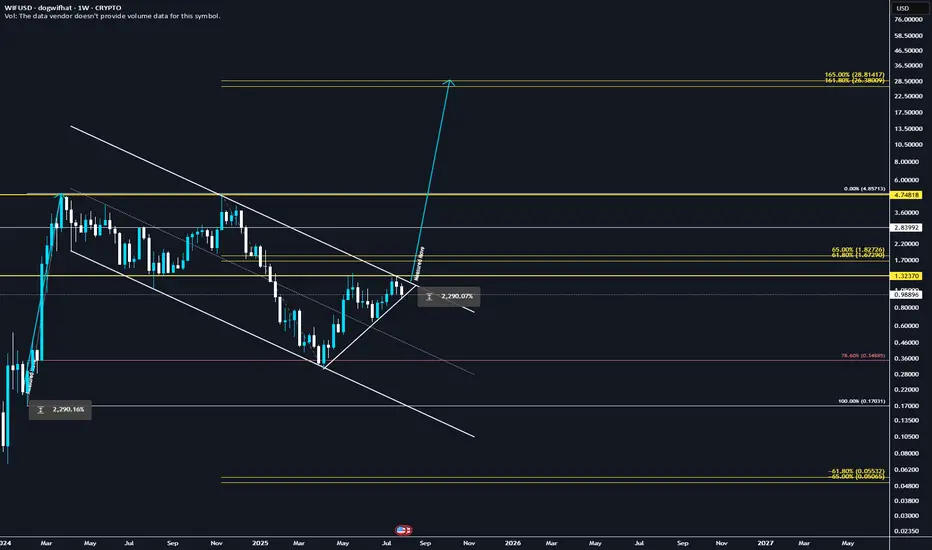
They're lying! WIF will explode to 28.8$ ✅ Golden Pocket Extension: $28.80 aligns with the 1.618–1.65 fib extension (golden pocket zone) from the last major impulse.
✅ Measured Move: Breakout from the prior downward consolidation projects to ~$28.80 when using the height of the range added to the breakout point.
✅ Confluence = High Probability: Both fib extension and measured move target the same zone, increasing confidence.
✅ Momentum + Meme Rotation: If broader meme coin rotation continues, WIF has narrative + volatility fuel.
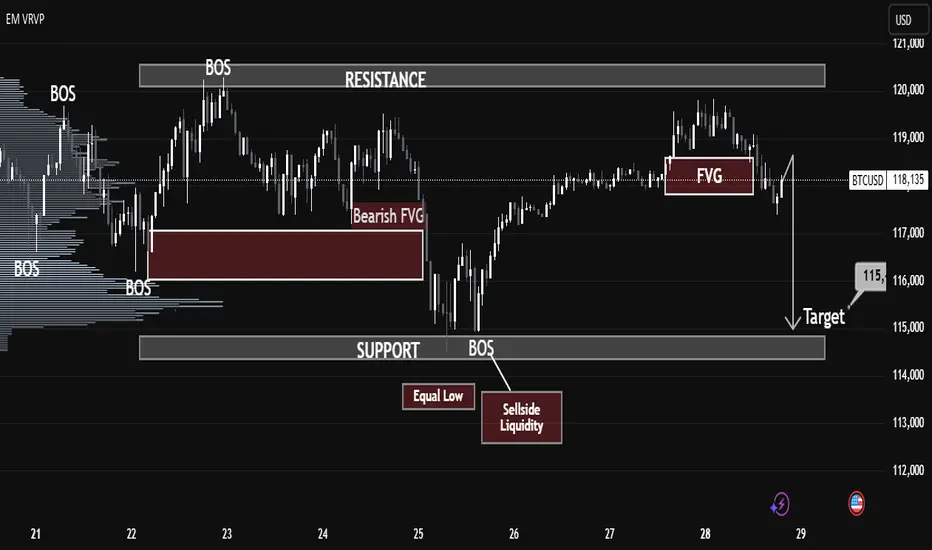
BTCUSD Market Breakdown – Liquidity Sweep Incoming?BTCUSD Market Breakdown – Liquidity Sweep Incoming?
🔍 Technical Analysis (July 29, 2025)
Chart Observations:
1. BOS (Break of Structure):
Multiple BOS events are identified, confirming key directional shifts in market structure. The last BOS near the support zone signals bearish intent.
2. Bearish Fair Value Gap (FVG):
A clean bearish FVG is left behind after a sharp drop on the 25th, indicating institutional imbalance and potential retracement area. Price rejected from that FVG later.
3. Equal Low & Sellside Liquidity:
The highlighted equal lows around July 25-26 mark areas of resting liquidity—prime targets for smart money manipulation.
4. New FVG Formed (July 28):
Another bearish FVG appears just before the projected breakdown, strengthening the case for a bearish continuation.
5. Support Zone Target – $115K:
A clean support zone (marked between 114,500–115,500) sits directly below the current market price. This is the likely liquidity target after sweeping equal lows.
6. Volume Profile (VRVP):
Low-volume nodes between the current price and support suggest minimal resistance to a sharp downward move.
⸻
🎯 Conclusion:
The structure, FVGs, and liquidity pools all point toward a liquidity raid below the equal lows, aiming for the support target near $115K. Traders should watch for a decisive break below the current range, especially if the FVG acts as resistance again.
TON Swing Trade – Support Zone in FocusTON is holding a major support level, setting up for a potential bounce. With structure intact, this offers a favorable long entry for swing traders looking to capitalize on the next leg up.
📌 Trade Setup:
• Entry Zone: $3.20 – $3.35
• Take Profit Targets:
o 🥇 $3.60
o 🥈 $4.00
• Stop Loss: $3.088
Will #TIA Continue to Soar or Bears Can Halt it? Must Watch Yello, Paradisers! Will we see #TIA continue to soar from here, or can bears halt its momentum? Let's see the latest setup of #Celestia to see what's going to happen:
💎Following a textbook ascending channel structure, #TIAUSDT has been respecting both its ascending resistance and ascending support, with each touchpoint confirming trader participation and growing confidence. Price is currently holding above the 50 EMA and within a crucial support zone between $1.80–$1.90—an area that previously triggered a strong impulse move to the upside.
💎The probability of a bullish continuation increases significantly as long as the #TIAUSD respects this support zone and the 50 EMA acts as dynamic support. If this level continues to hold, we expect a move toward the moderate resistance around $2.67, the key area where sellers previously stepped in aggressively.
💎But that’s not all—if bulls gain momentum and break above $2.67 with strong volume, the next price magnet becomes the $3.34 level, where strong resistance and high-volume node overlap. This level would likely be the point of exhaustion unless broader market momentum takes over.
💎However, caution is critical here. If price breaks below the strong demand zone around $1.507, this invalidates the bullish structure entirely and opens the door for a swift move down toward the $1.20–$1.00 range, where a potential market shakeout could occur. Remember, a failed bullish setup often becomes a powerful bear trap for undisciplined traders.
Stay patient, Paradisers. Let the breakout confirm, and only then do we strike with conviction.
MyCryptoParadise
iFeel the success🌴

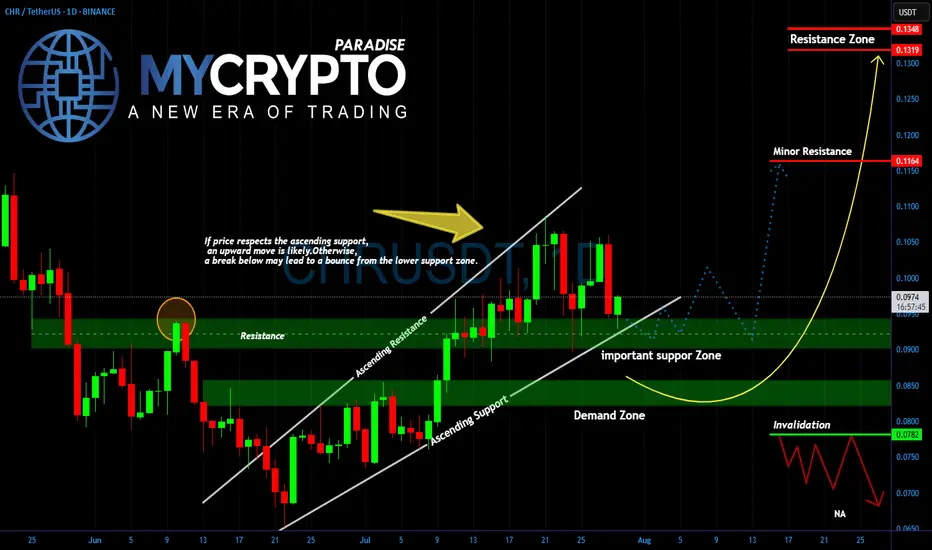
CHR Is About to Explode or Collapse Are You Ready for the Next BYello Paradisers, did you notice how #CHRUSDT is now testing the exact zone we warned about earlier? After weeks of climbing inside a clean ascending channel, the price is now sitting right on top of a critical support area. This is no coincidence what happens here will determine the next major wave.
💎The structure remains bullish as long as #CHR respects the ascending support trendline and the horizontal zone around 0.0900. This region, previously a strong resistance, is now acting as key support. If the bulls step in from here, we could see a sharp rebound toward the minor resistance near 0.1169. A confirmed breakout above that could open the path toward the upper resistance zone between 0.1320 and 0.1351.
💎But don’t get too comfortable. A clean break below this support zone would shift momentum back to the downside, dragging price toward the deeper demand area between 0.0840 and 0.0800. If the structure fully collapses and price breaks below 0.0782, we’d treat that as a clear invalidation of the bullish case, and a much lower range could open up.
For now, CHR remains in a waiting zone. It’s the reaction here that will give us the signal. Let the price come to you don’t chase it.
MyCryptoParadise
iFeel the success🌴
Ethereum Eyes $8K After Bullish BreakoutEthereum (ETH) is setting up for a powerful move. After hitting a multi-month high last week, ETH pulled back into a higher-low formation—strengthening the newly established bullish trend.
Money flow is shifting: with recent crypto legislation, Ethereum is now benefiting even more than Bitcoin, marking a notable change in market dynamics.
📈 Technical Highlights:
✅ Short-term target: $4,800–$5,000 (new all-time highs)
✅ Long-term potential: $7,000–$8,000
🛡️ Key support: $2,800–$3,000 (bullish as long as this holds)
📣 Takeaway:
Ethereum’s trend is firmly bullish. As long as support holds, pullbacks could offer strong entry opportunities for both swing traders and long-term investors.
#Ethereum #ETHUSD #Crypto #Trading #TechnicalAnalysis #CryptoTrading #EthereumPrice #Altcoins #Bullish #Breakout

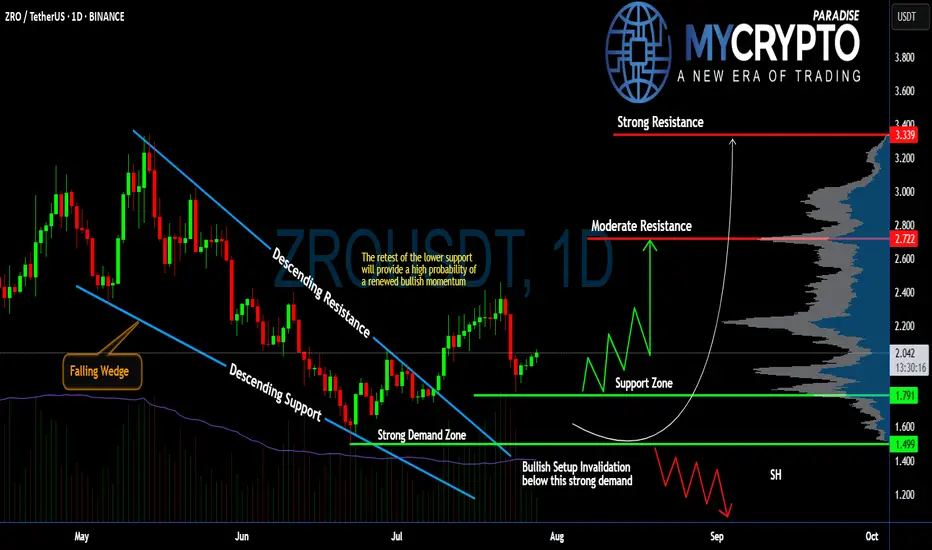
Will #ZRO Continue to Climb or Not? Must Watch For BullsYello, Paradisers! Are we witnessing the beginning of a powerful bullish reversal on #ZROUSDT, or is this just a fakeout setup? Let’s dissect this setup of #LayerZero:
💎After weeks of consistent bleeding, #ZRO has printed a classic falling wedge pattern, often a precursor to bullish reversals. This wedge has now been broken to the upside, with price currently trading around $2.037, suggesting renewed buyer interest following the breakout from descending resistance.
💎What’s crucial here is the retest of the wedge’s descending support, which aligns perfectly with a strong demand zone between $1.499 and $1.791. As long as #ZROUSD respects this zone, the probability of a bullish continuation remains high. This zone also serves as a clear invalidator for the setup—if price closes below $1.499, the bullish thesis will be off the table.
💎From here, if bulls can maintain control, we’re eyeing a potential move toward the moderate resistance at $2.722. That’s the first real hurdle where profit-taking or short interest could spike. A clean break above that level would open the path to the strong resistance around $3.339, where a heavy supply zone is likely to cap further upside.
💎Until then, we expect a series of zigzag corrections above the support zone before any sustained push higher. However, be cautious, losing the $1.499 support turns the structure bearish and could drag the price toward the $1.20 region, or lower.
Stay patient, Paradisers. Let the breakout confirm, and only then do we strike with conviction.
MyCryptoParadise
iFeel the success🌴
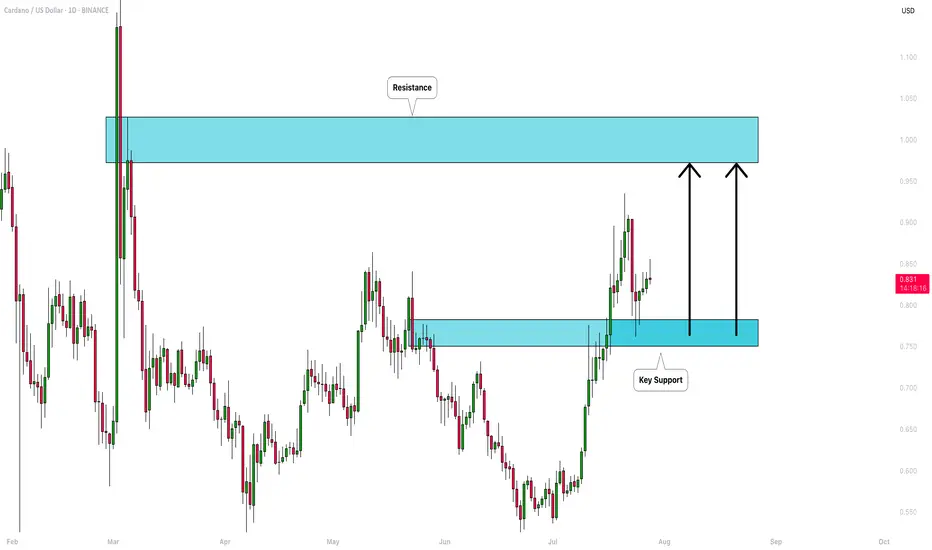
CARDANO (ADAUSD): Bullish Move Ahead!
ADA is testing a key daily support cluster.
I think the market is going to bounce from that
and continue growing.
Next resistance - 0.97
❤️Please, support my work with like, thank you!❤️
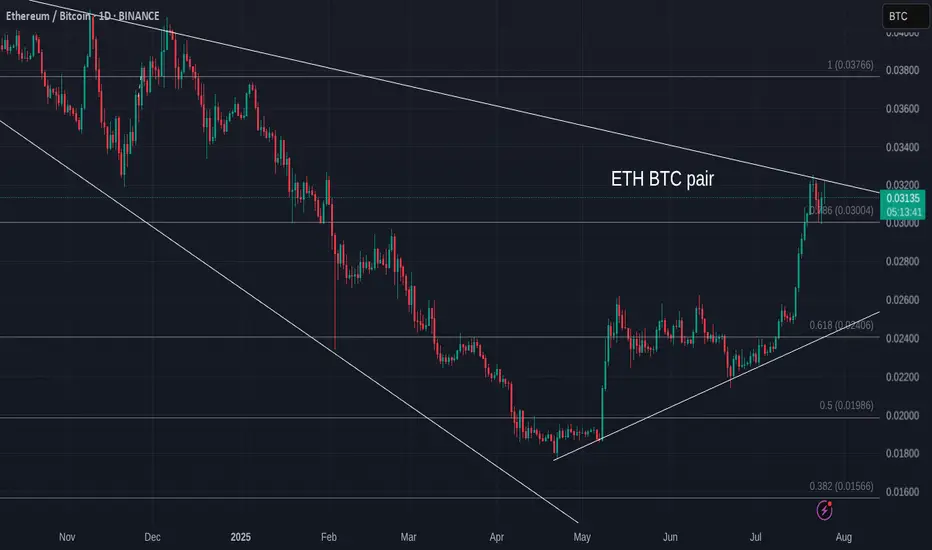
ETH Versus BTC - Daily Update - Bitcoin still winning
As mentioned yesterday, ETH has hit long term resistance and got rejected....and it is happening again
ETH seems unable to find the moemntum just yet.
The MACD Daily is still turning Bearish
The Daily RSI is also up high and likely to fall
The weekly RSI is also high though the Weekly MACD has still yet to rise above Neutral
All in All, for me, it is NOT the time....Though we can see that ALTS are running Hot though not a full ALT season as we have seen in the past.
It is fragile...please remain CAUTIOUS
#1INCH Setup Favors Bears | Can Bears Pull it Down Further? Yello Paradisers! Are you prepared for what might be the next big move on #1INCHUSDT? The #1INCHNetwork is flashing clear warning signs:
💎#1INCH is currently trading inside a Descending Triangle, a pattern that historically favors bears. The price has broken down the lower support and is coming to retest it. If #INCHUSD retests the lower support and doesn't enter the descending triangle, the probability of the bearish pressure will increase.
💎The 50 EMA is acting as a strong dynamic resistance, reinforcing the bearish bias. Every attempt to reclaim higher levels has been rejected, and as long as we remain capped below the descending resistance, bulls are at a clear disadvantage.
💎A successful retest of the lower support trendline will significantly increase the probability of a breakdown. If this triangle finally breaks to the downside, we should be watching the $0.2116 support zone as the first key level to catch any temporary reaction.
💎But the real danger — and opportunity for patient traders — lies lower. If $0.2116 fails, the next strong demand zone sits at $0.1582, which could be the level where real buyers finally step back in. Until then, any bullish scenario remains invalid unless the price breaks and closes above the strong resistance at $0.3332.
Trade smart, Paradisers. This setup will reward only the disciplined.
MyCryptoParadise
iFeel the success🌴

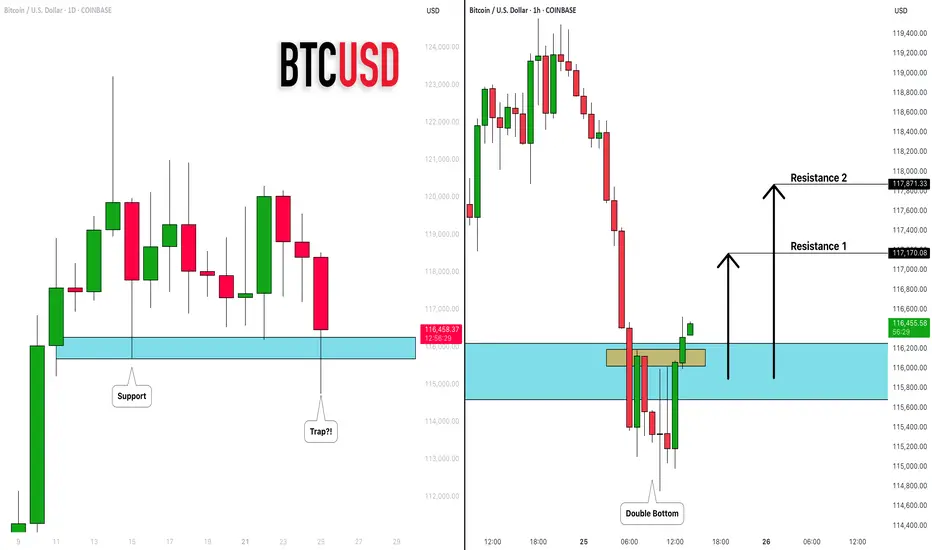
BITCOIN (BTCUSD): Recovery Starts
Bitcoin is going to rise from a key daily support.
After a liquidity grab, the market shows a clear strength,
forming a double bottom on an hourly time frame.
I expect a bullish movement at least to 117100
❤️Please, support my work with like, thank you!❤️
I am part of Trade Nation's Influencer program and receive a monthly fee for using their TradingView charts in my analysis.
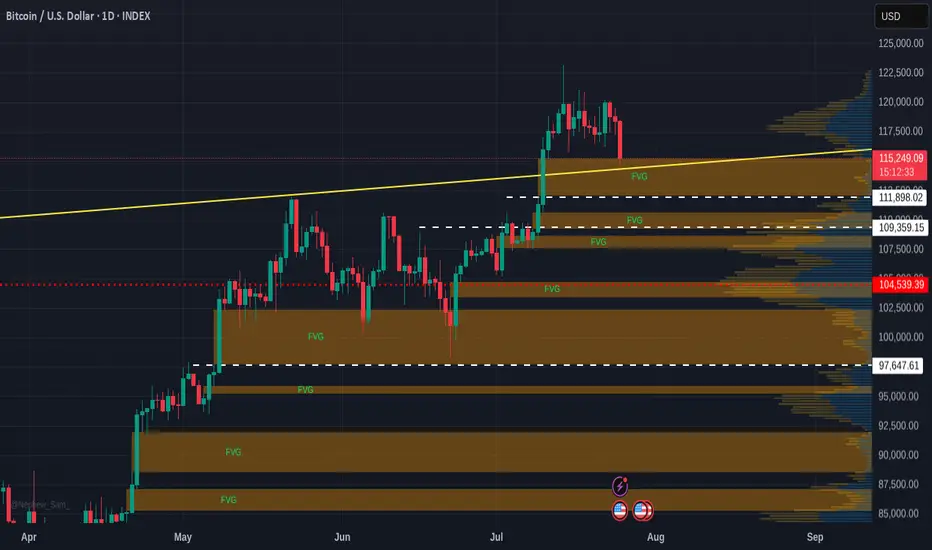
Quick BITCOIN Fair Value Gap Update -Where will dip stop
The sharp drop caused by Galaxy Digital seel off has brought PA to a line of support but also to the top of a Fair Value Gap ( FVG)
This could cause a further slide as traders decide to try and pick up some BTC from this gap.
FVG have a tendancy to be used as Good trading spots due to the lack of previous trading in that range
So, if support breaks, we could see a return to 111K as the fist gap gets filled.
We could alsp return to 109K - 107Kshuold momentum continue.
And finaly, should the move seem to attractive to some, a final Wick down to 97K is possible. This would Terrify many and would also be such a Good opportunity to buy.
I think it is unlikely though
Just my opinion but I am looking to place Buy orders between 109 - 107......just incase
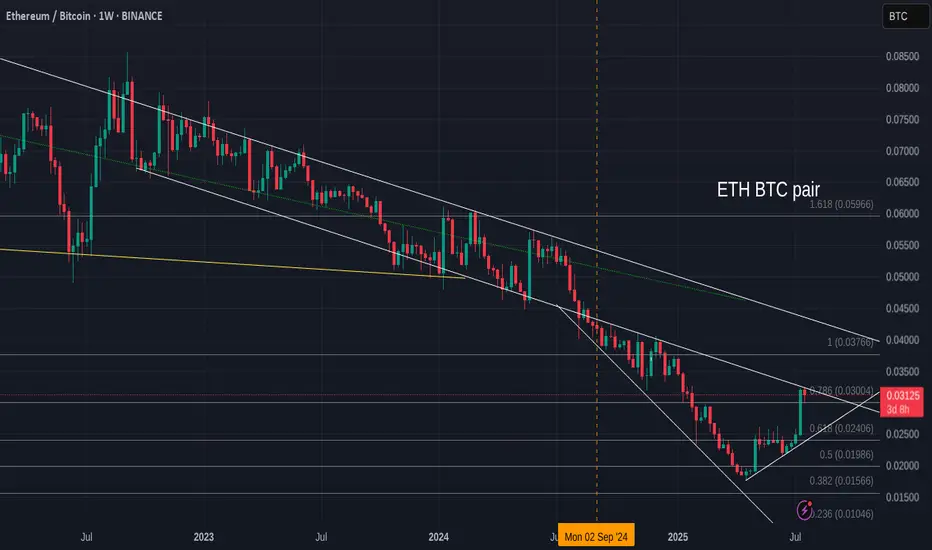
Lets look at ETH V Bitcoin for a moment, before you jump in
Ever since Nov 2021, ETH has Lost Value compared to Bitcoin, as we can see on this ETH BTC chart.
Even while Bitcoin entered a Deep Bear market, ETH lost More....
And now, as we see ETH make a strong move, we have people screaming, "ETH to 10K"
And given how ETH is backed by almost everything American, as America wants ETH as its own Crypto.
Nut lets look here at simple idea.
ETH is up agains Stiff long Term resistance right now.
If we look at the daily chart.
We can already see how PA has been bumped down...an is trying again, even with a daily MACD turning Bearish
The weekly MACD has room to go higher and so I do expect PA to break over resistance and to nreak higher should sentiment remain strong.
As ever, this relies HEAVILY on BTC Dominance and Bitcoin PA to play along.
For me, I am not touching it, even if I can make money on it..
Principles
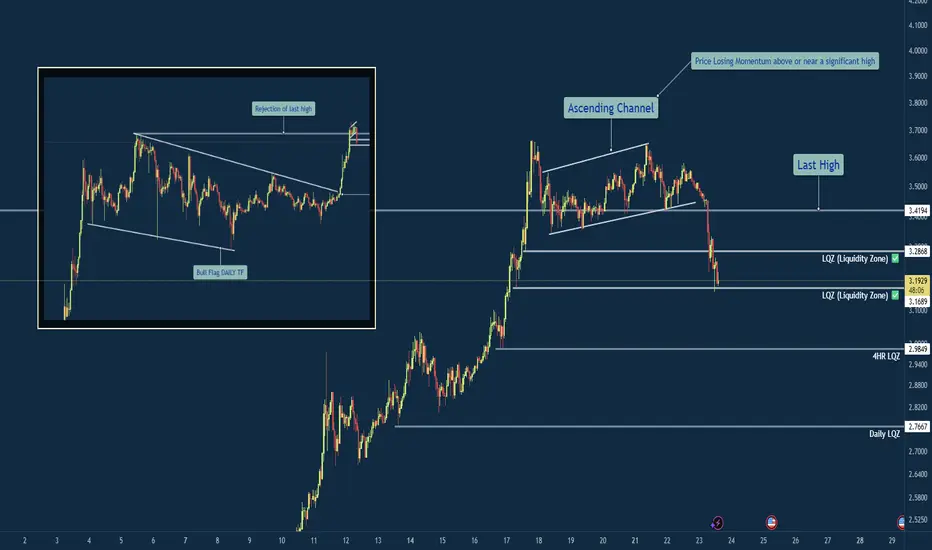
XRP/USD – Bearish Shift After Momentum Exhaustion🧠 Summary:
XRP/USD has shown clear signs of exhaustion after sweeping the previous high. Following a breakout from a daily bull flag, price struggled to hold momentum near the key level of 3.4194, forming an ascending channel that eventually broke down. Liquidity zones below current price are now in focus.
🔍 Technical Breakdown:
✅ Daily Bull Flag → Broke out with strength
⚠️ Rejection near Previous High (3.4194) → No follow-through
🔼 Ascending Channel → Formed post-impulse, now broken
📉 Momentum Shift → Structure flipped bearish
💧 Liquidity Zones (LQZ) below price acting as magnets
📌 Key Levels:
🔹 Last High: 3.4194 (Rejection Point)
🔹 Broken LQZ: 3.2868
🔹 Current Support: 3.1689 (LQZ - being tested)
🔹 Target 1: 2.9849 (4HR Liquidity Zone)
🔹 Target 2: 2.7667 (Daily Liquidity Zone)
🧩 Confluences:
Liquidity sweep of prior high
Momentum loss near key resistance
Break of ascending structure
Retesting broken zones with room below
⚠️ Final Thoughts:
This trade is playing out just as we described in the post before this on XRP. We discussed watching how price would react to this area before making any type of "Late Entries". XRP is still a huge and vital part of the Crypto Eco System so long term i am holding my Long position. The areas on the chart are still great areas to buy in at "Dollar Cost Average". This will be one of those positions that though it may be bearish on the lower time frame you need to zoom out and always keep an eye on the weekly and daily chart before making any drastic moves.
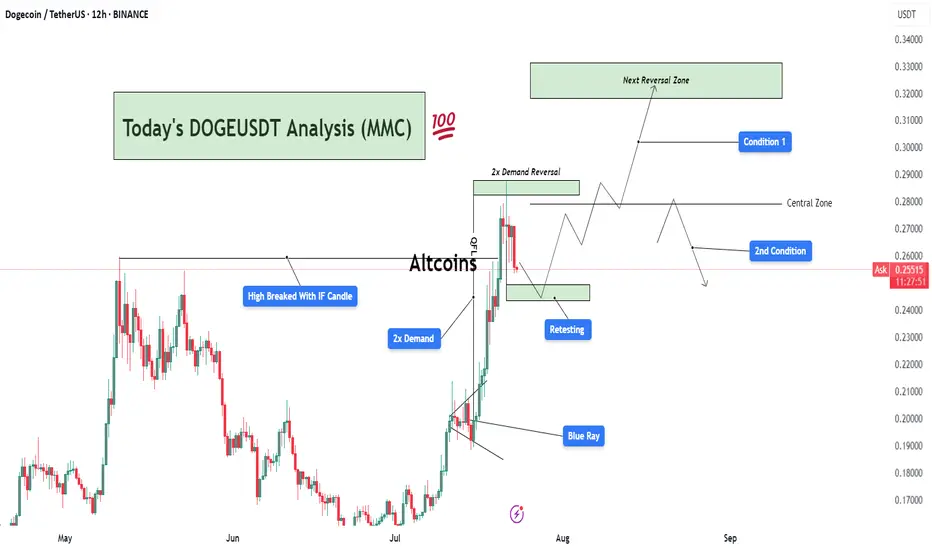
DOGEUSDT Analysis : Demand Zone Retest Before New Highs Target📊 Overview:
Today's DOGEUSDT analysis (12H chart) under the Mirror Market Concept (MMC) framework reveals a potential bullish continuation or corrective phase based on two major conditions. The market structure is transitioning after a strong impulsive move, triggered by a 2x Demand Zone breakout, and is now in the retesting phase.
🔍 Key Technical Breakdown:
High Broken with IF Candle:
A significant previous swing high was broken decisively by an Initiation Flow (IF) candle, indicating institutional activity or aggressive buying pressure.
This confirms a shift in market structure toward a bullish trend.
2x Demand Zone:
This zone has served as a strong base for price accumulation and an impulsive breakout.
The market responded well with a sharp rally post this demand, validating it as a critical support.
Blue Ray Zone (Support Zone):
The bullish breakout was partially driven by this inner trendline zone (referred to as Blue Ray), where price respected the rising support channel before breakout.
This shows smart money liquidity engineering prior to the breakout.
Retesting Zone:
Currently, the price is retracing toward a previously broken demand zone.
If this zone holds, it could provide an optimal entry for continuation.
📈 Two Scenarios (Conditions):
✅ Condition 1: Bullish Breakout to Next Reversal Zone
If the retest holds and price prints bullish confirmation (e.g., engulfing or pin bar), we can expect price to move up toward the next key reversal zone between $0.3100–$0.3300.
This zone is marked as a potential supply/reversal zone, where large sell-offs may occur.
This path follows the continuation structure under MMC, aligning with trend-following buyers.
⚠️ Condition 2: Failure to Hold Demand → Deeper Pullback
If the current demand zone fails to hold and price re-enters below the central zone (~$0.2700), we could expect a deeper correction.
Price may then revisit lower demand regions, potentially toward $0.2200 or lower, depending on rejection strength.
📌 Important Notes:
The central zone acts as a pivot level, defining whether bulls or bears gain short-term control.
Monitor the reaction from retesting area closely — candle confirmation is key before any trade execution.
This chart follows Mirror Market Concepts (MMC), combining smart money behavior, demand/supply reversal logic, and psychological market zones.
💬 Final Thoughts:
DOGEUSDT is currently in a critical phase. The market has shown strength, but now it's about confirmation. Patience is key — wait for a clean break or rejection around the retesting zone to determine the next direction. The analysis favors bullish continuation, but being flexible with both scenarios gives traders an edge.
Can #GALA Sustain the Current Bullish Momentum or Will it Fall?Yello, Paradisers! Is this #GALA pullback just a healthy retest before another explosive rally, or are we about to see a deeper drop that will wipe out impatient bulls? Let’s break it down:
💎After weeks of trading inside a descending channel, #GALAUSDT finally broke above the descending resistance, sparking renewed bullish momentum. The breakout has pushed the price toward the $0.020 zone, but now #GALA has encountered a resistance zone (previously support). The question remains: will GALA maintain this level or revisit lower supports before proceeding higher?
💎The current structure shows #GALAUSD attempting to convert its previous resistance into new support around $0.018–$0.020. A clean retest of this support zone would significantly increase the probability of a sustained bullish continuation. The 50EMA acting as support and positive macro trend in crypto market reinforces our bullish bias.
💎If buyers remain in control, the first upside target is the moderate resistance at $0.0253. However, the major profit-taking and strong selling pressure are expected near the $0.0312 zone, where the strongest resistance lies. A successful break and hold above this level would confirm a more aggressive bullish trend.
💎On the flip side, the bullish setup becomes invalid if #GALA loses the strong demand zone at $0.0162–$0.0134. A confirmed close below $0.0134 would flip the structure bearish and open the door for another leg down.
Stay patient, Paradisers. Let the breakout confirm, and only then do we strike with conviction.
MyCryptoParadise
iFeel the success🌴

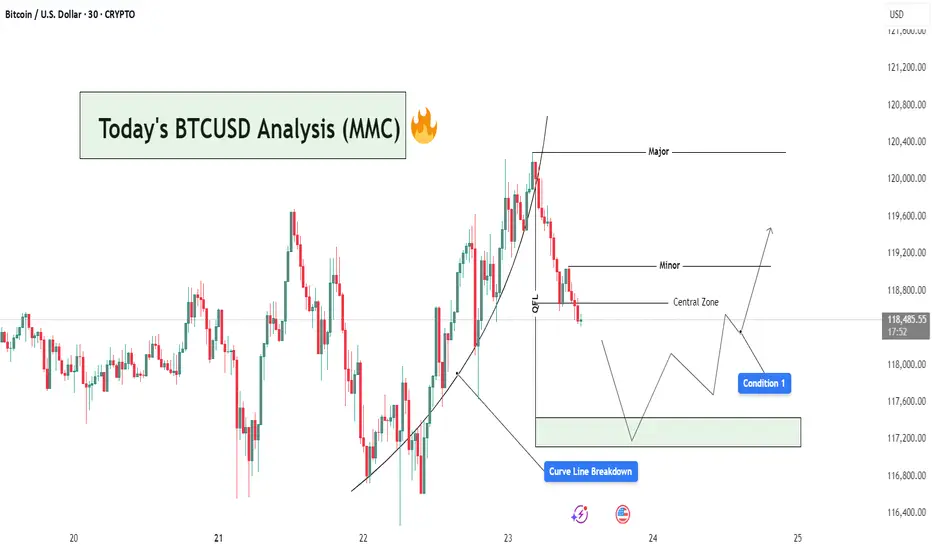
BTCUSD Analysis : Curve Line Breaked and Move Towards Target📊 Market Overview:
BTCUSD has recently completed a strong bullish leg, following a parabolic curve formation that led price into a Major Resistance Zone near the $120,400 level. This rally aligns with MMC principles where price forms momentum-driven structures before reaching high-liquidity zones (often ending in exhaustion).
📍 1. Curve Line Support & Breakdown – A Shift in Sentiment
Your chart shows a clear Curve Line that supported the bullish impulse. Price respected this dynamic support throughout the uptrend until a Curve Line Breakdown occurred—marking the first sign of bullish weakness.
In MMC strategy, this curve structure breakdown is critical:
It tells us the accumulation → expansion → exhaustion cycle is ending.
The market is likely entering retracement or distribution phase.
Price often seeks lower equilibrium, typically around the Central Zone.
🧠 2. QFL Zone (Quick Flip Level) – The Hidden Base
Immediately after the curve broke, price moved toward the QFL level, which represents a demand base from earlier structure. This zone acts as a short-term support and often produces a reactive bounce (but not always a reversal).
Watch closely:
If price respects this zone → temporary relief bounce
If it fails → we’ll likely see full test of Central Zone or lower demand levels
🟩 3. Central Zone – The MMC Decision Area
The Central Zone is a key horizontal level on your chart, defined between ~$117,300 and ~$118,200. This zone is marked based on:
Previous structure
Volume clusters
Demand imbalance
Why is this zone important?
It serves as the balance point between buyers and sellers.
A bullish reaction here could re-initiate a move toward Minor Resistance (~$119,200).
A failure to hold could open the door for deeper retracement toward the green demand box (~$117,200 or below).
🔄 4. Two Primary MMC-Based Conditions to Watch:
✅ Condition 1: Bounce from Central Zone
Price reacts from within the Central Zone
Forms bullish structure (double bottom, bullish engulfing, or reversal wick)
Short-term target becomes Minor Resistance (~$119,200)
If volume increases and price breaks above Minor, continuation toward Major is possible
❌ Condition 2: Breakdown & Bearish Continuation
Price fails to hold within Central Zone
Bearish structure forms (e.g. lower highs, breakdown candles)
Clean move expected toward next liquidity pocket at $117,200–$116,800
This would confirm market shifting into bearish control
📌 5. Minor vs Major Levels – Key Zones
Minor Resistance (~$119,200): Short-term target if bounce occurs
Major Resistance (~$120,400): Liquidity sweep zone, strong supply
Green Demand Box (~$117,200): If Central Zone fails, this becomes next bounce zone
📘 Final Thoughts:
This is a classic MMC setup in real-time:
Curve Formed → Broke
OFL + Central Zone → Now being tested
Next move depends on confirmation from buyers or sellers at Central Zone
Don’t trade emotionally — let price action give you confirmation before taking any positions. Watch the Central Zone behavior closely and manage risk based on scenario outcomes.