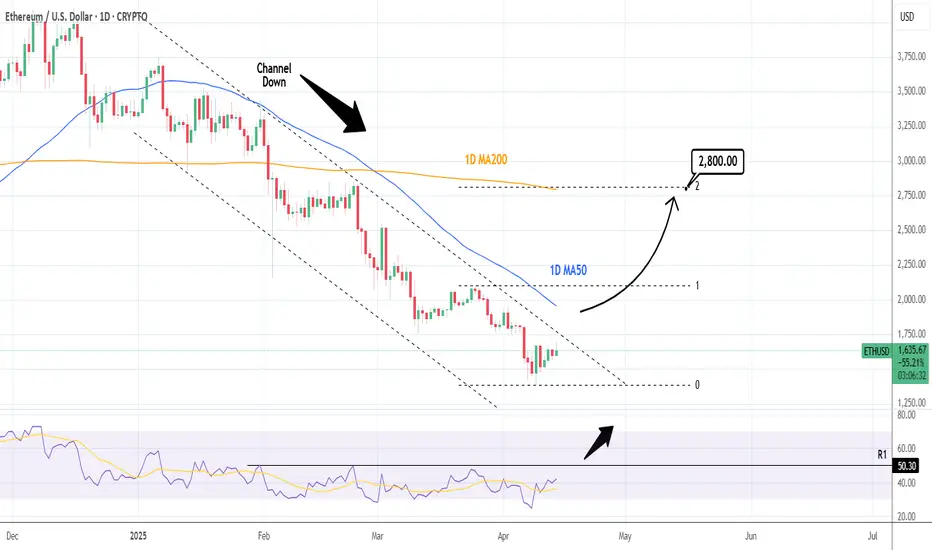
ETHUSD: Prepare to buy if this trendline breaks.Ethereum remains bearish on its 1D technical outlook (RSI = 41.779, MACD = -115.050, ADX = 39.213) despite an encouraging start to the day as the 4 month Channel Down is intact. The 1D RSI is supported and is trading sideways and ETH itself is back to historic buy levels. We are willing to buy only after a break over the 1D MA50 validates the trend change technically. If that happens we will aim for the 2.0 Fibonacci extension (TP = 2,800). You can use as an extra validation condition a potential break of the 1D RSI above the R1 level.
## If you like our free content follow our profile to get more daily ideas. ##
## Comments and likes are greatly appreciated. ##
Cryptotrading
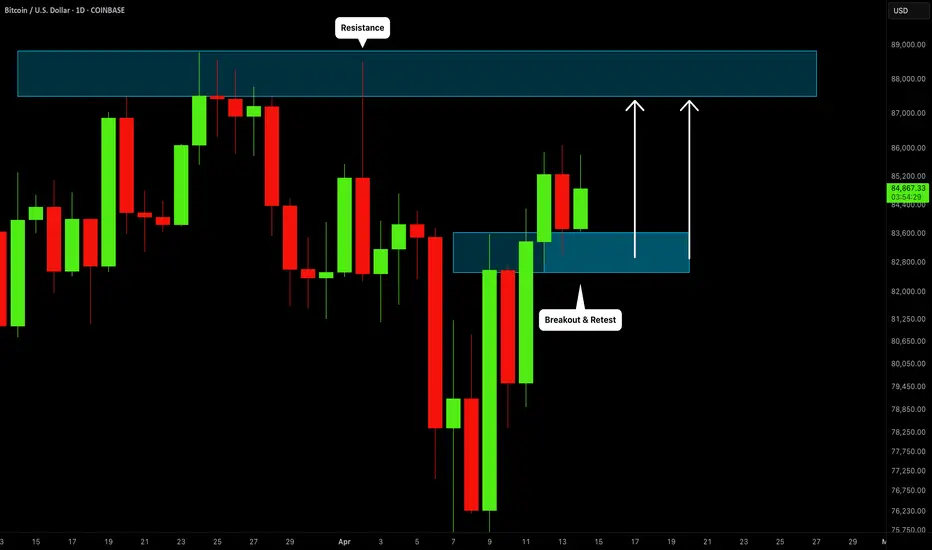
BITCOIN (BTCUSD): More Growth is Coming
Bitcoin is positioned very bullish after a confirmed breakout
of a minor daily horizontal resistance.
We see a positive reaction after its retest.
I think that the price may reach 87450 level soon.
❤️Please, support my work with like, thank you!❤️
XLM/USD Main trend. Timeframe 1 week. Channel. Radiant Star of 2218) One of the most “silent” cryptocurrencies. Unlike its fellow clone, pumped up by the community on the ears of pseudo-esoterics (although 589 is not going anywhere, which is, that is, it is not price))))....
Note that past secondary trend reversals are shrinking after significant dips. We are now in the lower zone of the channel, but not at the lowest potential values. Never “catch” the lows and highs, but work most of your position near those values, and you will be happy and relaxed.
I advise you to combine pyramiding (up) + martingale (down), and you won't care where the price goes, because you'll be happy with either direction. It is also rational to protect your profits with stops, but not near intraday volatility.
It is also natural for your peace of mind to forget about two things if you have a mind:
1) Forget margin trading. Work only on spot.
2) Forget the 1 “world's most reliable exchange” (diversification of trading and storage).
Coinmarket: XLM
About the enlightenment: .
1) Instant (less than 3 sec) transactions,
2) Conditionally free transactions $0.000001 (0.00001 XLM micro payments),
3) No network congestion (30 sec refund in case of failed transaction (not to be confused with exchange),
4) Smart contacts and NFT (2022),
5) "Transaction rollback" (this is an advantage, not a disadvantage for real use, not speculation),
6) Support for multi-currency transactions.
7) Interest in XLM blockchain by states.
And much more...
Roughly speaking, all the best worked out solutions from thousands of temporary “faith cryptocurrencies” over the last 10+ years.
Incidentally, many states will be making “transitional” fiat currencies on this blockchain. For example, the long-suffering Ukraine. But then when there will be “total sadness”. Creating a problem—presenting a ready-made solution.
Here's what this important zone looks like on the 1-day timeframe. Key reversal or trend continuation zone.
Breakout of the local symmetrical triangle +10% to the mirror resistance level of 0.2022.

Can #AAVE Bulls Sustain the Current Momentum? Key Levels Yello, Paradisers! #AAVE looks bullish on the surface—but is this setup quietly setting up for a brutal dump? Here's the key level that will trigger the next big move:
💎#AAVEUSD is currently trading around $143.66, holding inside a clear ascending channel on the 4H timeframe. The price action of #AAVE has been respecting both the ascending support and resistance trendlines, forming higher lows and higher highs—but momentum is fading.
💎A bearish divergence on the momentum oscillator is signaling early weakness despite the price climbing higher. This divergence usually marks the beginning of a bull trap, where the price appears strong just before a sharp reversal.
💎The immediate resistance to watch is in the $156. This is where price was recently rejected, near the upper channel trendline. Above that, $156 remains the key Bearish Setup Invalidation level. A breakout and hold above this would invalidate any bearish structure and could lead to a push toward $170+.
💎However, if AAVE breaks below the ascending support, currently near $140, it opens the door for a sharp drop. The first target is the $126.10 support zone, followed by the $114.35 level, which aligns with a strong historical demand area.
Play it safe, respect the structure, and let the market come to you. Discipline, patience, and strategy are what separate long-term winners from short-term gamblers
MyCryptoParadise
iFeel the success🌴

Breakout in Aergo (AERGOUSDC)...Chart is self explanatory. Levels of breakout, possible up-moves (where crypto may find resistances) and support (close below which, setup will be invalidated) are clearly defined.
Disclaimer: This is for demonstration and educational purpose only. This is not buying or selling recommendations. Please consult your financial advisor before taking any trade.

ZRO Bullish Setup | Time to Buy? (4H)Since the red arrow was marked on the chart, ZRO has shown signs of entering a bullish phase.
Wave A appears to have completed, and the price is now developing into wave B, which is unfolding as a diagonal (diametric) structure. At the current stage, we are likely in the early movement of wave g, a corrective bearish leg within this larger structure.
Key Buy Opportunity:
We’re closely watching the green support zone as a potential bullish reaction area. If price action confirms, this level may offer a prime long/buy setup with a favorable risk-reward ratio.
Invalidation Level:
A daily candle close below the invalidation level will invalidate this bullish scenario.
For risk management, please don't forget stop loss and capital management
When we reach the first target, save some profit and then change the stop to entry
Comment if you have any questions
Thank You

FARTCOIN/USDT – HIGH PROBABILITY SHORT FROM PREMIUM ZONEMarket structure shift confirmed with CHoCH, signaling bearish intent.
Price is retracing to fill the Fair Value Gap (FVG) — a premium zone where institutions are likely to re-enter shorts.
Entry: 0.8971 – 0.9010
Target: 0.8571 – 0.8264 – 0.7689
Stop: 0.9254
This is a high-RR setup with clean structure, imbalance, and trend alignment.
Entry in FVG with confirmation = sniper entry.
Targeting downside liquidity zones with ~1:3.5 RR.
Always do your own research, manage your risk, and use proper confirmation before entering any position. Trade responsibly.

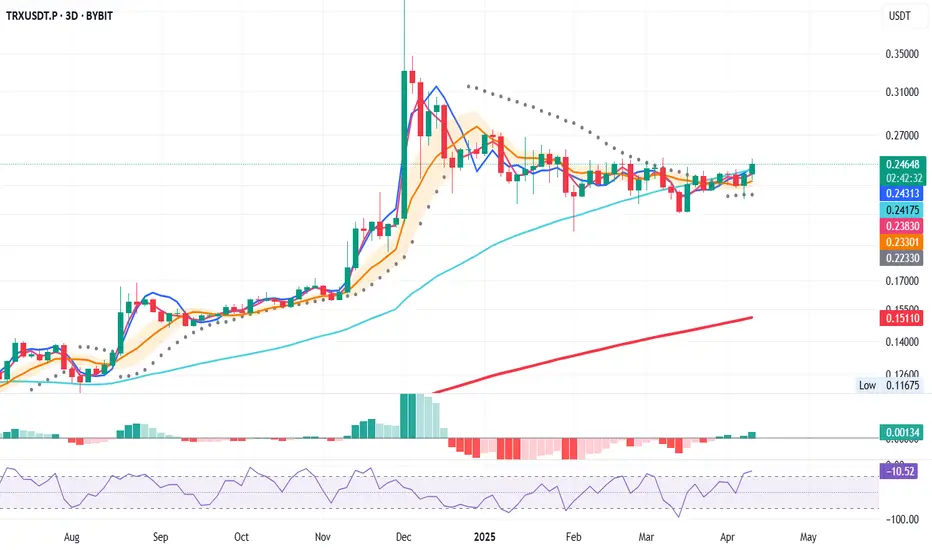
TRXUSDT – Bullish System Trigger (3D Chart)
📅 April 13, 2025
Today’s 3D bar close offers a strong bullish signal, aligning multiple system indicators in favor of a long entry.
Here’s what the system confirms:
✅ Price closed above the 50 MA – bullish structure
✅ MLR > SMA > BB Center – solid confluence
✅ Price > PSAR – trend shift confirmed
✅ Above the 200 MA – long-term trend support
Entry Strategy
- Open long at the 3D bar close
- Stop-loss below the latest PSAR dot for system integrity
📌 Note: This is a system-based entry — not a prediction.
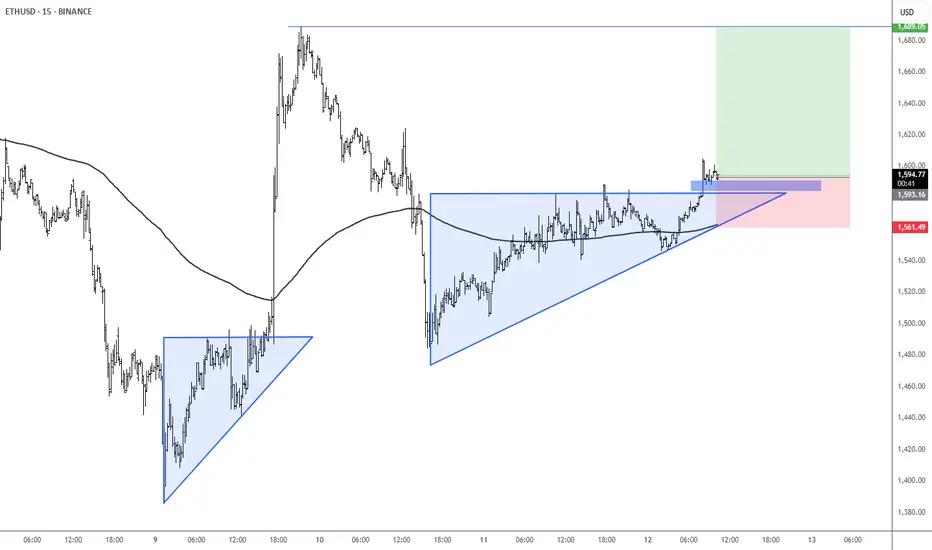
ETHUSDT BUYEthereum buy signal on M15 Timeframe, Bullish triangle resistance was succesfully broken. Now bullish target is 1689 level. Risk reward 1/3
ORCA/USDT – Futures Setup: Potential Short OpportunityORCA is currently testing a resistance zone at 2.940 USDT, an area where selling pressure has historically emerged. Price action indicates a potential rejection, setting up a possible short trade targeting lower support levels.
📌 Futures Trading Levels:
Entry Zone: 2.920 - 2.940 – short positions could be considered upon confirmation of rejection.
Stop-Loss: 3.075 – placed above resistance to limit risk exposure.
Take-Profit Targets:
First TP: 2.79
Second TP: 2.665
Third TP: 2.51
This structure aligns with futures trading principles while maintaining risk management. Let me know if you’d like further refinements! 🚀📊

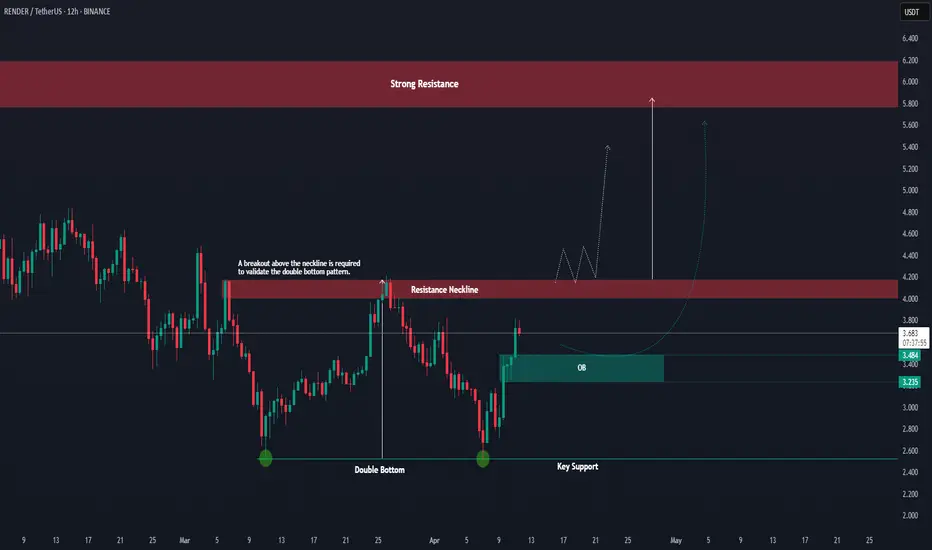
RNDR/USDT – Double Bottom Formation Signals Reversal PotentialRender (RNDR) is currently forming a Double Bottom pattern, signaling a potential bullish reversal from recent lows. The pattern is validated if the price breaks above the Resistance Neckline at 4.200, confirming strength from buyers.
📌 Key Technical Levels:
Key Support: 3.235 – a critical level where price previously found buying interest.
Order Block (OB) Zone: 3.400 - 3.484 – potential demand area for renewed bullish momentum.
Strong Resistance Zone: 5.800 - 6.200 – historical selling pressure likely to be met if price continues upward.
A decisive break above the neckline could trigger a rally toward the Strong Resistance Zone, aligning with prior structural reactions. However, failure to sustain momentum might see retests of Key Support and the OB zone for liquidity gathering. Traders should monitor volume confirmation and price reaction at these critical levels.
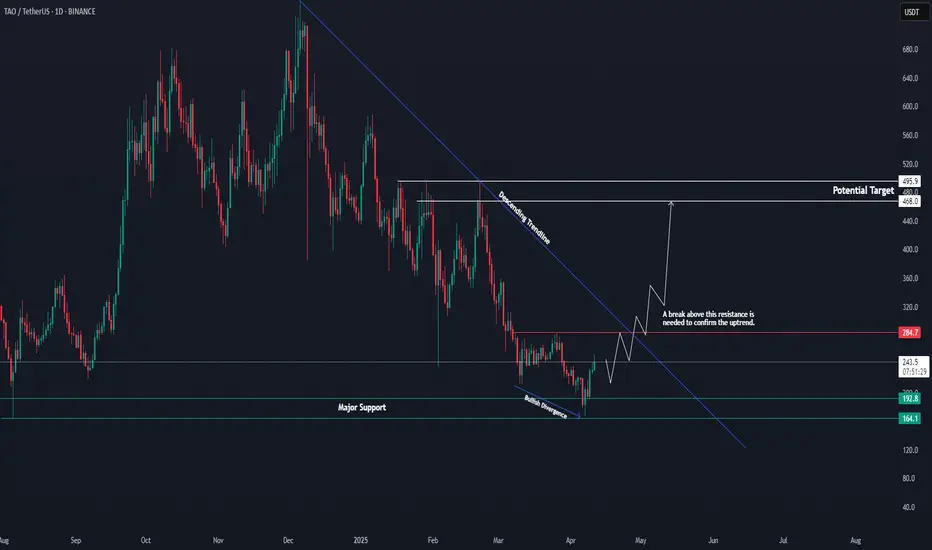
TAO/USDT – Bullish Reversal Setup Taking Shape#TAOUSDT is showing early signs of a potential trend reversal following a prolonged downtrend. Price has recently rebounded from a key major support zone between $164 and $192, where a bullish divergence with the RSI has emerged—indicating a possible shift in momentum.
A well-defined descending trendline has been acting as dynamic resistance since the November 2024 high. Currently, price is approaching a critical resistance level around $284.7. A confirmed breakout above this area would be a strong signal that the market structure is beginning to shift in favor of the bulls.
If price breaks and holds above this resistance, the next upside targets are:
$468
$480
$495.9, in line with previous supply zones and structural highs.
Momentum is also improving, with RSI crossing back above the 50 level, supporting the bullish case. However, a clean breakout with sustained volume will be key to validating this setup.
Levels to Watch:
Support: $192.8 and $164.1
Resistance: $284.7, followed by $468–$495.9
Until we see a confirmed breakout, caution is warranted. Failure to clear the trendline may lead to another retest of support.
Summary:
#TAO is setting up for a potential bullish reversal, but confirmation above $284.7 is critical. A move beyond that level could open the door for a significant upside continuation. As always, manage risk accordingly and wait for confirmation.
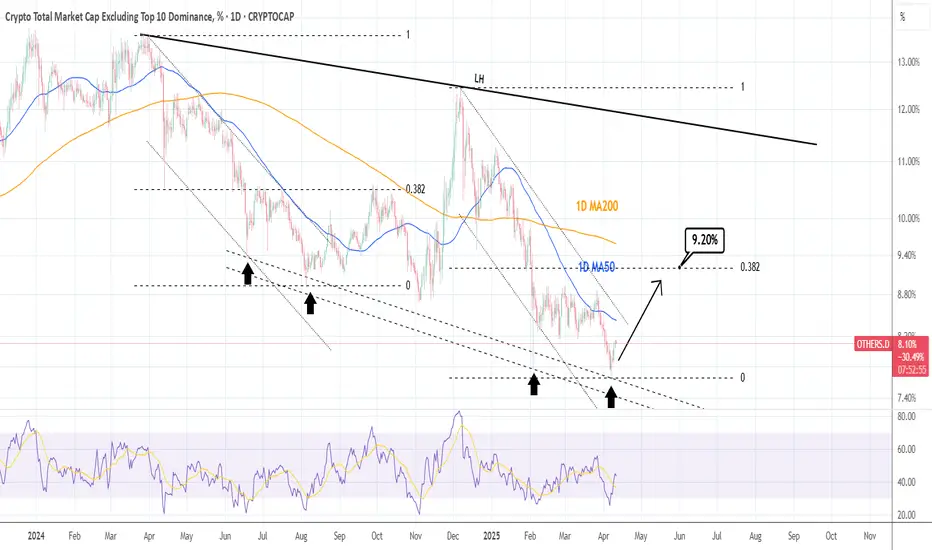
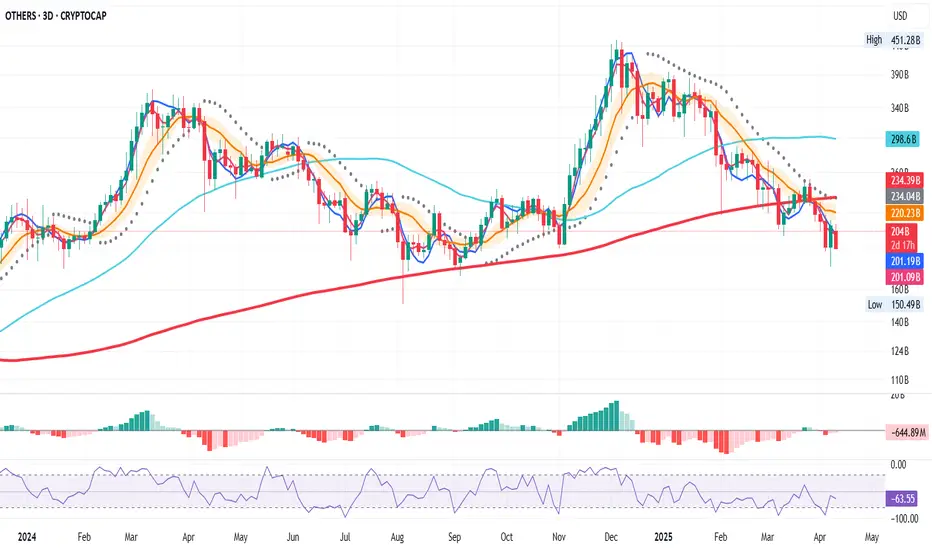
ALTS may be starting an explosive rally.This chart shows the Crypto Total Market Cap (excluding top 10) dominance trading inside a Megaphone pattern that just bottomed. The bearish wave is identical to the first that made a double bottom LL on August 5th and kickstarted an altcoin surge that peaked on December 7th 2024. The first target of this setup is 9.20%.
## If you like our free content follow our profile to get more daily ideas. ##
## Comments and likes are greatly appreciated. ##
FLUX About to Explode or Break Your Portfolio? Yello Paradisers — are you ready for the next breakout play, or are you blindly walking into a trap? FLUXUSDT is showing signs of a major decision point, and it could catch most traders off guard if they're not prepared. Here's exactly how we're planning it.
💎#FLUXUSD is currently trading within a wedge formation, and we're seeing a high probability of an upside breakout, especially if price is able to surpass the key resistance at $0.2291. In such a case, the next magnet is the internal supply zone at $0.2650 this is where we’ll start monitoring for potential trade setups.
💎This internal supply is a critical reaction zone. If price respects it and starts pulling back, we expect a retracement toward the support level at $0.1646. The high time frame structure remains bearish, which adds more weight to this retracement scenario being likely after tagging the internal supply.
💎Also, Flux is trading below both the 50 EMA and 200 EMA, confirming broader weakness in trend structure and making any short-term breakout more of a reactive move inside the macro bearish bias.If price doesn’t reject at the internal supply zone and breaks through it cleanly, we’ll be looking for a strong reversal from the Ultra TF supply zone at $0.3115. That’s the higher level of confluence we trust more in the bigger picture.
💎At this level, we’ll wait patiently as always and look for clear bearish reversal patterns like an Evening Star or a Shooting Star. Only a confirmed breakout above $0.3115 would change the game entirely by shifting the overall market structure and invalidating this current bearish setup.
Stay focused, Paradisers. Be the hunter, not the hunted.
MyCryptoParadise
iFeel the success🌴

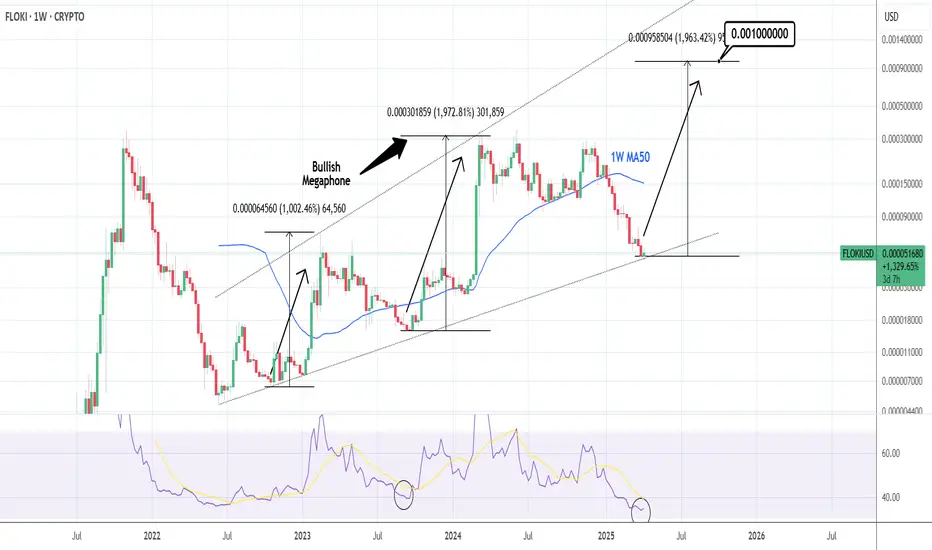
FLOKIUSD: The buy opportunity of the year.FLOKI is bearish on its 1W technical outlook (RSI = 34.609, MACD = 0.000, ADX = 19.895) hitting this week the bottom of the 3 year Bullish Megaphone. The 1W RSI is posting a sequence similar to the previous bottom on September 11th 2023. Technically a rally of identical proportions should begin to price the Cycle Top. TP = 0.0010.
## If you like our free content follow our profile to get more daily ideas. ##
## Comments and likes are greatly appreciated. ##
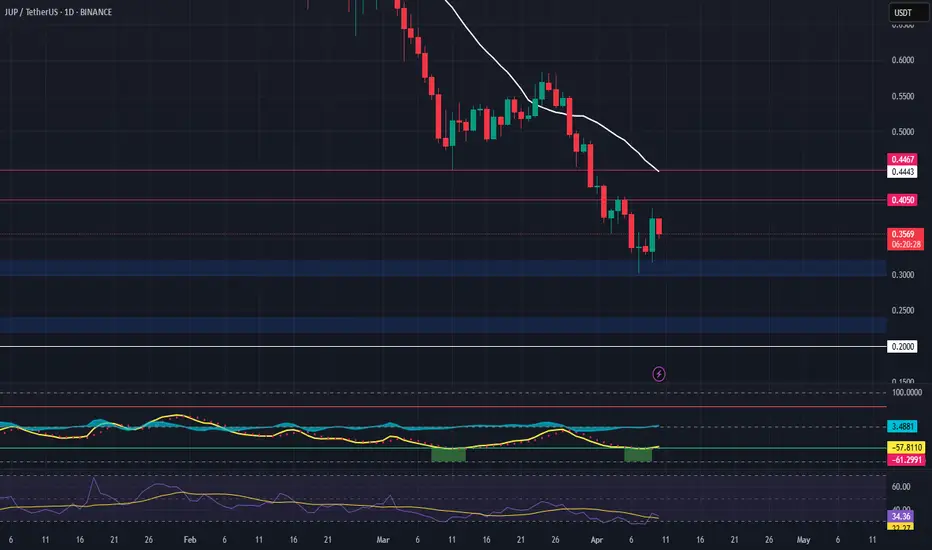
JUP Long Spot Trade Setup – Oversold and Approaching Key SupportJUP is showing strong signs of oversold conditions and is now approaching a major support zone ($0.22 – $0.30). This area offers a favorable risk-to-reward opportunity for a bounce if buyers step in.
📌 Trade Setup:
Entry Zone: $0.22 – $0.30
Take Profit Targets:
🥇 $0.4050
🥈 $0.4467
Stop Loss: Just below $0.20
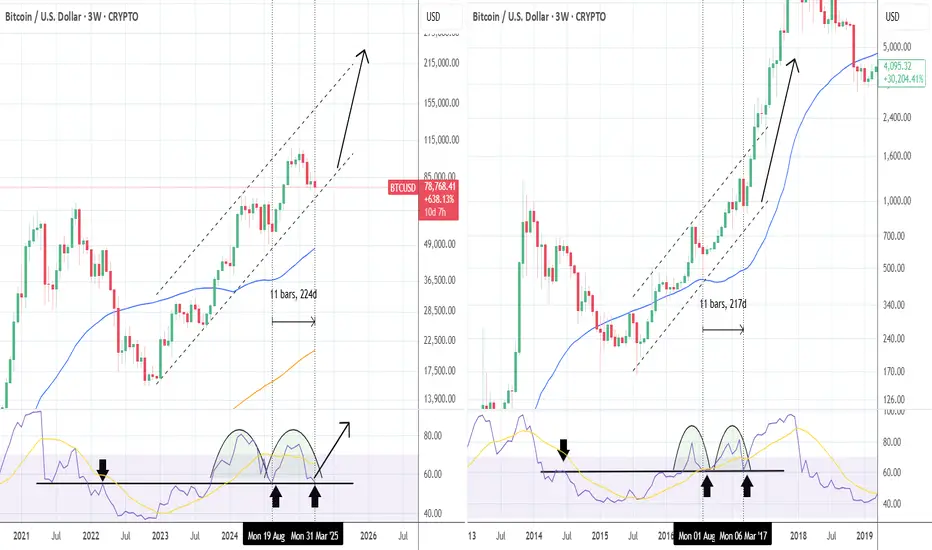
BTCUSD: We haven't seen the real Bull yet.Bitcoin is under heavy volatility and yesterday's gains from the moment of the tariff pause announcement are almost all wiped out, which is reflected on its 1D technical outlook which turned bearish (RSI = 42.714, MACD = -1766.300, ADX = 26.356). Nonetheless, it is still holding its 1W MA50, the key support of this Bull Cycle, which might have not shown its strongest rally yet.
And the reason is a pure look at the 2015-2017 Bull Cycle, which is on a similar Channel Up and 3W RSI pattern. 11 weeks between the Channel's last two corrections, same level with the RSI bottoms. This indicates that this April could be similar to April 2017 that started the strongest rally of the Cycle.
## If you like our free content follow our profile to get more daily ideas. ##
## Comments and likes are greatly appreciated. ##
Ethereum Failing against BITCION ? Here is a valid reason why.
In a world being thrown upside down and sideways and Markets Rising and falling and Rising again on a few words and actions, there is one Shining Light in the world of Crypto
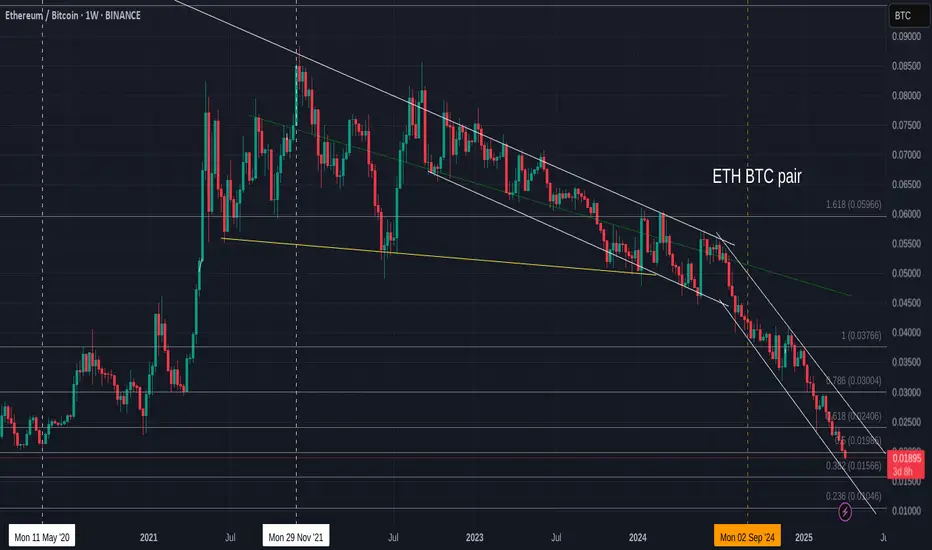
Ethereum - And its constant DROP when compared to BITCOIN
It is possibly the Only coin in the top 10 that has failed to rally at least once, to any significant degree since 2023, when nearly everything else took off.
It currently sits at the same price it was in May 2020 !
It reached its ATH in Nov 2021 and ever since then, has fallen in what is becoming a parabolic reverse curve;
All this despite coins like BASE, Coinbases Crypto, being based on that ETH Layer.
This is pretty well ALL down to the adoption of BITCOIN by corporate ventures, keeping the Bitcoin Dominance high.
I mentioned in a post back in 2023 ( maybe here but certainly on X) how BTC could be used in the "Financial Wars" to come, as a means to weaken and scupper ALT coins.
They tried to Destroy crypto, they failed and so, by allowing Bitcoin ETF's etc, BTC dominance remains High and ALTS Fail
And that is EXACTLY what we have seen so far. As Corporations continue to Buy Bitcoin, Dominance remains high..... It isd as simple as that.
And this ETH BTC chart shows that very clearly.
The REAL question is why the ETH ETF's failed so much.
Maybe that is because MANY people realised the "energy behind Ethereum" - The American crypto , Protected by Gensler and predecessors. The Not really Descentralised structure and power if you hoold a LOT, something not many independants can do
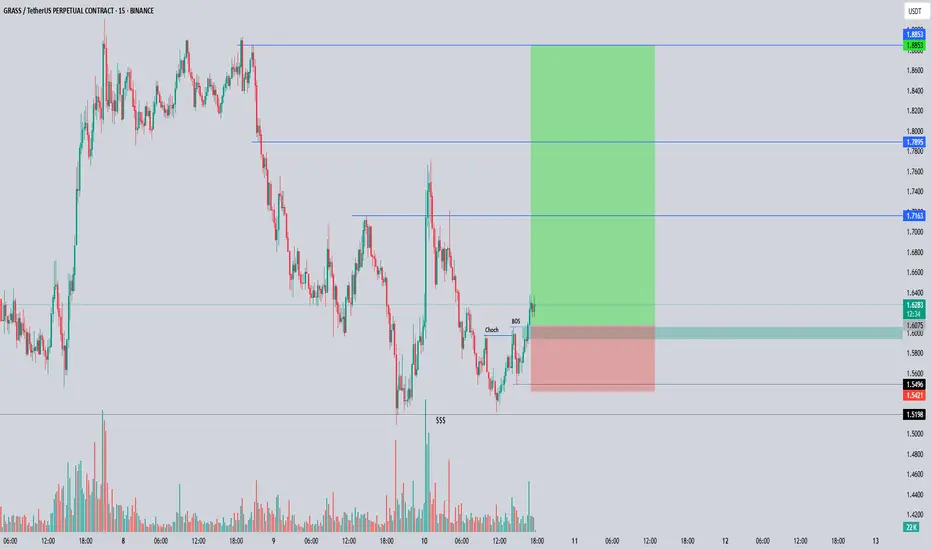
GRASS/USDT –Trend Confirmation & Profit Target StrategyTrading Setup: GRASS/USDT Perpetual Contract
Entry Point: $1.61
Stop Loss: $1.5198
Take Profit Targets:
TP1: $1.7163
TP2: $1.7895
TP3: $1.8853
Strategy Overview
Trend Confirmation: Monitor price action for Break of Structure (BOS) or Change of Character (ChoCH) for entry validation.
Risk Management: Position size adjusted to maintain optimal risk-to-reward ratio..
This setup ensures a structured trade approach while managing risk efficiently. If you need refinements or additional indicators, let me know!
TRXUSDT Eyes Breakout Amid Bullish StructureThe TRXUSDT market appears to be forming an ABC extension pattern, characterized by a series of higher lows, while the highs remain relatively flat. The price has been consistently testing the 0.2400 resistance area, indicating the possibility of a breakout and a sustained move above this level. Recently, the price surpassed the previous week's high, which may signal either a short-term pullback or continued upward momentum. A retest of the support zone is anticipated before the market potentially resumes its upward trend. The next key resistance level is projected around the 0.2500 mark

The Most Overlooked Setup in Trading: Your Own Decision ProcessTrading psychology at its finest — where the real edge begins.
Over time, I’ve realized that most traders obsess over systems, setups, and signals... but very few ever stop to ask: “How do I actually make decisions?”🧩
The truth is — every trade I take is a result of an internal process. Not just some rule from a strategy, but a sequence of thoughts, comparisons, and feelings I go through (sometimes without even realizing it). And when I mapped it out, it changed the way I approached the market. 🔄
Here’s what I found:
1.There’s always a trigger.
Sometimes it’s a chart pattern. Other times, it’s a shift in sentiment or an alert I’ve set. But that moment when I *start* to consider entering — that’s the spark. Recognizing that moment is the first step. ⚡
2.Then comes the operation phase.
That’s when I begin scanning. I look for setups, patterns, confluences — not just at face value, but through the lens of my experience. I start running mental “what-if” simulations, visualizing what the trade could become. 🔍
3.The test phase is critical.
This is where I mentally compare the current opportunity with past winners or losers. Does it “look right”? Does it “feel like” a good trade? That moment where a setup clicks isn’t just about indicators — it’s about internal alignment. 🧠
4.Exit isn’t just a price level — it’s a decision threshold.
Knowing when to act (or not) often comes down to a shift in internal state. For me, it’s usually a combination of visual confirmation + a gut signal. When both align, I act. 🎯
📌 Why does this matter?
Because most failed trades aren’t just “bad signals” — they’re *poorly made decisions*. If I don’t understand my internal process, I’m flying blind. But when I do, I can refine it, track it, and improve it.
If you’ve never mapped out your decision-making strategy, do it. You’ll learn more about your trading than any indicator could ever teach you. 💡
👉 Keep following me for decision-making insights and real trading psychology facts — the stuff that actually moves the needle.
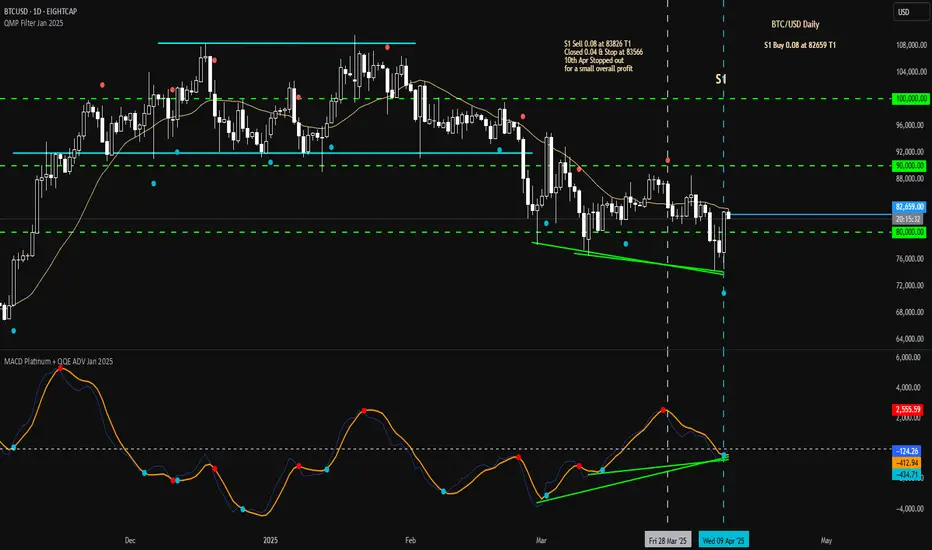
Thu 10th Apr 2025 BTC/USD Daily Forex Chart Buy SetupGood morning fellow traders. On my Daily Forex charts using the High Probability & Divergence trading methods from my books, I have identified a new trade setup this morning. As usual, you can read my notes on the chart for my thoughts on this setup. The trade being a BTC/USD Buy. Enjoy the day all. Cheers. Jim
BTCUSD: Attacking the 2025 Resistance looking for huge breakout!Bitcoin turned neutral on both its 1D (RSI = 47.243, MACD = -1813.400, ADX = 31.557) and 1W (RSI = 45.530) technical outlooks following the 90-day tariff pause. Technically it is going after the LH top of the Falling Wedge from its ATH and the 1D MA50, which has been the main Resistance since February 4th 2025. There is a key Bullish Divergence on the 1D RSI too, being on HL as opposed to the LL of the Falling Wedge. A breakout above the Wedge typically sets a technical target on the 2.0 Fibonacci extension, which falls just under the ATH Resistance Zone. Be ready to go long if the breakout takes place (TP = 106,000).
## If you like our free content follow our profile to get more daily ideas. ##
## Comments and likes are greatly appreciated. ##
