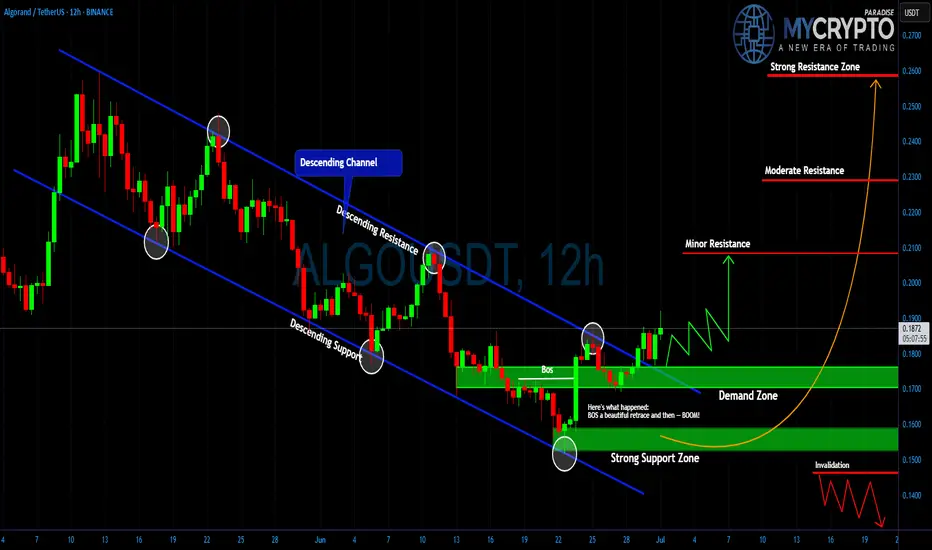
ALGO: Surprise Rally Ahead?Yello Paradisers, did you spot that breakout from the descending channel in time or are you still waiting for confirmation that already happened?
💎#ALGO/USDT has officially broken out of its multi-week descending channel after a textbook Break of Structure (BoS). Price action gave us a beautiful retrace into the demand zone, and from there boom momentum began shifting. This move is now showing early signs of bullish continuation, but as always, the majority will only realize it once the big move is already done.
💎#ALGO had been trading within a clearly defined descending channel, with price reacting precisely between the descending resistance and descending support lines. The breakout occurred after a strong candle pierced the descending resistance, and more importantly, we got a BoS followed by a clean retest of the demand zone around $0.165–$0.175. That reaction was sharp and decisive, indicating strong interest from buyers stepping in.
💎As of now, it is trading near $0.186 and forming higher lows, which supports the idea of an ongoing trend reversal. The structure has changed, and bulls are slowly regaining control. If price sustains above $0.190, the doors open for further upside. The first key level that could slow momentum is minor resistance near $0.210. If that level breaks with volume, moderate resistance around $0.230 becomes the next critical zone. Above that, the major target sits at $0.260, a strong resistance area where a lot of liquidity could be triggered.
💎On the flip side, the strong support zone between $0.145 and $0.155 remains our invalidation area. If price drops below this range, the bullish setup collapses, and we reassess the entire structure. But unless that happens, the bias remains cautiously bullish.
Trade Smart. Stay Patient. Be Consistent.
MyCryptoParadise
iFeel the success🌴
Cryptotrading
PENGU still has room!?If you find this information inspiring/helpful, please consider a boost and follow! Any questions or comments, please leave a comment!
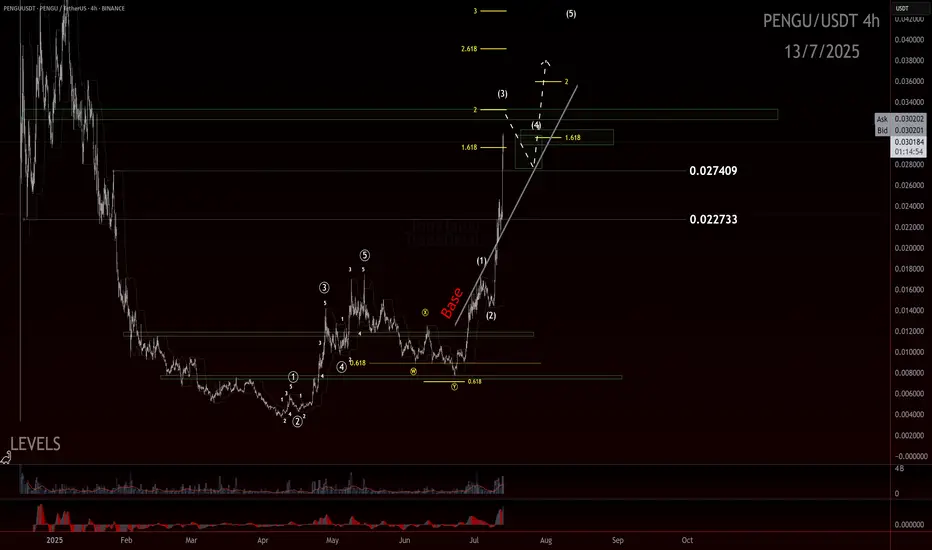
The move off the low looked like a clean, completed impulse—sharp, decisive, and well-structured. After that, we got a double zigzag retracement. It ran a bit deeper than the textbook version, but still landed right in the normal range you’d expect for a healthy correction. From there, we saw another smaller-degree impulse form off the .007 pivot, suggesting bullish momentum was building again.
Since the last update, PENGU has come a long way—more than doubling in price and now hovering around a most likely target for a wave 3. What’s notable is how it got there: not just by breaking above the 0.017 resistance, but by blowing through multiple base channels on solid momentum and healthy volume.
We didn’t get the ideal depth for a retrace for a wave 2 before that breakout, but that doesn’t disqualify the larger count. In fact, from an Elliott Wave perspective, I still believe we haven’t seen a proper wave 4 to balance out the earlier wave (2). So I’m holding off on calling a top to this wave 3 just yet.
Here’s what we’re watching closely now:
The secondary impulse off .007 continues to build structure
Ideally, the next pullback holds above the 0.027 or .022 region, signaling respect for previous support and AOIs
That pullback needs to unfold correctively, not impulsively, to confirm bullish continuation
The next trade setup I’m eyeing is that wave 4 into wave 5 move. I’ll be stalking this ticker closely as structure unfolds.
Trade safe.
Trade clarity.
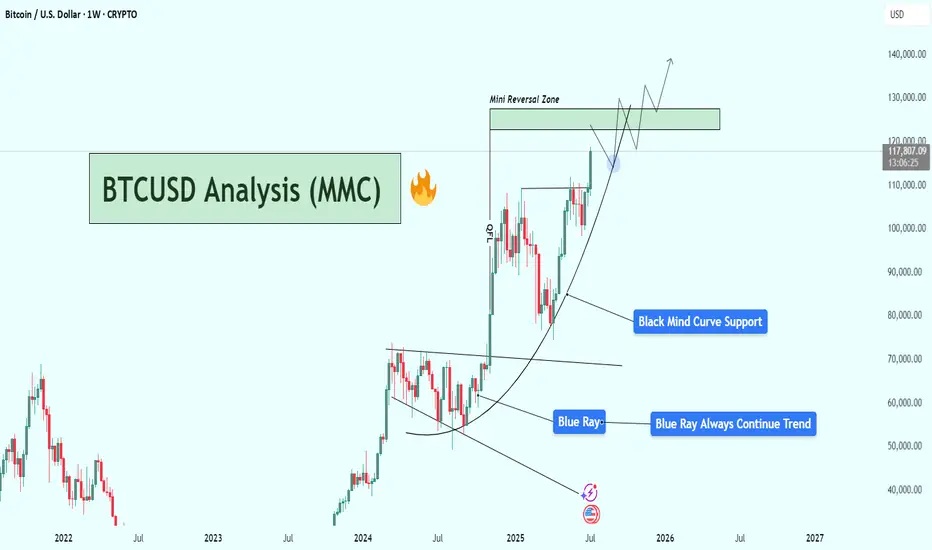
BTCUSD Weekly Analysis : Testing $130K Resistance + Next Target📌 1. Big Picture – Bitcoin is in a Parabolic Uptrend
This chart clearly shows that Bitcoin has shifted from a consolidation phase into a full-blown parabolic rally. That’s not just random growth — it’s an aggressive, momentum-driven market move that usually only happens during major bull cycles.
The curve shown in black — labeled “Black Mind Curve Support” — is your guide here. It's not a simple trendline. It shows how Bitcoin is accelerating upward, and this curve acts as a dynamic support. Every time price dips to it, buyers jump in fast — which shows strong bullish pressure and market confidence.
🔍 2. Blue Ray Broken = Trend Change Confirmed
Earlier, BTC was stuck under the Blue Ray, a long-term resistance trendline. As marked:
“Blue Ray Always Continue Trend”
That means, as long as price stays under it, the market is bearish. But guess what?
BTC broke above it — strongly.
That break confirmed a reversal in long-term structure, and it triggered this massive upward move. This breakout also aligned with a pattern of higher highs and higher lows, further confirming that bulls are now in full control.
🧠 3. Current Situation – Heading Into Mini Reversal Zone
Now BTC is trading around $117,820, and it's approaching the green box labeled Mini Reversal Zone — between $125,000 and $135,000.
Why is this area important?
It’s a psychological zone (big round numbers).
It lines up with historical resistance and previous supply zones.
It’s where smart money might take some profit, so we could see rejection or a short-term pullback here.
🎯 4. Two Scenarios to Watch
✅ Scenario A: Mini Pullback & Retest
BTC hits the Mini Reversal Zone → stalls → pulls back → retests the Black Mind Curve → bounces again.
That’s bullish and normal in a healthy uptrend. If you missed earlier entries, this pullback could be your golden opportunity.
🚀 Scenario B: Breakout of Reversal Zone
If Bitcoin breaks above $135K with strong momentum and closes the weekly candle high, we may see another parabolic rally toward $140K+.
This would mean even stronger buyer interest, possibly driven by FOMO, ETFs, or macro news.
📉 What Could Invalidate the Bullish Move?
Only if BTC:
Breaks below the Black Mind Curve, and
Starts closing weekly candles under $105K–$100K
That would mean the curve is broken, momentum is lost, and we might go into a consolidation or deeper correction.
But for now? No signs of weakness. Trend is strong, volume is rising, and price action is clean.
🧩 Summary of Key Levels
Type Level Notes
Curve Support Dynamic ($105K–$110K) Critical for trend continuation
Mini Reversal Zone $125K – $135K Watch for rejection or breakout
Bullish Target $140K+ If breakout holds above reversal zone
Trend Indicator Black Mind Curve As long as price rides this, bulls are in control
📌 Final Thoughts
This BTC chart isn’t just a random uptrend — it’s a well-structured parabola, powered by strong technical support and clean breakouts. Everything is lining up for a potential monster move, but don’t chase price blindly.
Watch the Mini Reversal Zone closely. If we see rejection, be ready to buy the dip. If we break through with volume — it’s 🚀 time again.
BTC.D Slipping ! ALTSEASON Loading ? This is BTC.D on the daily chart.
It has shown a strong relationship with the 50MA (blue/cyan line), often using it as support. While there were a couple of daily closes below it in the past, they lasted only 1 or 2 candles.
Now we’ve seen 4 consecutive daily closes below the 50MA (including today), which increases the likelihood of a deeper move to search for support.
The next key support zone (green rectangle) is defined by the 200MA (red line) and the 62.25% level (black line) — both of which acted as support before.
If BTC.D drops into that zone, ETH and altcoins could experience a strong bounce.
Always take profits and manage risk.
Interaction is welcome.

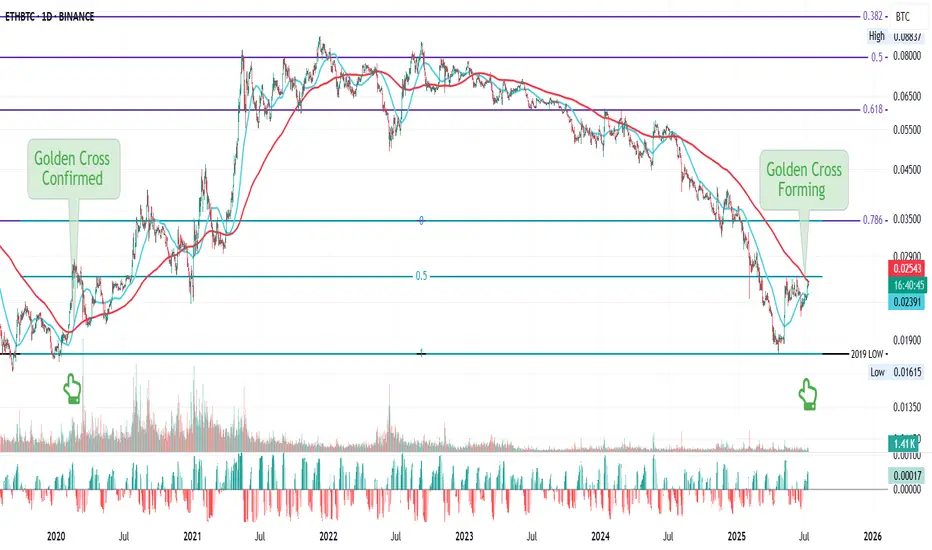
ETH/BTC: Golden Cross Reloaded?This is ETH/BTC on the daily chart.
A major event is about to unfold: the golden cross, where the 50MA crosses above the 200MA.
The last time this happened was in early 2020, around the same price zone, right after a bounce off the 2019 low double bottom and a rejection from the 0.5 Fib level, which sits halfway between the 2019 low and the 0.786 Fib.
In 2025, we’re seeing a strikingly similar pattern:
– Price bounced off the 2019 low
– Got rejected again from the 0.5 level
– And now appears to be gathering strength to flip that level and the 200MA to confirm the Golden Cross
Always take profits and manage risk.
Interaction is welcome.
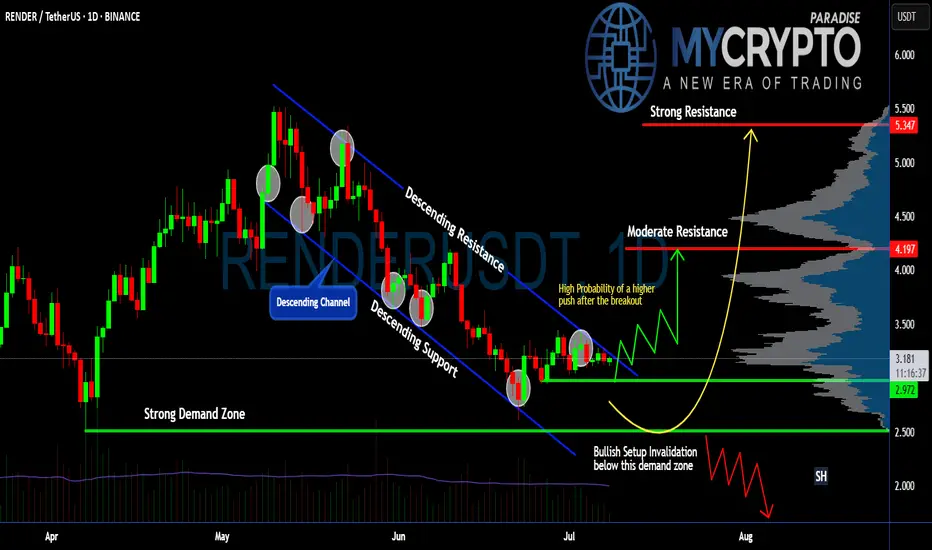
Is #RENDER Ready for a Reversal or Will it Continue to Fall?Yello, Paradisers! Is this just another range before a full reversal or a sneaky trap waiting to punish early buyers of #RENDER? Let's see the latest analysis of #RENDERUSDT:
💎After several weeks of slowly bleeding within a clean descending channel, #RENDERUSDT is now attempting a breakout from that structure. While the move isn’t confirmed just yet, this is the first real signal that sellers are losing momentum, and a shift could be on the table. Price is currently hovering just above the $3.15–$3.20 zone, and the next few candles will be key.
💎If buyers step up and push #RENDER through this upper trendline with strength, we have a clear runway toward the moderate resistance at $4.20. And if that gets taken out, the next strong resistance area comes in at $5.35, where we expect heavy distribution. But for now, it’s all about reclaiming and holding above this descending structure.
💎So what gives this setup real potential? The demand zone at $2.97 held like a fortress. If it fails, the next line of defense is a strong demand zone at $2.50. Buyers defended it multiple times and sparked a mini-reversal off the bottom of the channel. This demand zone is our launchpad, and as long as the price stays above it, bulls are still in control.
💎But make no mistake: if price loses $2.97, the bullish setup is invalidated. That would open up a deeper drop back toward $2.50 or lower, and we’ll step aside to wait for a better entry again.
Stay patient, Paradisers. Let the breakout confirm, and only then do we strike with conviction.
MyCryptoParadise
iFeel the success🌴
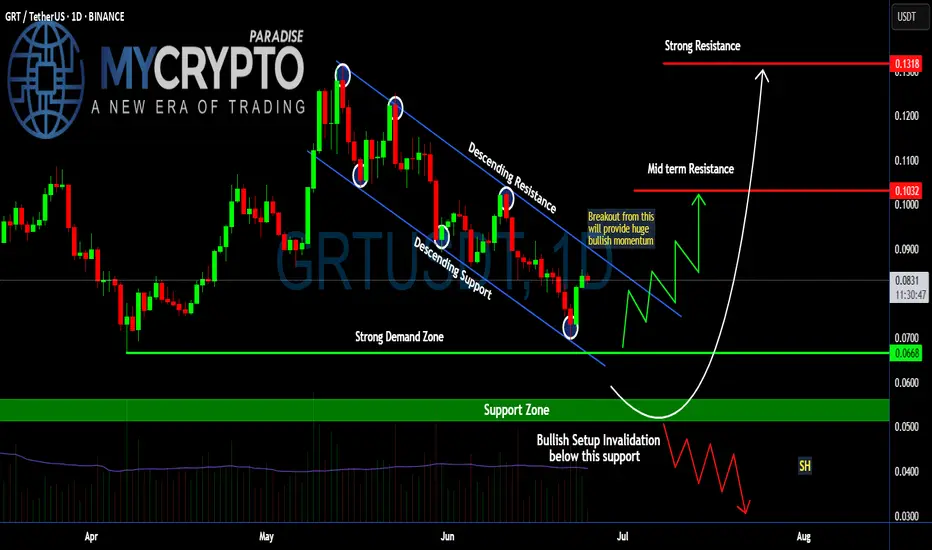
Is a Breakout Imminent for #GRT or Another Bull Trap is Ahead?Yello, Paradisers! Are we looking at a clean breakout setup that could send #GRT flying or is this the perfect trap to wipe out early bulls? Let's see the latest #GRTUSDT moves:
💎The daily chart on #GRTUSD is showing a perfectly formed descending channel, with price now hovering just above the lower boundary—a zone that has consistently held as strong descending support. After multiple rejections from the upper boundary and rebounds off the lower trendline, the price has now shown its first serious signs of momentum since bottoming in the strong demand zone
💎This structure has been in play since early May for #TheGraph, with each bounce from the support line giving temporary relief, only for the price to get slapped down at the descending resistance. But this most recent bounce looks different—it’s happening directly above a well-defined demand zone between $0.0668–$0.0700, a level that has historically attracted strong buyer interest.
💎A breakout above the descending resistance trendline, ideally with a strong daily close above $0.085–$0.090, would invalidate the bearish pressure and likely trigger a sharp leg up. The mid-term resistance sits around $0.1032, and clearing that would open the door to a retest of $0.1318, a level that previously acted as a strong rejection zone.
💎If the price fails to reclaim the descending channel and rolls over again, especially losing $0.0668 on a daily close, the bullish structure would be invalidated. That would shift focus toward the support zone at $0.053, and if that breaks, the next target becomes $0.0300—a brutal drop that would liquidate most late longs and signal deeper downside.
Stay disciplined. The next big opportunity will come to those who wait, not those who chase.
MyCryptoParadise
iFeel the success🌴
BTC/USDT : Breaks Out – New Highs In Sight After Smashing $111K!By analyzing the Bitcoin (BTC) chart on the weekly timeframe, we can see that the price has finally started to rally as expected—successfully hitting the $111,700 target and even printing a new high at $111,999 with an impressive pump.
This analysis remains valid, and we should expect new all-time highs soon.
The next bullish targets are $124,000 and $131,800.
THE WEEKLY TF ANALYSIS :

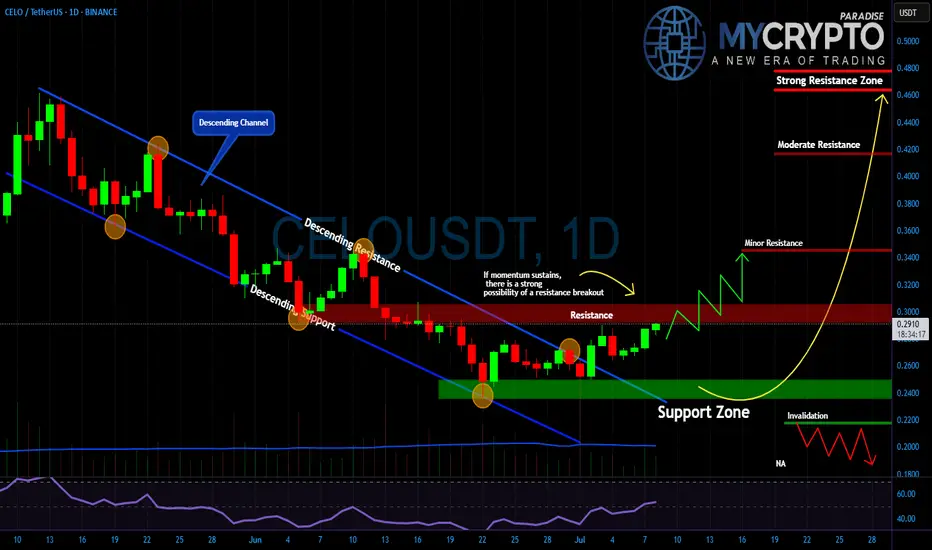
CELO About to Explode or Fakeout Incoming?Yello, Paradisers! Is this the breakout we’ve been patiently waiting for or just another trap to liquidate late buyers?
💎After weeks of grinding lower inside a clear descending channel, #CELO/USDT has finally broken out to the upside. That breakout alone isn’t enough, but it’s a critical first signal that sellers are losing control. Price is now pushing right into the key resistance zone at $0.29–$0.30, and what happens here will decide the next major move.
💎If momentum holds and price reclaims this level with conviction, we could see an explosive move toward $0.34 and potentially even the stronger resistance zones at $0.41 and $0.47 in the coming weeks. But if buyers fail to defend this push, and price rolls over, then the bullish setup quickly falls apart.
💎What gives us more confidence? The support zone at $0.24–$0.25 held beautifully buyers stepped in hard, and the market reversed cleanly from there. But if #CELO drops back below $0.22, the setup is invalidated and we'll wait patiently again for the next high-probability entry.
This is where most retail traders get trapped, they chase the move too late or panic-sell too early. Don’t be that trader. Stay focused. Be precise.
MyCryptoParadise
iFeel the success🌴
KSMUSDT D – Start of Wave 3? After a clear 5-wave impulsive move up, KSMUSDT seems to have completed a deep ABC correction, potentially marking the end of Wave 2.
📉 Wave 1: We had a clean five-wave move from the bottom, which fits classic Elliott Wave structure.
📉 Wave 2: The correction that followed was much deeper than the ideal Fibonacci retracement zone. However, crucially, it never violated the low of Wave 1, which means it still holds valid under Elliott Wave rules. The correction unfolded as a textbook ABC pattern, with Wave C digging deep into the previous structure — showing panic selloff and possibly a final capitulation.
🔄 Key Development Now:
The resistance trendline of the correction has just been broken, suggesting potential momentum shift. This could mark the beginning of Wave 3, which is typically the strongest and most impulsive wave in Elliott Wave theory.
📈 Potential Target for Wave 3: Around the 39.5.80–42.00 area based on Fibonacci projections, but this is an early assumption and requires confirmation by price action and volume.
⚠️ Important Risk Note:
Despite this bullish technical setup, the current market remains risky. The bounce is fresh, and confirmation is still lacking. There's still the possibility of a deeper retest or invalidation of this count if price closes below the base of Wave 1.
🧠 Trade Plan:
- Wait for follow-through confirmation.
- Manage risk carefully — this is an early entry scenario.
- A stop below the recent low (~11.30) would be logical for this wave count.
📊 What do you think? Is this the beginning of a powerful Wave 3, or just another fakeout?
💬 Drop your thoughts or alternate wave counts in the comments!

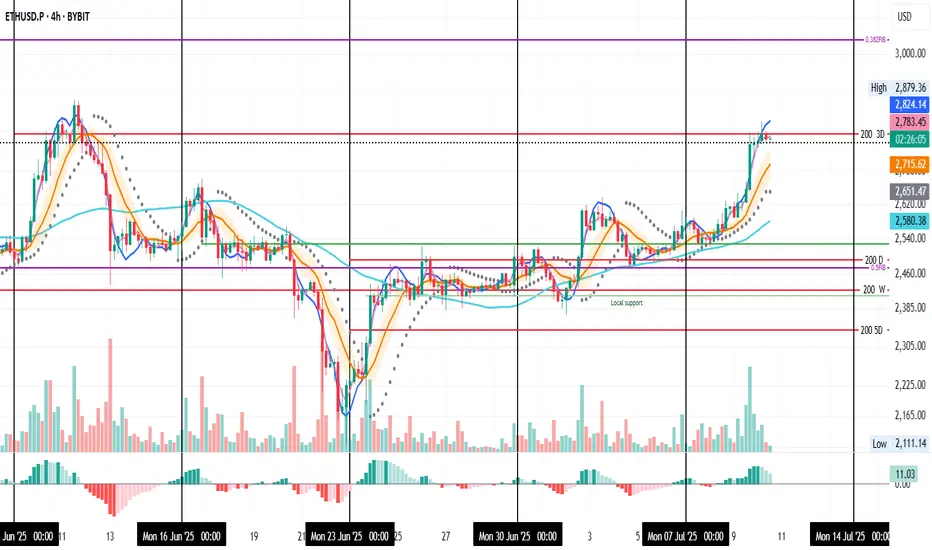
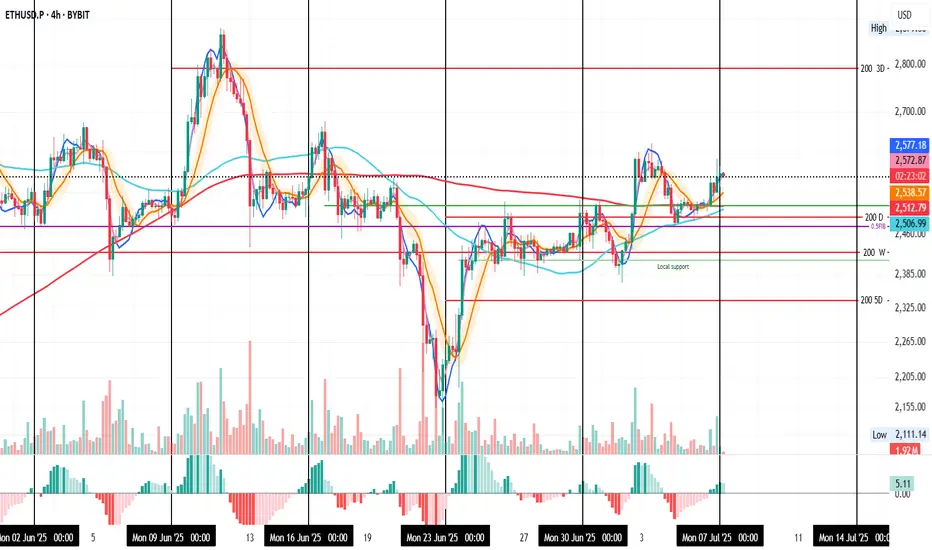
ETH Not Taking Profits Yet – System Still Long
ETH on the 4H is pausing right at the 3D 200MA, picture perfect, actually.
Now we wait to see if this resistance flips into support.
If that happens, price could go for the 0.382 Fib level around $3,040.
Of course, that’s the ideal scenario, but the market could easily contradict me, so keep that in mind.
Personally, it’s not time to take profits yet.
Both my 4H and 1D systems are still in long positions.
For extra safety, you could set a partial take-profit just under the second-to-last PSAR dot.
Always take profits and manage risk.
Interaction is welcome.
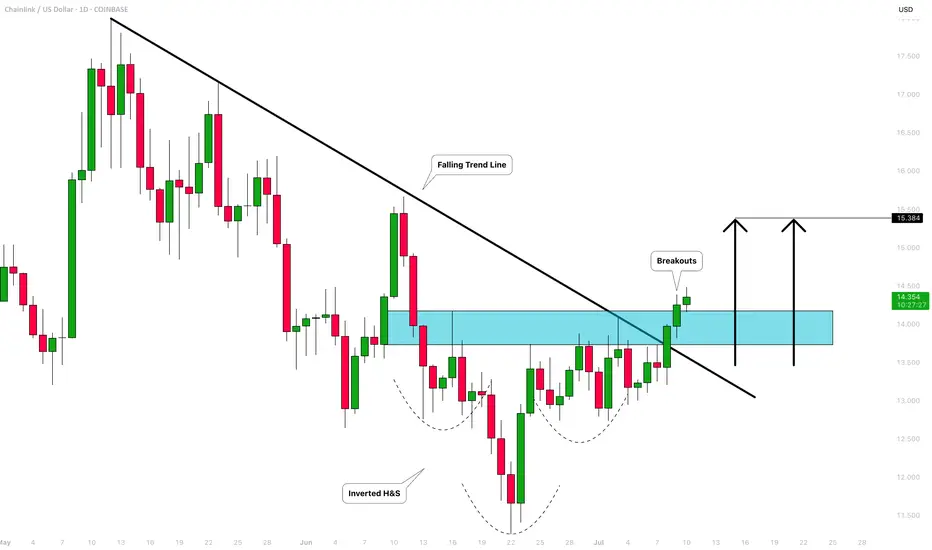
CHAINLINK (LINKUSD): Very Bullish Outlook
I see 2 strong bullish confirmations on LinkUSD on a daily time frame.
The price violated 2 significant structures: a vertical falling resistance - a trend line
and a neckline of an inverted head & shoulders pattern.
With a high probability, the market will rise more.
Next resistance - 15.38
❤️Please, support my work with like, thank you!❤️
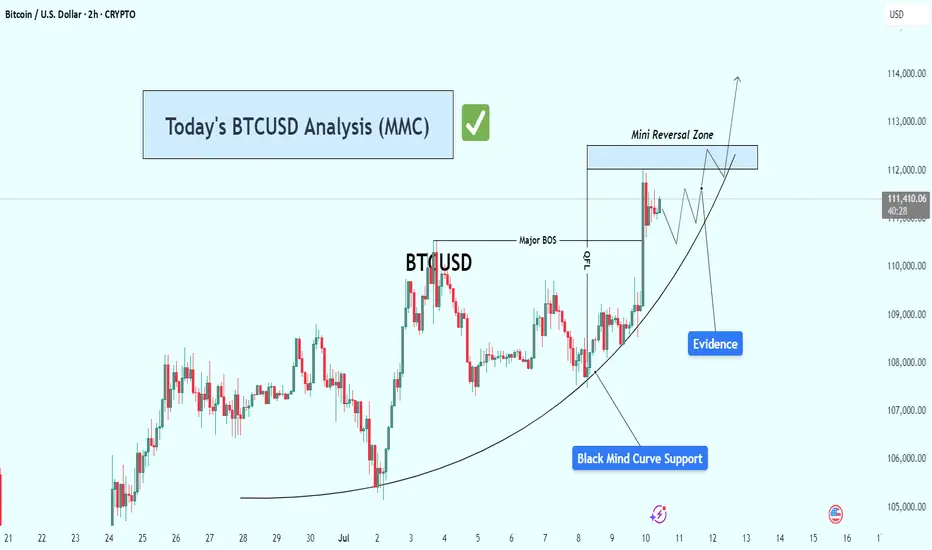
BTCUSD Analysis – Riding the Mind Curve & Bullish Setup Target🔎 Technical Narrative & Market Structure Analysis
Bitcoin is currently respecting a textbook parabolic support structure represented by the Black Mind Curve—a dynamic visual model reflecting the psychology of crowd behavior transitioning from uncertainty to confidence. This curved structure often precedes strong bullish continuation patterns, especially when paired with evidence of smart money involvement.
The current price action shows sequential higher lows, each of which is supported directly by the Mind Curve. These bounces confirm demand stepping in consistently at higher levels, a strong sign of controlled accumulation and momentum building.
🧠 Key Chart Components Explained
✅ 1. Mind Curve (Dynamic Support)
A custom-drawn parabolic curve reflects the ongoing upward force from buyers.
Bitcoin has tested and bounced from this curve multiple times, showing it is respected by market participants.
As price hugs the curve more tightly, the compression could lead to a volatility breakout.
✅ 2. Major BOS (Break of Structure)
A significant market structure break occurred as price took out a previous swing high.
This BOS confirms a shift in market sentiment from ranging/sideways to uptrend formation.
The BOS now acts as a reference point for bullish momentum and could serve as support on a potential retest.
✅ 3. QFL Zone (Quantity following line )
Located just below the BOS, this zone marks the last area where aggressive buyers stepped in before the breakout.
These levels are often defended on a retest and are used by institutional traders to re-enter positions.
✅ 4. Evidence Candle
This sharp bullish impulse candle is what we call an "evidence candle"—it pierces minor resistances with strength and volume.
It represents institutional-level interest and confirms smart money accumulation.
Such candles typically precede either continuation or minor pullback for re-accumulation.
✅ 5. Reversal Zone (Target Zone)
This zone lies ahead at approximately 112,500 to 113,000, a confluence of previous supply, key psychological level, and potential liquidity pool.
It's the next logical area where price may pause, react, or break through if momentum sustains.
⚔️ Scenarios to Watch
🟩 Bullish Scenario:
Price continues riding the curve support upward.
Breaks and closes above the Reversal Zone, ideally with volume and continuation candle.
Potential upside extension toward 114,000–115,000.
🟨 Neutral/Consolidation Scenario:
Price consolidates just below the Reversal Zone.
May form a flag/pennant or triangle structure.
Bullish continuation likely if the curve holds beneath.
🟥 Bearish/Invalidation Scenario:
Price breaks below the Mind Curve and BOS, closing below with momentum.
This would signal a potential breakdown of the bullish structure.
Invalidation zone likely sits below 110,000, and a breakdown could open room to revisit the 108,500–109,000 area.
📌 Confluence Factors Supporting the Bullish Bias:
Respect of Mind Curve over time = hidden institutional support
Presence of BOS and QFL = structure and order block confluence
Evidence candle = high-volume trigger point
Reversal Zone = logical magnet for price, supported by liquidity and previous reactions
📈 Summary & Trading Thesis
Bitcoin is currently in a bullish microstructure within a larger range. The parabola-style Mind Curve suggests that this structure is maturing toward an inflection point. The break above BOS, evidence of strength, and alignment with demand zones all support a move toward the 112,500–113,000 Reversal Zone. If momentum sustains, this could become the start of a broader bullish leg.
📢 Final Thought:
While the setup is bullish, discipline and patience are key. Watching how price behaves around the Reversal Zone will be critical. A clean breakout or solid rejection will provide the next high-probability signal.
There’s a higher probability of an upward breakout.🚨 Bitcoin Technical Update – Key Levels Ahead! 🚨
Bitcoin is currently forming a symmetrical triangle pattern, a classic setup that often signals a strong move ahead. At the moment, the market is leaning toward the upside, showing early signs of bullish momentum.
📈 If we see a breakout to the upside, it's crucial to wait for a retest of the breakout level. A successful retest could confirm the move, setting the stage for a strong upward rally. However, if the breakout fails, don’t rush in — just observe the price action closely to see how the market reacts.
⚖️ There’s a higher probability of an upward breakout, as liquidity is still building above, and there are strong support levels holding below. This combination could act as a springboard for price to move higher.
🔍 As always, Do Your Own Research (DYOR) before entering any trade. Stay alert and manage your risk wisely!

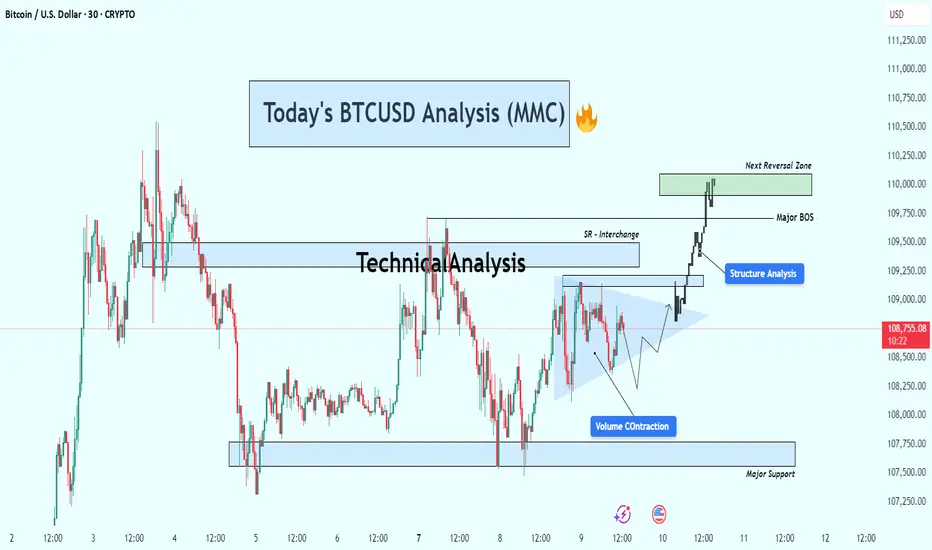
BTCUSD Breakout Confirmed – Targeting Next Reversal ZoneBitcoin (BTC/USD) is currently trading around $108,700, showing strong bullish momentum after breaking out of a consolidation structure. Price action has shifted significantly, with clear structural developments pointing toward continued upside — but not without caution around the next reversal zone.
🔍 Key Technical Insights:
🔹 1. Volume Contraction Triangle (Bullish Breakout)
The chart initially shows a volume contraction pattern forming a symmetrical triangle.
This pattern is often associated with market compression — a setup where smart money accumulates before a breakout.
BTC broke out of the triangle with strong bullish candles, confirming buyers have stepped in with conviction.
🔄 2. Structure Shift & Break of Structure (BOS)
A major BOS (Break of Structure) occurred as price broke previous swing highs, confirming a bullish market structure.
This BOS zone now acts as a potential support area if BTC pulls back.
A short-term SR interchange zone (Support becomes Resistance) was also respected and flipped again to support during the breakout — a clear sign of structural strength.
🧭 3. Next Reversal Zone – Supply in Sight
Price is approaching a major supply/reversal zone between $109,750 and $110,250.
This zone has previously shown strong selling interest.
Traders should watch for rejection or continuation patterns within this zone — such as bearish divergence, exhaustion candles, or confirmation of resistance.
🛡 4. Major Support Level
Below current price, a major support zone around $107,500–$107,800 remains intact.
This zone has provided a solid base during past consolidations and would be the first area of interest for buyers if a retracement occurs.
📌 Strategy Plan:
🔼 For Bullish Traders:
Those already in the breakout can hold with targets toward $110,000–$110,250.
If not in yet, wait for a retest of BOS/SR zone (~$109,000) for a safer re-entry.
Consider partial take-profits within the green reversal zone.
🔽 For Bearish Traders:
Watch for price exhaustion or a fake breakout in the reversal zone.
Potential short setups could form only if price fails to hold above the BOS zone and prints a lower high.
🔧 Technical Summary:
✅ Structure: Bullish Break of Structure confirmed
🔺 Momentum: Strong upside following volume contraction
📍 Next Key Resistance: $110,000–$110,250
📉 Major Support: $107,500–$107,800
⚠️ Caution Zone: Reversal area ahead – watch price action closely
Conclusion :
Bitcoin looks set to challenge the $110K psychological level as buyers remain in control. However, the reversal zone above is critical. A clean break and hold above it could open doors to further highs, while rejection here may trigger short-term pullbacks or range-bound conditions.
TIA Coin: Unlock 118% Profit Potential (1D)From the point where we placed the red arrow on the chart, it appears the TIA correction has begun.
Despite the current bullish market trend, TIA has not yet experienced a pump, and it seems the price hasn't reached its bottom yet. This correction seems to follow a large, time-consuming diamond-shaped diametric pattern, and we are currently in the early or middle stages of wave G.
Recently, the price lost a minor trendline, marked with a red dotted line, indicating that wave G might continue its path.
We have identified a low-risk buy zone on the chart for catching the next bullish wave in TIA. We are targeting buy/long positions in this zone.
Price targets are clearly indicated on the chart.
A daily candle close below the invalidation level will invalidate this analysis and suggest a potential reversal.
invalidation level: 1.089$
For risk management, please don't forget stop loss and capital management
When we reach the first target, save some profit and then change the stop to entry
Comment if you have any questions
Thank You

ETH – Next Stop 3D 200MA?ETH on the 4H closed the week strong after holding support at the 0.5 Fib and 200-day MA.
If price holds here, it could attempt another push toward the 3D 200MA.
Let’s see how the week unfolds on the macro and political fronts.
Always take profits and manage risk.
Interaction is welcome.
From BONK to Boom: Is This a Full Impulse?If you find this information inspiring/helpful, please consider a boost and follow! Any questions or comments, please leave a comment!
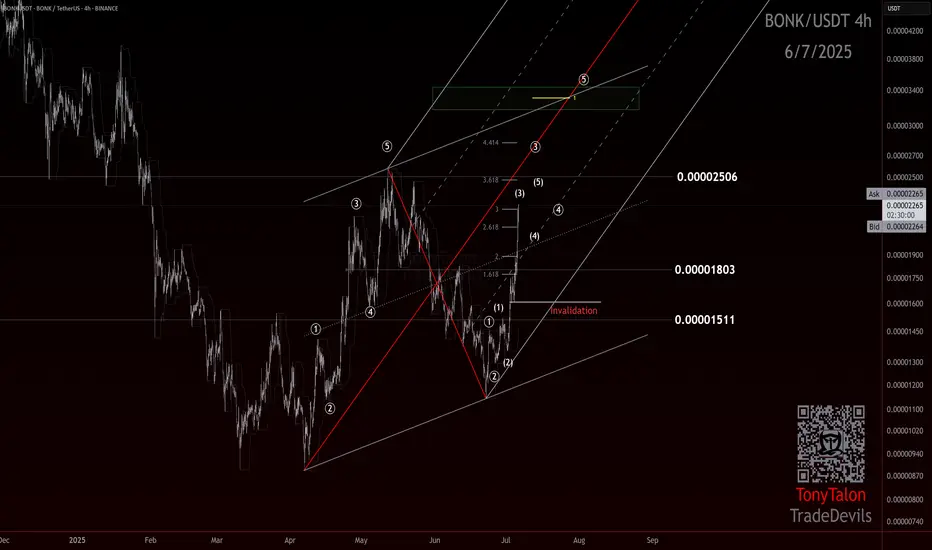
BONK: Watching the Impulse Unfold
Looks like BONK may have bottomed at 887, where it kicked off what appears to be an impulsive move up.
The retrace that followed was suspicious—plenty of ways to count it depending on your lens—but price action eventually started hinting at a 12-12 or zigzag-style crossroad. That indecision resolved quickly once BONK cleared 1511, shifting the structure firmly back into bullish territory.
Now trading around 2242, the behavior is aligning with what you'd expect from a wave 3: strong momentum, vertical lift, and minimal resistance. It’s moving like a third wave should.
That said, there’s some heavy resistance sitting overhead at 2506, and it could stall or even reject price short-term. If it does, the next thing I’ll be watching is how price reacts—specifically looking for a clean wave 4 pullback and a final push into wave 5.
If we see that 4–5 structure play out at multiple degrees, it would go a long way toward confirming this whole move as a completed impulse off the low.
For now, this one stays on watch for the next setup.
Trade Safe!
Trade Clarity!
Something for the weekend? Bitcoin Daily-last for 2 weeks
PA has finally risen above that Fib circle ( falling diagonal arc) that has rejected us since Early June.
PA is currently retesting this as support now and we will hopefully manage to remain above.
Should this fail, we have the lower trendline of the newly formed rising channel to use as support.
Should that fail, we have the 236 Fib circle (Red) and the next rising support line around 102k, depending on sharp the drop is.
If we find support where we are now, we have a good run back to the current ATH line ( Blue Dash line)
The real test is that 236 Fib circle that is dropping form around 114K
99% of the Time, a 236 Fib circle is resistance and if it rejects PA, the Current ATH line is very close below.
This will either create a bounce or a sharp drop. If we get stuck between the 2, we have that APEX around 25 July..PA always reacts BEFORE the Apex
And I am back on the 19th Jully, just in time I hope ;-)
So, The MACD is currently above neutral on the Daily (Below)
The weekly is much the same but on the 4 hour, we are currently dropping towards Neutral and Tomorrow ( sunday) will tell us if it bounces or not.
We are early in July, As mentioned in the monthly report I posted earlier this week, we could see a larger Green candle by month end, though is is not a promise obviously.
But the MACD could support this idea
We just have to wait and, for me, that is what we will do until around Q4
We could still see smaller gains over the summer period but the Bigger moves are in Q4
That is what I am waiting for....and yet, at the same time, I am ready if it comes earlier
stay safe

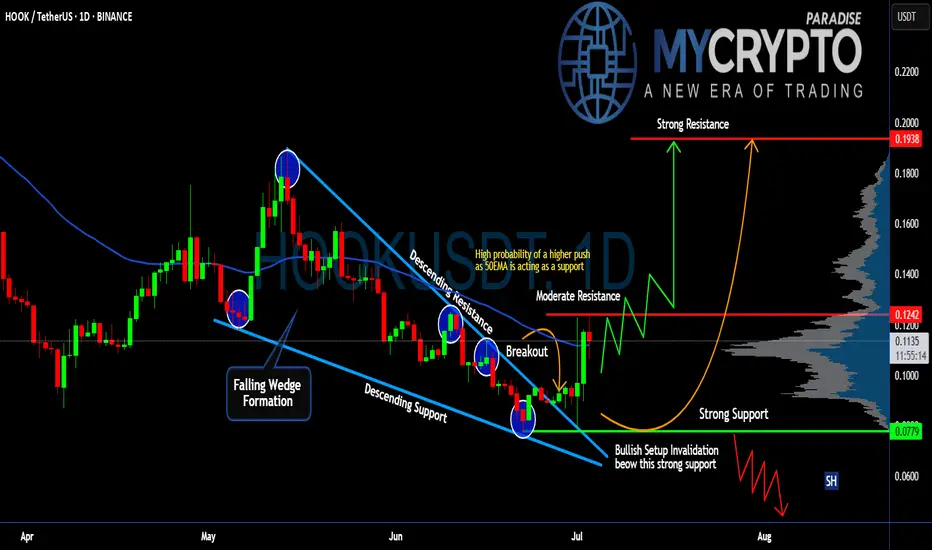
Will #HOOK Continue to Rise or a Trap is Being Set? Must Watch Yello Paradisers! Have you seen the recent price action of the #HookedProtocol or not? Let's see what's happening with #HOOK and its next move:
💎#HOOKUSDT has been moving in a clear falling wedge pattern, with price respecting both the descending resistance and support levels since late April. After multiple rejections from the lows, we finally saw a breakout from the wedge, which is a potential sign that bulls are preparing for a shift in structure.
💎Currently, #HOOKUSD is trading near 0.1120, and the 50EMA is now acting as support, which increases the probability of a continued move higher. The first area we are watching is 0.1242, which now acts as the moderate resistance. If the market manages to hold above this level, it opens up the path toward 0.1938, the next strong resistance, and a level where profit-taking becomes critical.
💎However, if bulls fail to hold the structure and price breaks back below 0.0779, then the entire bullish setup becomes invalid. In that case, we’ll likely revisit the 0.0600 region, and the trapdoor opens for late buyers who ignored the warning signs.
Stay sharp, Paradisers. The market is about to pick a side and we’ll be on the right one.
MyCryptoParadise
iFeel the success🌴
TOTAL2 – Battling MA Resistance
TOTAL2 on the daily found support at the 0.382 Fib level on June 22. Since then, it has been moving upward.
Now it’s fighting the 50MA and 200MA resistance zone.
If this resistance is cleared, the 0.236 Fib level could be the next target.
Always take profits and manage risk.
Interaction is welcome.

BTC.D Daily – Bearish ShiftBTC.D on the daily is turning bearish.
PSAR has flipped bearish, and MLR < SMA < BB center — a clear sign we could see lower levels ahead.
The next possible support is the 50MA.
Always take profits and manage risk.
Interaction is welcome.

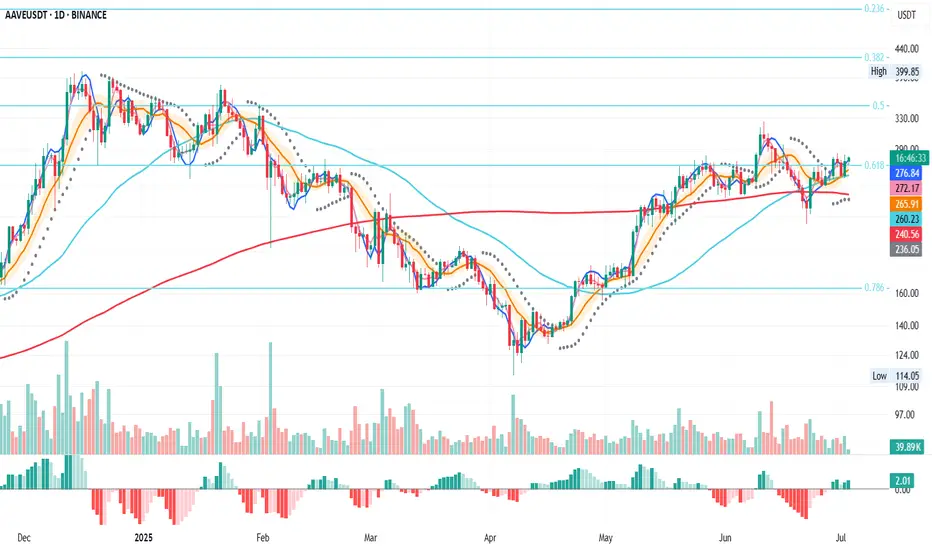
AAVE Daily – 0.618 Fib Reclaimed
AAVE on the daily has reclaimed the 0.618 Fib level after dropping below it and retesting the 200MA.
MLR > SMA > BB center — structure looks constructive.
If price holds this Fib level, there’s a good chance of targeting the 0.5 Fib around $350.
Always take profits and manage risk.
Interaction is welcome.