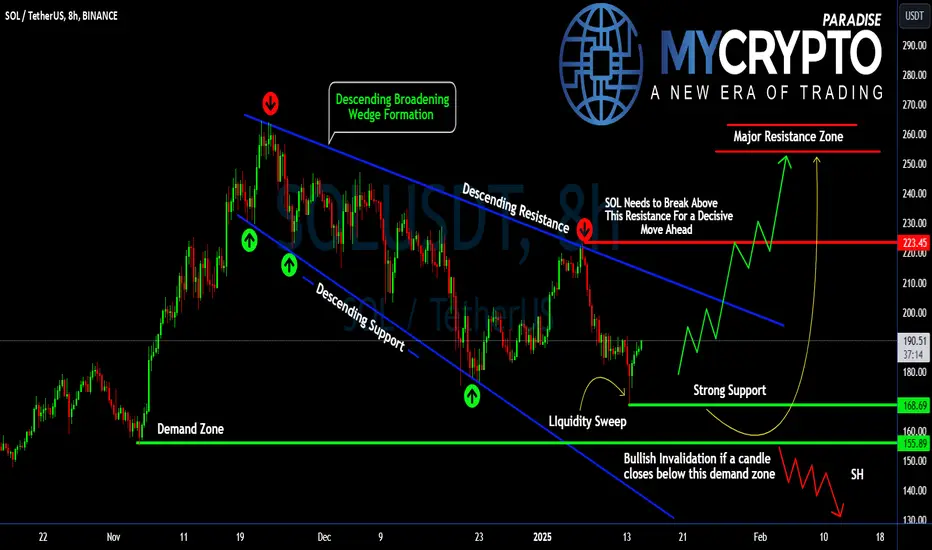
Is #SOL Ready For a Major Pullback or Not? Key Levels to WatchYello, Paradisers! Is #SOLUSDT gearing up for a breakout, or will we see a sharp bearish turn? Let’s analyze the critical levels and what lies ahead for #Solana:
💎#SOL is currently moving within a classic Descending Broadening Wedge—a pattern often associated with significant trend reversals. The price is approaching the descending resistance near $223.45, and a decisive breakout above this level could ignite a strong bullish rally.
💎If #SOLUSD manages to close above $223.45 on the 8H or daily chart, we could see an explosive move toward the next major resistance zone between $250 and $270. These levels could act as key profit-taking zones for bulls, so keep a close watch on trading volume and momentum.
💎On the flip side, #Solana has a strong demand zone around $155.89–$168.69, which has consistently attracted buyers. However, if we see a confirmed break and close below $155.89, the bullish structure would be invalidated, opening the door for a deeper correction toward $130–$140.
💎The recent liquidity sweep at the demand zone shows how the market is shaking out weak hands before a decisive move. Stay patient and wait for confirmation at these key levels before entering a trade.
Stay focused, patient, and disciplined, Paradisers🥂
MyCryptoParadise
iFeel the success🌴
Cryptotrading
The Missing LINK: Bulls Search for ContinuationKey Levels and Observations
The $20 level was crucial for potential wave 4 support. While this area was swept, it wasn’t decisively broken, leaving both bullish and bearish scenarios in play. Now, all focus shifts to the retracement as bulls look for internal structure and continuation, while bearish signals hint at further downside.
1️⃣ The Sweep at Support
The yellow zone ($19–$20) absorbed significant liquidity after a sweep below, signaling strong demand. However, the price's inability to decisively move higher leaves uncertainty.
2️⃣ Resistance at $23–$24
Price action is currently stalling near a key resistance zone. Bulls need to reclaim this area for continuation; otherwise, it risks a bearish reversal that could deepen the move down.
3️⃣ Bearish Pattern in Play
The actionary wave, followed by what could be a sideways flat correction, points to a potential bearish scenario. If this pattern holds, we could see a deeper move below the sweep pivot and $20 support.
Next Steps for Traders
📉 Bearish Outlook:
A decisive break below the $20 level could trigger an impulsive move downward. This could lead to a sharper decline, possibly extending beyond a Zigzag structure. Traders should watch for increasing momentum as confirmation.
📈 Bullish Outlook:
If the pivot low holds or price forms a corrective structure into an area of confluence, this may indicate the market wants to move higher. A reclaim of $23–$24 resistance would be an early sign of bullish continuation.
Final Thoughts
The retracement is the key battleground right now. For bulls to gain control, the price must stay internal to the sharp move up following the sweep and confirm continuation. However, bearish signals linger, and caution is essential. Patience and flexibility remain your best tools in navigating this complex setup.

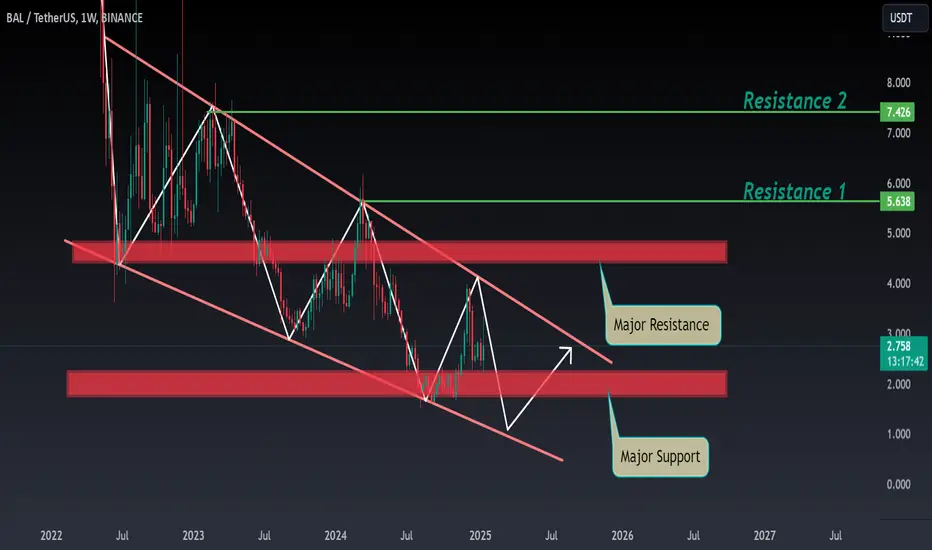
BAL ANALYSIS📊 #BAL Analysis
✅There is a formation of Descending Channel Pattern in weekly chart. Currently #BAL is in bearish way.
After a breakout of the pattern and major resistance level we would see a bullish momentum otherwise the price will drop more 🧐
👀Current Price: $2.750
⚡️What to do ?
👀Keep an eye on #BAL price action and volume. We can trade according to the chart and make some profits⚡️⚡️
#BAL #Cryptocurrency #Breakout #TechnicalAnalysis #DYOR
USUALUSDT: What Price Action Is Telling Us Today - Usual◳◱ With Super Trend in play and the price at 0.5389, the market whispers opportunity. Breaking past 0.8931 | 1.196 | 1.6671 could spark a rally, while 0.422 | 0.2538 anchors bullish sentiment.
◰◲ General Information :
▣ Name: Usual
▣ Rank: 288
▣ Exchanges: Binance, Kucoin, Gateio, Mexc
▣ Category / Sector: N/A
▣ Overview: Usual project overview is currently unavailable. I'll try to update this in the upcoming analysis.
◰◲ Technical Metrics :
▣ Current Price: 0.5389 ₮
▣ 24H Volume: 92,622,307.521 ₮
▣ 24H Change: -3.145%
▣ Weekly Change: -13.97%%
▣ Monthly Change: -41.17%%
▣ Quarterly Change: N/A%
◲◰ Pivot Points :
▣ Resistance Level: 0.8931 | 1.196 | 1.6671
▣ Support Level: 0.422 | 0.2538
◱◳ Indicator Recommendations :
▣ Oscillators: BUY
▣ Moving Averages: STRONG_SELL
◰◲ Summary of Technical Indicators : SELL
◲◰ Sharpe Ratios :
▣ Last 30 Days: 1.10
▣ Last 90 Days: 3.20
▣ Last Year: 3.20
▣ Last 3 Years: 3.20
◲◰ Volatility Analysis :
▣ Last 30 Days: 3.18
▣ Last 90 Days: 2.94
▣ Last Year: 2.94
▣ Last 3 Years: 2.94
◳◰ Market Sentiment :
▣ News Sentiment: N/A
▣ Twitter Sentiment: N/A
▣ Reddit Sentiment: N/A
▣ In-depth BINANCE:USUALUSDT analysis available at TradingView TA Page
▣ Your thoughts matter! What do you think of this analysis? Share your insights in the comments below. Your like, follow, and support are greatly valued and help sustain high-quality content.
◲ Disclaimer : Disclaimer
The content provided is for informational purposes only and does not constitute financial, investment, or trading advice. Always conduct your own research and consult a qualified professional before making any financial decisions. Use of the information is solely at your own risk.
▣ Explore the Power of Charting with TradingView
Unlock a wide range of financial analysis tools, data, and features to elevate your trading experience. Take a tour and see the possibilities. If you decide to upgrade your plan, you can receive up to $30 back. Discover more here - affiliate link -

Is ONDO Gearing Up for a Massive Breakout or Breakdown?Yello, Paradisers! Are you prepared for what’s about to unfold? #ONDOUSDT is at a critical juncture, and the price action is signaling that a major move could be imminent. Will it skyrocket higher or collapse below support? Let’s dive into the analysis.
💎#ONDOUSDT is currently trading within a falling wedge pattern a classic bullish indicator that often hints at a potential trend reversal. The price has been squeezed between a descending resistance line and a strong support level, creating a buildup of tension. At the moment, #ONDO is sitting near the $1.25665 demand zone, a critical level that buyers have historically defended with vigor. If this zone holds, a significant bullish breakout may be on the horizon.
💎Adding weight to the bullish case is the RSI divergence, which indicates that selling pressure is weakening.If #ONDO can break above the wedge’s resistance line, the stage could be set for a rally toward the $1.75–$2.30 range, with the potential to reach $2.50 or higher if bullish momentum continues.
💎However, we must stay vigilant and prepared for the alternative. If the $1.25665 demand zone fails, #ONDO could drop toward an untested historical support level at $1.0995. A break below this level might trigger a liquidation event, as weak hands are flushed out of the market. A deeper correction could then push prices toward $0.90 or even $0.70, invalidating the bullish wedge and likely increasing selling pressure.
Paradisers, this is a prime example of why patience and preparation are the most important tools in a trader’s arsenal. While most traders act on emotions, always focus on planning, waiting for confirmation, and executing smartly.
MyCryptoParadise
iFeel the success🌴

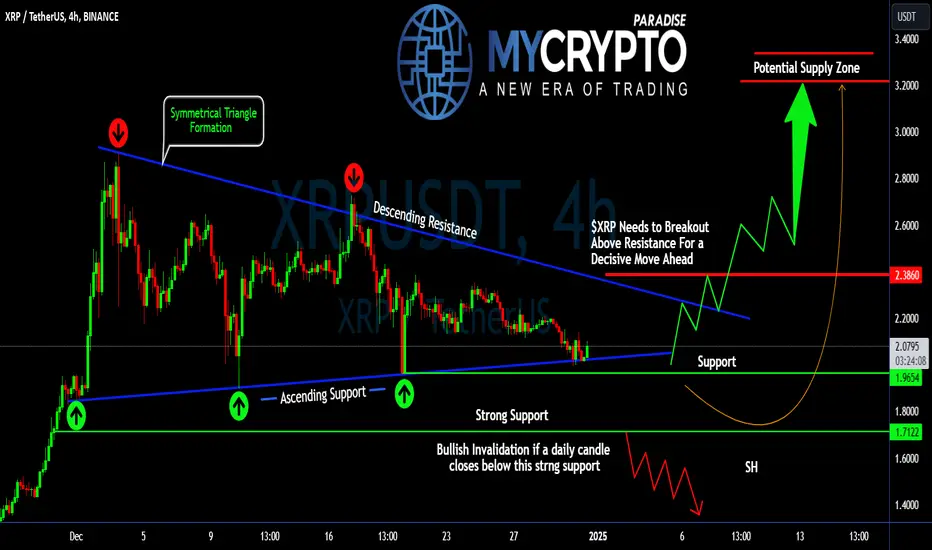
Is #XRP Ready For a Massive Move or Not? Key Levels to WatchYello, Paradisers! Can XRP bulls muster enough strength to break free, or is the market preparing for another leg down? Let’s dive into the latest analysis of #XRPUSDT:
💎#XRPUSD is currently consolidating within a symmetrical triangle formation, signaling a period of indecision as both bulls and bears battle for control. The immediate focus is on the $2.386 resistance level, which aligns with the descending resistance of the triangle. A decisive breakout above this level would confirm bullish momentum, paving the way for a rally toward the $3.20-$3.40 supply zone. This area represents a significant hurdle, and clearing it could spark renewed bullish sentiment and attract stronger market participation.
💎On the other hand, if #XRP fails to break above $2.386, the price could pull back to retest the strong support levels at $1.965 and $1.712. These zones have been critical in maintaining the bullish structure, acting as a springboard for previous recoveries. A bounce from here would give bulls another opportunity to regroup and attempt to break resistance. However, if CRYPTOCAP:XRP breaks below the $1.712 support, it would signal a bearish invalidation, opening the door for further downside toward the $1.40 demand zone. Such a move would shift the momentum in favor of bears, increasing the probability of a deeper correction.
💎If the price manages to close a daily candle above $2.386, it would validate a bullish breakout and likely fuel the next leg up. Conversely, a daily close below $1.712 would confirm a bearish breakdown, with the potential for #XRPUSDT to retest lower levels.
Stay focused, patient, and disciplined, Paradisers🥂
MyCryptoParadise
iFeel the success🌴
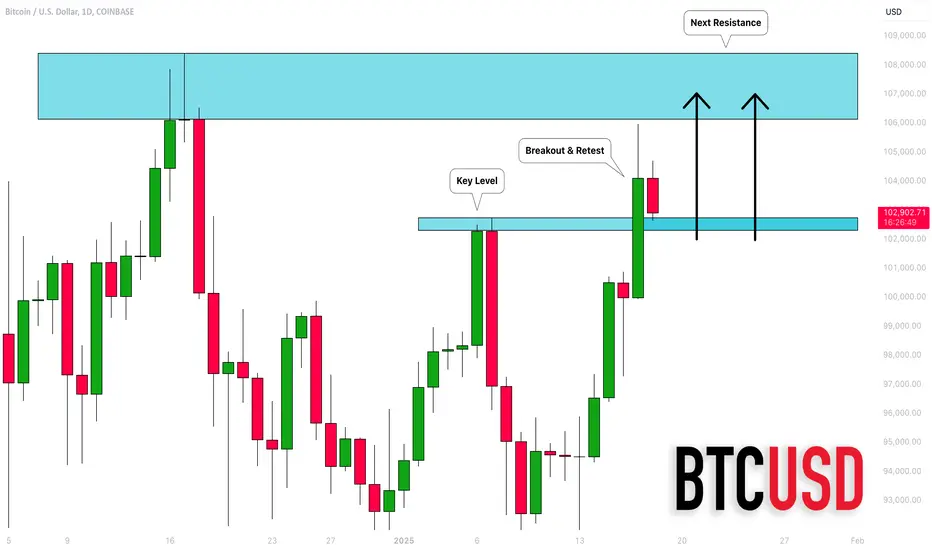
BITCOIN (BTCUSD): Test of All Time High Soon?!
Looks like Bitcoin is going to retest the resistance cluster
based on a current all time high soon.
The price is currently retesting a recently broken horizontal resistance.
A bullish wave may initiate from that.
❤️Please, support my work with like, thank you!❤️
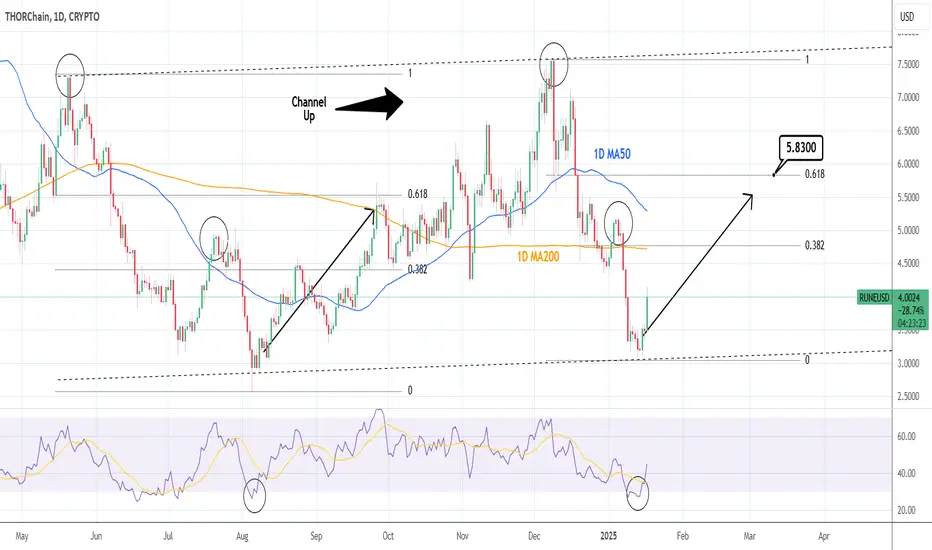
RUNEUSD: Rebound at the bottom of the Channel UpTHORChain is neutral on its 1D technical outlook (RSI = 45.391, MACD = -0.566, ADX = 34.736) as it recovered the bearish action of Wednesday. That was straight after the price made a new HL at the bottom of the long term Channel Up. The 1D RSI is rebounding in the exact same way as the August 5th 2024 HL. We are bullish, aiming for the 0.618 Fibonacci level (TP = 5.8300).
## If you like our free content follow our profile to get more daily ideas. ##
## Comments and likes are greatly appreciated. ##
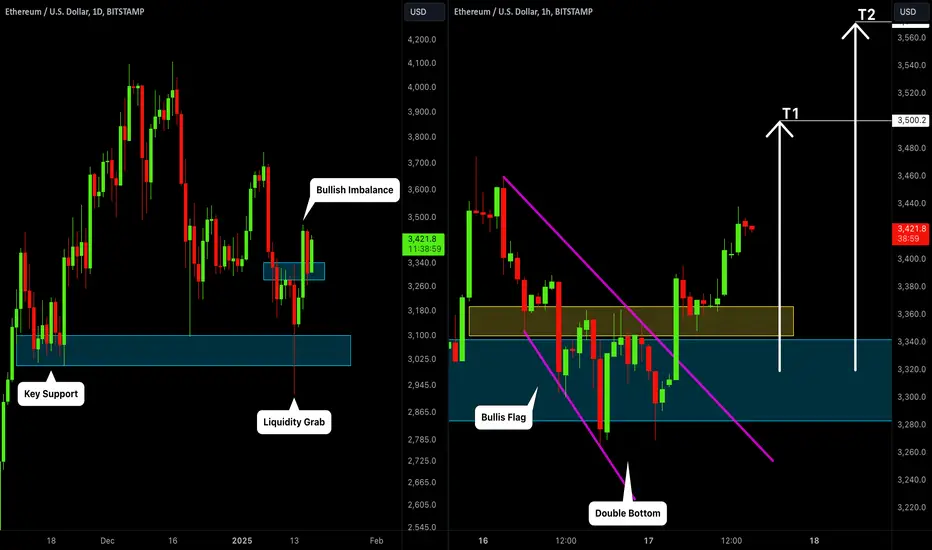
ETHEREUM (ETHUSD): Bullish Continuation Confirmed
As I promised on the yesterdays live stream,
here is the intraday confirmation that I spotted on ETH after
a formation of a bullish imbalance on a daily.
Retesting the broken structure, we see 2 breakouts:
a violation of a resistance line of a bullish flag
and a violation of a neckline of a double bottom.
I think that the market is going to reach 3500 level soon.
❤️Please, support my work with like, thank you!❤️
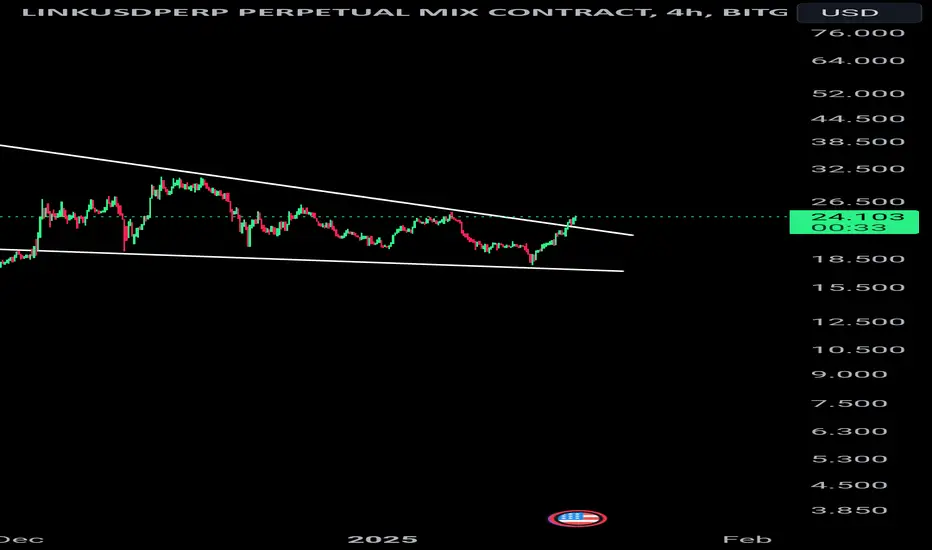
LINK on the Verge Bullish Breakout Sparks Momentum !Pattern
The chart shows a descending wedge pattern. This is generally a bullish pattern, indicating potential price reversal or breakout to the upside.
Breakout
The price has broken above the upper trendline of the wedge. This breakout is a positive signal, suggesting that bullish momentum is building.
Volume Confirmation
Check if there’s an increase in volume during the breakout. A breakout with strong volume provides confirmation.
Retest
After a breakout, it's common for the price to retest the previous resistance (now turned support). Waiting for this retest can provide a safer entry point with reduced risk.
Targets
First target: The recent swing high near $24.50.
Second target: $28.50, where there’s visible resistance.
Risk Management
Place a stop-loss below the breakout level or the lower trendline of the wedge in case the breakout fails.
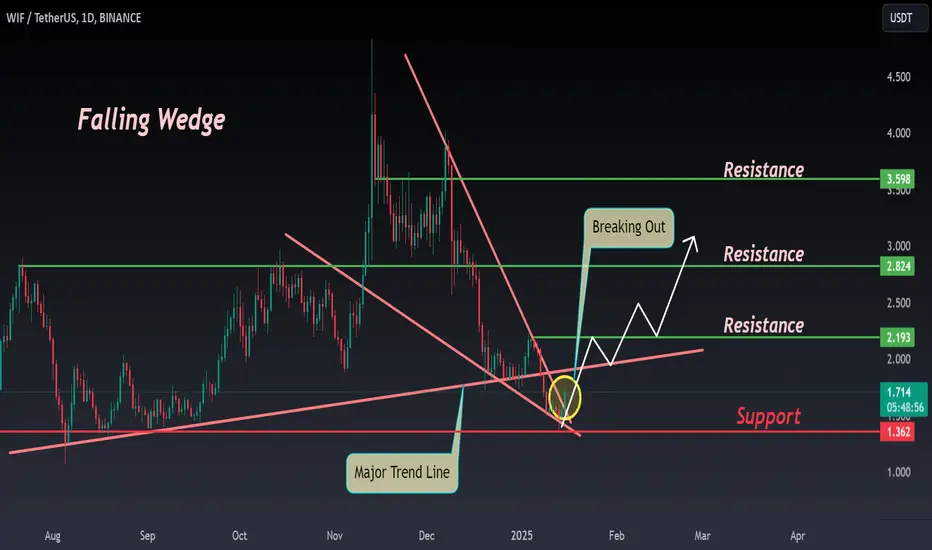
WIF/USDT: A Breakout is Brewing – Are You Ready? Yello Paradisers! Have you been tracking #WIFUSDT lately? If not, you're at risk of missing what could be a massive move will it skyrocket or collapse? Let’s break it all down.
💎#WIFUSDT has just broken out of a falling wedge pattern, a classic bullish indicator that often signals a trend reversal. Following this breakout, the price retested the key support at $1.707 and held its ground, showing clear strength from buyers. This zone, extending as low as $1.432, has been a crucial demand area that has repeatedly proven itself over the past few weeks.
💎If the price stays above this key support, we could witness a strong push toward $2.93, a minor resistance level that must be cleared to fuel sustained bullish momentum. A clean break above $2.942 would open the doors for WIF to target its major resistance zone between $4.63 and $4.80. Historically, this level has been a significant ceiling, but if breached, it could trigger an explosive rally.
💎 On the flip side, if the price fails to hold the $1.432 demand zone, it could result in a bearish breakdown, potentially dragging the price below $1.00.
💎#WIFUSD is at a critical crossroads. Bulls need to reclaim higher levels, while bears are closely watching for any signs of weakness to exploit. As Paradisers, this is a time for patience and discipline. Don’t rush into a position wait for clear confirmations of a breakout or breakdown before making any moves.
Stay focused, play it smart, and remember, Paradisers: the market rewards those who are disciplined and prepared!
MyCryptoParadise
iFeel the success🌴

Will #DOT Break Free or Get Caught in a Bearish Trap? Key LevelsYello, Paradisers! #DOTUSDT is gearing up for a major move, but will it be a breakout to new highs or a collapse to lower levels? Let’s dive into the current setup of #Polkadot:
💎#DOT is trading within a falling wedge formation, a classic bullish reversal pattern often seen before significant price surges. Over the last few weeks, we’ve seen multiple liquidity sweeps at lower levels, where impatient traders got shaken out. These sweeps usually hint at a potential breakout, but confirmation is still key before making any decisive moves.
💎#DOTUSD faces strong resistance near $8.00, which aligns with the upper boundary of the falling wedge. For bulls to take control, the price must close above this level on the 8-hour timeframe. A breakout here could trigger a powerful rally toward the $11.00–$11.5 major resistance zone, where sellers are likely to step in.
💎The first significant support level sits at $6.41, an area where buyers have consistently entered the market. If this zone holds, it could serve as a springboard for the next upward move. If #Polkadot closes below $6.41, the next major support lies between $5.80–$5.34.
💎A close below $5.34 would signal a breakdown of bullish momentum, increasing the likelihood of a prolonged bearish phase. The bears will take control of the price movement and it will fall to lower support levels.
Stay focused, patient, and disciplined, Paradisers🥂
MyCryptoParadise
iFeel the success🌴

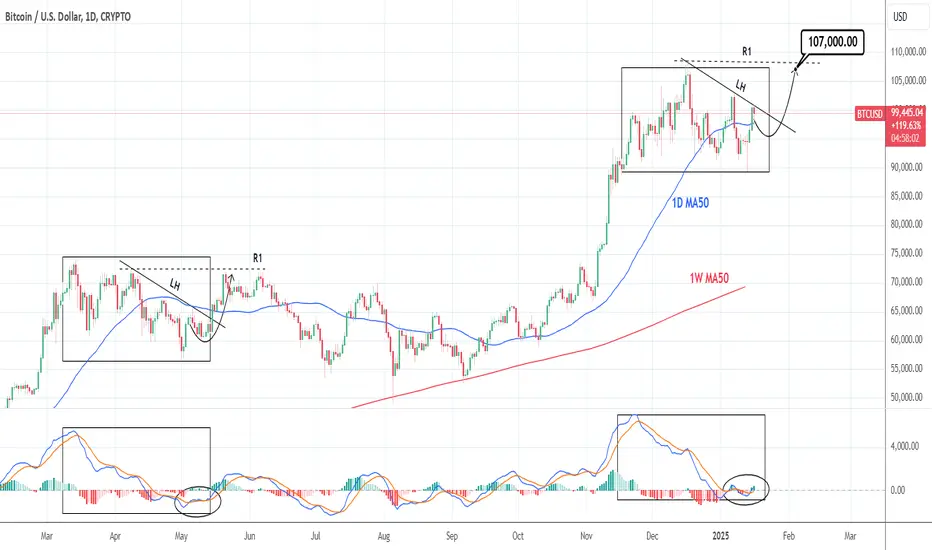
BTCUSD: Blast from the past targets $107,000Bitcoin is having a strong 3 day rally but despite the aggression, its 1D technical outlook only just now turned bullish (RSI = 56.345, MACD = -95.200, ADX = 24.772). This shows the strong bullish potential that this wave still has and in fact, based on the 1D MACD, it is mirroring so far the March-May 2024 pattern. The presence of the LH trendline in the past supressed the price until the 1D MA50 was crossed and the bullish breakout almost touched the R1 level. Right now the new R1 is being tested so if crossed, we will be expecting a near test of the current R1 level (TP = 107,000).
## If you like our free content follow our profile to get more daily ideas. ##
## Comments and likes are greatly appreciated. ##
Why Most Traders Fail (And How I Turned It Around)I still remember my first trade like it was yesterday. I had no idea what I was doing, but I convinced myself I was going to crush it. Spoiler alert: I didn’t. In fact, I wiped out 20% of my account in less than an hour. I sat there staring at my screen, wondering what the hell just happened.
If you’ve been there, I get it. Trading isn’t easy—it’s brutal at times. The truth is, most traders fail not because they’re bad at it, but because they’re unprepared for what trading really demands.
I’ve made every mistake you can think of, but here’s the good news: I’ve also learned how to turn it around. This isn’t theory—it’s my story.
Lesson 1: Winging It Will Destroy You
When I started, I thought trading was just about picking the right stock or currency and riding the wave. I’d watch a few YouTube videos, scan some charts, and think, “Yeah, this looks good!” It wasn’t. I was basically gambling with my money.
What finally clicked:
-I needed a plan, plain and simple. One day, I sat down and wrote out what I’d do: what I’d trade, how I’d manage risk, and when I’d call it a day.
-The first time I actually stuck to my plan, I didn’t even win big. But for the first time, I felt in control, and that was everything.
Lesson 2: Risking It All = Losing It All
There was this one trade—I'll never forget it. I bet way more than I should’ve because I was sure I’d win. When it went south, I froze. I couldn’t bring myself to close it, and the losses just piled up. By the time I got out, half my account was gone.
What saved me:
-I learned to only risk a small percentage of my account—1-2% per trade. Yeah, it felt slow, but it kept me in the game.
-I started using stop losses religiously. No more crossing my fingers and hoping for the best.
Lesson 3: Emotions Are Your Worst Enemy
I used to get so caught up in the highs and lows. A big win would make me feel invincible. A big loss? Devastated. I’d jump into revenge trades, trying to get my money back, and just dig myself deeper.
What changed:
-I started journaling every trade—not just the numbers, but how I felt. I noticed patterns, like how I’d overtrade when I was frustrated.
-Now, if I feel off, I walk away. No charts, no trades, just a reset.
Lesson 4: Overtrading Was My Addiction
I thought trading more meant making more. So I’d take setups that were “meh” at best, just to feel like I was doing something.
What helped:
-I stopped looking for trades—I started waiting for them.
-Now, I focus on one or two great setups a day. The rest? I let them go.
Lesson 5: You Don’t Have to Know Everything
At one point, I was drowning in information. I had 15 indicators on my chart, followed 20 gurus on Twitter, and read every trading blog I could find. It was overwhelming, and it didn’t help.
My aha moment:
-Simplicity wins. I stripped my charts down to the basics: price action, support/resistance, and a couple of indicators I actually understood.
-I stopped chasing the “perfect” strategy and focused on mastering one approach.
You Can Do This
I’ll be honest—there were moments when I wanted to quit. Blowing up accounts, feeling like a failure, wondering if I was cut out for this... it was hard. But looking back, I’m glad I didn’t give up.
If you’re struggling, I get it. I’ve been in your shoes, and I know how overwhelming it can feel. Send me a DM or check out my profile —I’m here, happy to share what worked for me and help however I can.
Trading isn’t about being perfect. It’s about progress. So take a breath, refocus, and keep going. You’ve got this.
Kris/Mindbloome Exchange
Trade What You See
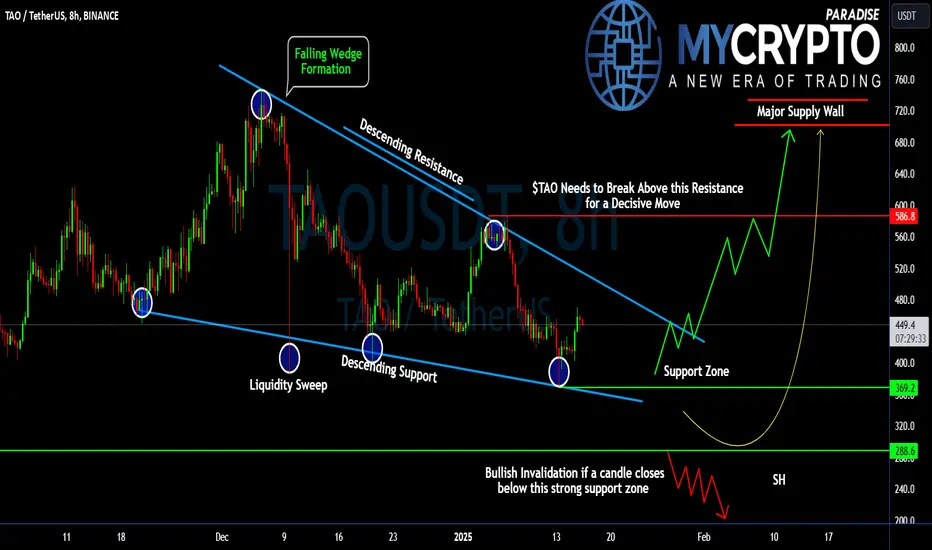
#TAO Getting Ready For a Major Bullish Move | Are You Ready?Yello, Paradisers! Will #TAOUSDT Ignite a Bullish Rally or Collapse into a Bearish Trap? Here’s What You Need to Know about the latest setup of #Bittensor:
💎#TAO is currently trading within a Falling Wedge, a classic reversal pattern that often signals a potential breakout. The price is testing critical resistance levels, and what happens next could define #TAO's trajectory for the coming weeks. Notice the recent liquidity sweeps at lower levels, where weak hands were shaken out. This is often a precursor to a significant move. However, without confirmation of a breakout above resistance, patience is key.
💎#TAOUSD must break above the descending resistance near $586.8 for a decisive bullish move. A strong close above this level on the 8H chart could propel the price toward the major supply zone at $680–$720. These levels will be critical for profit-taking or managing risk.
💎On the downside, the current support sits between $369.2 and $288, offering a strong demand area where buyers have consistently stepped in. The Bulls have defended these levels many times and a lot of liquidity rests between these two levels.
💎A candle close below $288 would signal that the bears are firmly in control. This breakdown could open the door to a deeper correction, targeting $200 in extreme bearish scenarios.
Stay focused, patient, and disciplined, Paradisers🥂
MyCryptoParadise
iFeel the success🌴
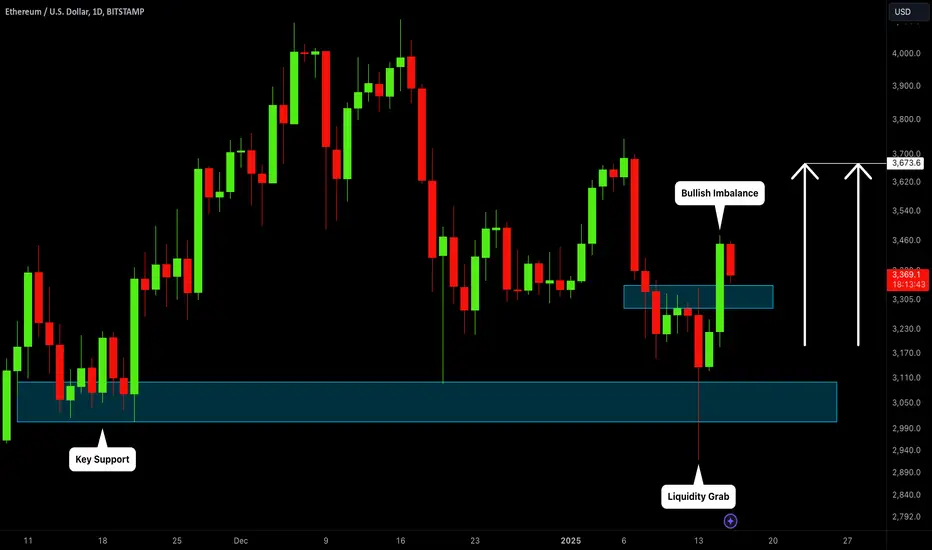
ETHEREUM (ETHUSD): Bearish Trap & Confirmed Bullish Movement
I see a nice example of a liquidity grab after a test of a key daily support,
followed by a confirmed bullish imbalance.
With a high probability, the market will continue rising.
Goal - 3672
❤️Please, support my work with like, thank you!❤️
Thu 16th Jan 2025 BTC/USD Daily Forex Chart Buy SetupGood morning fellow traders. On my Daily Forex charts using the High Probability & Divergence trading methods from my books, I have identified a new trade setup this morning. As usual, you can read my notes on the chart for my thoughts on this setup. The trade being a BTC/USD Buy. Enjoy the day all. Cheers. Jim

WIF ANALYSIS🚀#WIF Analysis :
🔮As we can see in the chart of #WIF that there is a formation of "Falling Wedge Pattern". In a daily timeframe #WIF broke out the pattern. Expecting a bullish move in few days after the breakout of major trendline.
⚡️What to do ?
👀Keep an eye on #WIF price action. We can trade according to the chart and make some profits⚡️⚡️
#WIF #Cryptocurrency #TechnicalAnalysis #DYOR
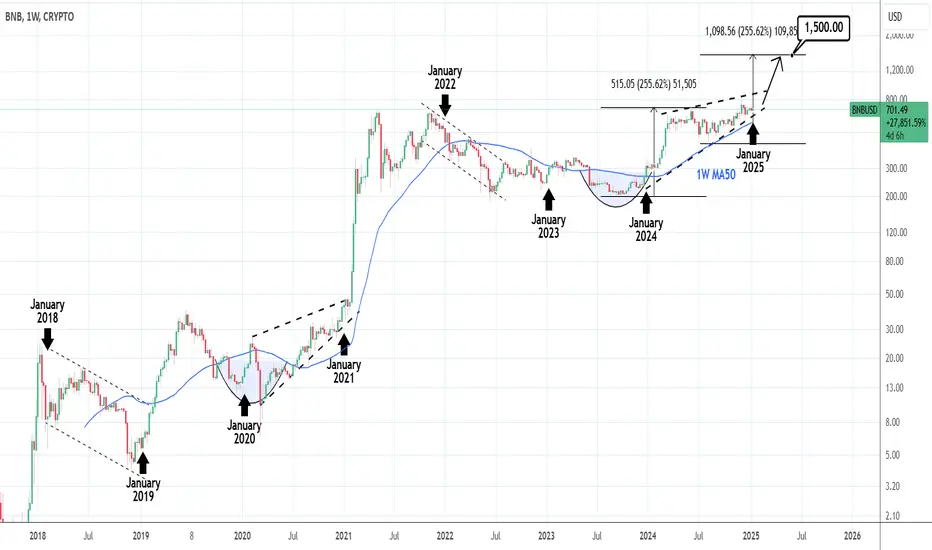
BNBUSD: 1 year Rising Wedge is about to break upwards to $1,500.BNBUSD is neutral on its 1D technical outlook (RSI = 52.057, MACD = -0.160, ADX = 20.933) which along with the bullish 1W chart (RSI = 59.785) it outlines the long term bullish potential. With the Support of the 1W MA50, a bullish breakout is expected as the Rising Wedge pattern of 2024 is about to come to an end. The similarities with the 2018-2021 Cycle are evident, where a Rising Wedge was again present for the whole year of 2020. When it brokeout in 2021, an insane rally took place. If it is of the same strength as 2024, then we will stay bullish until it completes a +255% rise (TP = 1,500).
## If you like our free content follow our profile to get more daily ideas. ##
## Comments and likes are greatly appreciated. ##
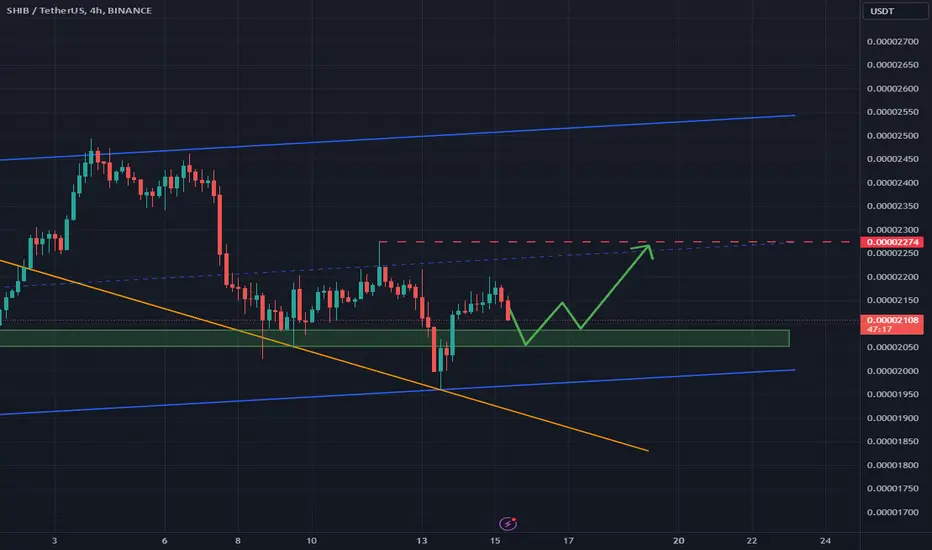
SHIBUSDT potential move to the Up SideThe SHIBUSDT market has moved lower, forming an ABCD pullback. A false breakout occurred below the lows of the last three weeks, resulting in a long-tailed bar on the weekly timeframe. The market has adhered to the downward trendline and recently rebounded from it. With the price now climbing back above the previous weekly lows (PWLs), there is a potential for it to retest that level once more.
From a broader perspective, the strongest support level is near 0.000019, and the price may gravitate toward this area again. In the midterm, however, the market is anticipated to at least retest the lower high (LH) and possibly reach the zone above it. The key focus remains on the resistance zone around 0.000023
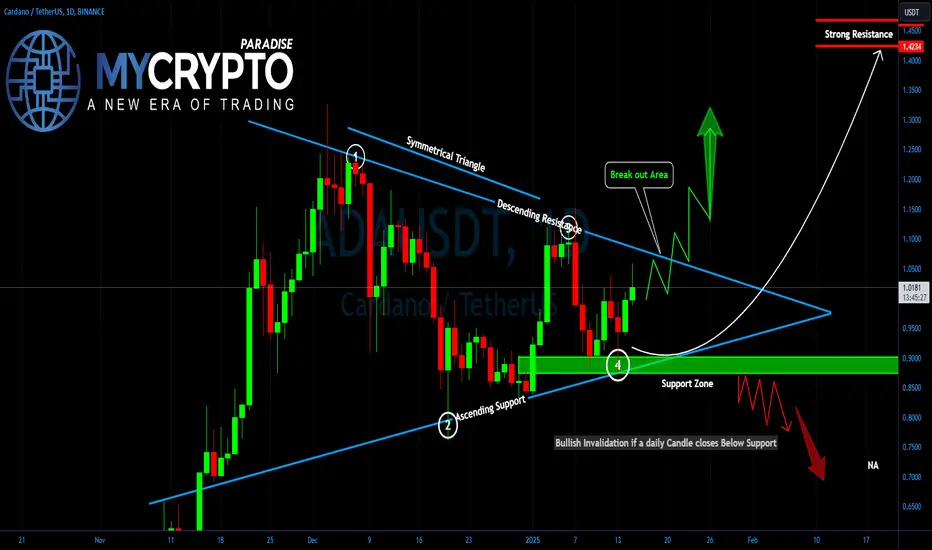
Is ADA About to Explode or Collapse? Key Levels You Can't IgnoreYello Paradisers! Are you watching Cardano (ADA)? If not, you might miss one of the most decisive moments in recent weeks. The symmetrical triangle forming on the daily chart is nearing its breaking point, and when it does, we could see an explosive move.
💎#ADAUSDT is currently trading within a symmetrical triangle, a classic pattern that indicates market indecision. The price is compressing between an ascending support line and a descending resistance line, creating a tightening range. This formation suggests that a breakout or breakdown is imminent, and Paradisers should be prepared for either scenario.
💎On the bullish side, the resistance zone between $1.0660 and $1.0774 is the key level to watch. A breakout above this range, confirmed by a daily close and increased volume, could ignite a powerful move toward $1.25, $1.35, and even the $1.4469 region, where we see significant historical resistance. Such a breakout would confirm bullish momentum and potentially attract new buyers.
💎Conversely, the support zone between $0.8970 and $0.8756 is a critical level for the bulls to defend. A breakdown below this zone would invalidate the bullish triangle and open the path for a sharper decline.Wait for a clean break of either resistance or support before committing to a position, and always trade with a proper risk management plan in place.
Discipline, patience, and a clear strategy will always set you apart from the herd. Let the market reveal its direction, and act decisively when it does. Be a pro, Paradisers!
MyCryptoParadise
iFeel the success🌴
Master Short-term Trading in Stock, Forex, and Crypto MarketsMaster Short-term Trading in Stock, Forex, and Crypto Markets
Short-term trading is a fast-paced approach that demands skill, strategy, and quick decision-making to capitalise on small price moves in financial markets like stocks, forex, and crypto. This article dives into advanced techniques, adaptive strategies, and psychological discipline needed to improve your trading edge.
Choosing the Right Market and Asset for Short-Term Trading
Short-term trading isn’t just about finding an opportunity; it’s about picking the right market and asset that aligns with your strategy, risk tolerance, and trading style. Different assets and markets move in unique ways, and understanding their traits can sharpen your trading decisions and improve your ability to identify favourable setups.
Stocks
When short-term trading stocks, movements often hinge on company-specific events like earnings reports, product launches, or even management changes. Ideal stocks for short-term trading typically include those in technology or high-growth sectors, which tend to show greater volatility and liquidity. However, specific stock trading hours limit opportunities (with after-hours trading often seeing lower volume), which can reduce flexibility compared to 24-hour markets like forex or crypto.
Forex
Known for its high liquidity and 24-hour trading cycle 5 days a week, the forex market offers ample short-term trading opportunities, particularly with major currency pairs like EUR/USD or GBP/USD. These pairs are heavily traded, leading to tighter spreads, which is essential for traders looking to make multiple trades in a single day. The forex market is also influenced by economic data releases and geopolitical events, making it a good match for traders who stay updated on global news and market sentiment.
Commodities
Trading commodities like gold, oil, and silver can add diversity to short-term trading. Commodities often see increased activity during times of economic uncertainty or when inflationary pressures are high. Precious metals like gold, for instance, are seen as so-called “safe havens,” attracting short-term traders during volatile market periods. Energy commodities, such as oil, also offer strong moves tied to supply and demand shifts, including geopolitical developments and inventory reports.
Cryptocurrencies
The crypto market stands out for its high volatility and 24/7 trading schedule. For those looking to trade for the short term in the crypto market, major coins like Bitcoin and Ethereum are common choices due to their frequent price swings, while smaller coins can offer higher-risk, high-reward short-term investment potential.
However, crypto’s high risk and rapid price swings mean that traders must carefully manage the size of their short-term investments and stay alert to sudden shifts in market sentiment, often driven by regulatory updates or large-scale adoption news.
Advanced Technical Analysis Techniques
For traders aiming to refine their short-term investing, advanced technical analysis techniques can provide the depth needed to make quick, informed decisions. These methods go beyond basic indicators, giving traders a closer look at price dynamics, market psychology, and trade volume to spot potential setups.
Price Action Analysis
Price action analysis focuses on interpreting price movements without relying heavily on indicators. Traders using this method look for specific patterns like “doji” and “engulfing” candlesticks to gauge market sentiment. Recognising these patterns, along with key levels such as support and resistance, can help trader time entries and exits by indicating when momentum may shift. Price action is especially useful in volatile markets, where traditional indicators may lag.
Volume Profile
Volume profile charts and indicators show the volume traded at each price level over a given period, helping traders identify where the most buying and selling is happening. This technique highlights “high-volume nodes,” or price points where large amounts of trading occur, indicating levels where the price might stall or reverse. By using volume profiles, traders can spot areas of consolidation or breakout zones, refining their trade entries or exits based on market interest.
Discover volume profile tools on FXOpen’s advanced TickTrader platform.
Dow Theory
Dow Theory is a market analysis framework that asserts markets move in trends, with each trend consisting of primary, secondary, and minor waves. Short-term traders often focus on secondary trends (lasting days to weeks) to align their trades with market direction. By recognising the phases of accumulation, public participation, and distribution, traders can better understand the market’s larger direction and time their entries.
Wyckoff Theory
Wyckoff Theory can be used by short-term traders for recognising and capitalising on repeatable market patterns driven by supply and demand. Through Wyckoff’s approach to price and volume analysis, traders can identify phases, which signal potential reversals or continuation trends. This allows short-term traders to time entries and exits more accurately based on market structure. Additionally, Wyckoff’s emphasis on liquidity and the role of large institutional players helps traders anticipate price movements, enabling them to make informed decisions in volatile, fast-moving markets.
Elliott Wave Theory
Elliott Wave Theory proposes that markets move in repetitive waves influenced by crowd psychology. For short-term traders, identifying the five-wave impulse or corrective patterns can provide context on where the market may be within a larger cycle. This analysis can assist in timing trades by aligning with the anticipated movement within a wave sequence.
Developing a Flexible, Adaptive Strategy
In fast-paced markets, adaptable short-term trading strategies are key for traders who want to thrive in varying conditions. A flexible approach enables traders to pivot based on volatility, volume, and market sentiment without rigidly sticking to one strategy.
Scalping vs Day Trading
Scalping and day trading both offer short-term opportunities, but each thrives in distinct conditions. Scalping—executing numerous quick trades for small gains—is potentially effective in high-volatility environments with tight spreads, like forex or certain tech stocks. Day trading, on the other hand, takes advantage of slightly longer holding times within a single day, allowing traders to capitalise on more substantial moves. Knowing when to switch between these approaches keeps traders prepared.
Timeframe Adjustments
Adapting timeframes based on volatility can improve timing. For example, traders might use 1-minute charts during high volatility and 5- or 15-minute charts when the market is steadier, allowing them to focus on potentially more reliable setups without overreacting to noise.
Continuous Backtesting and Refinement
An adaptive strategy relies on ongoing backtesting to identify what works in current conditions. Live adaptation is also essential—strategies might need adjustments in real time based on changing market sentiment or unexpected events. Keeping strategies flexible and adjusting as data changes help traders stay aligned with the market’s rhythm.
Advanced Risk Management Techniques
Effective risk management goes beyond setting a simple stop loss. For advanced traders, techniques like dynamic position sizing, trailing stops, and a nuanced grasp of win rate and risk-reward ratios are essential to navigating volatile markets.
Dynamic Position Sizing
Adjusting position sizes based on current market conditions allows traders to respond to volatility without overexposing their capital. For instance, in highly volatile sessions, traders may reduce position sizes to limit exposure, while in low volatility periods, they might increase them to capture larger potential gains.
Trailing Stops
Trailing stops protect potential gains while letting trades run. As the market moves favourably, a trailing stop gradually locks in gains, automatically adjusting to reduce risk if the trend reverses. This is especially useful for fast-paced assets where trends can shift quickly, helping traders maximise trade effectiveness without manually adjusting their exits.
Win Rate and Risk-Reward Balance
A high win rate isn’t always the goal; balancing it with a good risk-reward ratio is often more sustainable. For example, a trader with a 40% win rate might still see strong potential returns if their average risk-reward is 1:3.
Psychological Discipline and Strategy Execution
Mastering short-term trading requires more than technical skill—it’s about controlling emotions and staying disciplined under pressure. Even with a solid strategy, emotional biases like fear and greed can cloud judgement and lead to impulsive decisions.
Avoiding Overtrading
Overtrading often stems from frustration or the “fear of missing out.” Identifying decent shares to buy for the short term can be exciting, but it’s essential to set clear limits on daily trades. By focusing on quality setups over quantity, traders can prevent hasty, low-probability trades that erode potential gains.
Sticking to the Plan
A pre-set strategy is only as good as its execution. Traders can strengthen discipline by following structured routines—such as starting each session with a plan, reviewing recent trades, and assessing market conditions. Journaling each trade, including the reasoning and emotions behind it, helps reinforce the commitment to the strategy.
Routine and Mindfulness
Building a consistent daily routine, from meditation to pre-market preparation, can help reduce emotional swings and keep a trader’s focus sharp. Practising mindfulness helps traders stay centred, making it easier to manage emotions, avoid unplanned trades, and stay aligned with their strategic goals.
The Bottom Line
Skills like advanced analysis, adaptable strategies, and emotional discipline are essential to navigate stocks, forex, and cryptocurrency markets effectively. With the right tools and techniques, traders can make agile decisions in fast-moving markets. For those ready to take their trading further, opening an FXOpen account offers access to four robust trading platforms, competitive spreads, and fast execution speeds—ideal for short-term trading.
FAQ
What Is Short-Term Trading?
Short-term trading involves buying and selling financial assets over low timeframes, typically ranging from minutes to hours. Traders aim to capitalise on rapid price movements rather than holding positions long-term.
How Do Short-Term Traders Make Money?
Short-term traders aim to take advantage of small price changes by timing their trades based on market trends, technical analysis, or key events. They base their strategies on quick decision-making, effective risk management, and sometimes high-frequency trading.
How to Pick Good Stocks for the Short-Term?
To find short-term stocks, traders look for stocks with high liquidity and volatility, as these are more likely to see meaningful price swings. Many traders focus on stocks to buy for the short term that offer recent/upcoming news or earnings reports, which tend to drive price momentum.
Which Crypto to Buy for the Short-Term?
High-liquidity cryptocurrencies like Bitcoin and Ethereum are popular for short-term trades due to frequent price fluctuations. However, smaller coins can also offer opportunities, but these often carry higher risks due to their volatility.
Can You Make a Living From Short-Term Trading?
Yes, but it’s challenging. Short-term trading requires a strong strategy, deep market knowledge, and emotional discipline. Many traders supplement their income with other sources, as consistent gains can be difficult to achieve.
At FXOpen UK, Cryptocurrency CFDs are only available for trading by those clients categorised as Professional clients under FCA Rules. They are not available for trading by Retail clients.
This article represents the opinion of the Companies operating under the FXOpen brand only. It is not to be construed as an offer, solicitation, or recommendation with respect to products and services provided by the Companies operating under the FXOpen brand, nor is it to be considered financial advice.

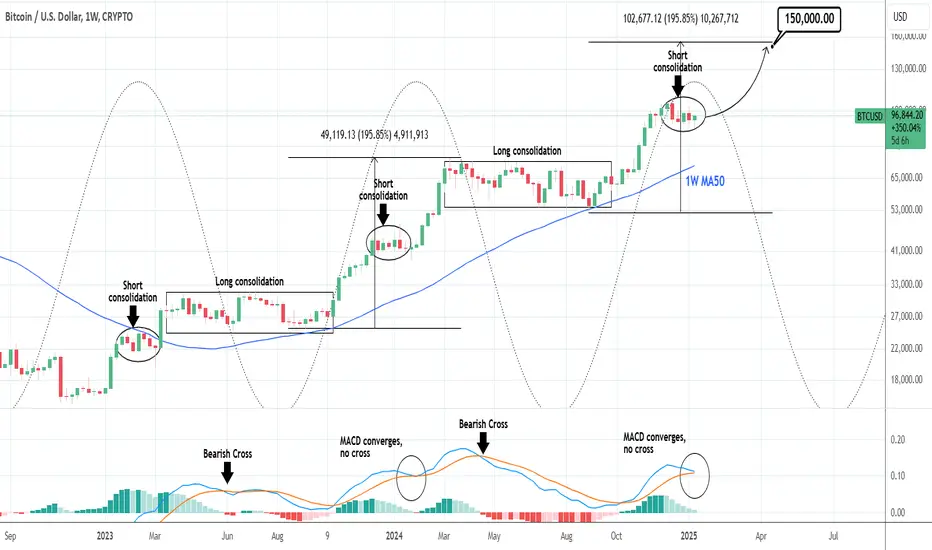
BTCUSD: This is a consolidation and we've seen it before.Bitcoin is neutral on its 1D technical outlook (RSI = 51.151, MACD = -617.400, ADX = 24.376) as it hasn't escaped the right range it's been trading in since late December. The 1W MACD has converged but hasn't made the Cross yet and as long as it doesn't, based on the time cycles, this is most likely a short consolidation that has happened almost exactly during the same time both in January 2024 and 2023. When the 1W MACD made the Bearish Cross, we had the long consolidation phases. By next week we should see this consolidation break to the upside. Our target is the same with the early 2024 breakout, a +195% rise from the bottom (TP = 150,000).
## If you like our free content follow our profile to get more daily ideas. ##
## Comments and likes are greatly appreciated. ##