The Future of Cryptocurrencies: Navigating Beyond BitcoinI've been diving deep into the crypto world, and it's clear that Bitcoin and Ethereum aren't the only players anymore. As we're pushing through 2025, the crypto landscape is buzzing with altcoins, DeFi projects, and wild blockchain innovations. Here's how I've learned to navigate this exciting, yet sometimes wild, space:
Beyond Bitcoin and Ethereum
I used to think Bitcoin and Ethereum were the be-all and end-all of crypto, but man, was I wrong. Now, I'm exploring altcoins because:
-Diversification: I spread my crypto eggs across multiple baskets to catch the next big wave while keeping my portfolio balanced.
-Innovation: Altcoins are where the coolest new tech is happening. From privacy features to new ways of reaching consensus, it's like a tech playground out there.
Current Trends in Altcoins
-DeFi Developments: I've fallen down the rabbit hole of DeFi. Platforms like Aave or Compound? They're letting me lend, borrow, or farm yields directly on the blockchain. It's like the Wild West of finance, but I'm loving the autonomy and potential returns.
-Layer 2 Solutions: Ethereum's scaling problems got me looking at projects like Polygon (MATIC) and Solana (SOL). These are speeding up transactions and cutting costs, making blockchain tech more usable for everyday stuff, from gaming to buying digital art.
My Investment and Trading Strategies
Researching Altcoins:
-Technology: I geek out on the tech. Does it solve a real problem?
-Team: I check if the team behind it seems legit or if they're just in it for the quick buck.
-Community: A lively community is a good sign. It's like having a cheerleading section for your investment.
-Real-world Use: I'm all about coins that have a practical use. It gives me confidence in their longevity.
Portfolio Allocation: Here's how I juggle my crypto stash:
50-60% in Bitcoin and Ethereum for stability.
20-30% in well-established altcoins with solid fundamentals.
10-20% for the moonshots – those high-risk, high-reward projects that keep the thrill alive.
Managing Risks in Crypto Trading
- Volatility : Crypto can be a rollercoaster. I use dollar-cost averaging to smooth out the wild rides and set stop losses because, let's be real, I've learned the hard way that the market can tank when you least expect it.
-Security: I'm super paranoid about security. I keep my significant holdings in hardware wallets and do my homework on every ICO – because scam coins are real, folks.
Case Studies
- Success Story: I've been watching Cardano (ADA), which has been on fire with its focus on security and real-world applications, especially in Africa. It's been a good reminder that tech with purpose can go places.
-Cautionary Tale: The Terra (LUNA) crash was a wake-up call. It showed me how quickly things can go south in the crypto world, especially with stablecoins.
Technological Innovations
- NFTs: I've seen NFTs go from digital art to owning pieces of virtual land. They've changed my view on what digital ownership can be.
-Cross-Chain Solutions: Projects like Polkadot and Cosmos are fascinating because they're trying to make all these different blockchains talk to each other. It's like building a universal translator for crypto.
Looking Ahead
-Regulatory Landscape: I keep an eye on regulations because they could either make or break some altcoins I'm interested in.
-Integration with Traditional Finance: I'm seeing more and more traditional finance players dipping their toes into crypto. It's exciting to watch.
Next Big Use Case: I'm always on the lookout for the next big thing, like Web3, which could totally shift how we interact online.
If you want to know more, send me a DM or head over to my profile. If you liked this post, please don't forget to boost, share, and comment below.
Kris/Mindbloome Exchange
Trade What You See
Cryptotrading
ENAUSDT — Double Top Breakdown: Is a Bigger Drop Coming?Yello, Paradisers! Have you spotted the double top pattern on #ENAUSDT? Let’s break it all down clearly.
💎#ENA is showing a double top breakout, which is a strong bearish signal. The price recently broke below the support neckline and is now retesting that same level, which has turned into a resistance zone around $0.85 to $0.91. This area is key. If the price gets rejected here, it’s likely to continue its downward move toward the next support at $0.68. There’s even a chance it could drop lower into a stronger support zone if the selling pressure increases.
💎However, if ENA manages to reclaim this resistance zone, the price could push higher and target the supply zone between $1 and $1.08. In this case, it would grab liquidity before continuing its downward trend. Keep in mind that this move wouldn’t necessarily signal a full reversal — it could just be a temporary bounce.
💎The key level to watch for bearish invalidation is $1.08. If we see a daily close above $1.08, it would suggest that the bearish structure has broken and the price could shift back into a bullish trend.
Remember, consistency is what separates successful traders from the rest. Stay focused, Paradisers.
MyCryptoParadise
iFeel the success🌴

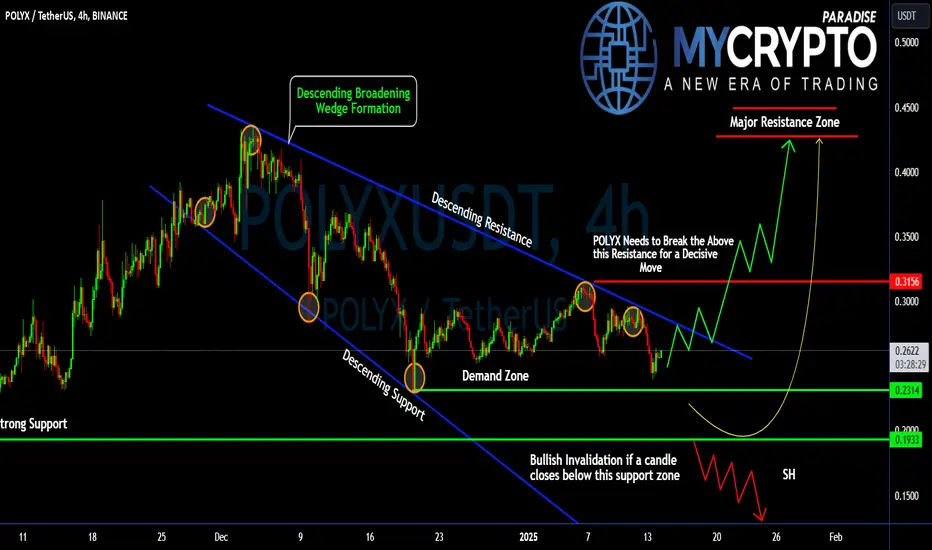
#POLYX Ready For a Major Bullish Move or Not? Key Levels Yello, Paradisers! Is #POLYXUSDT about to break free, or could we see a deeper dive into bearish territory? Let’s break it all down for #Polymesh setup:
💎#POLYX is forming a Descending Broadening Wedge—a classic pattern known for signaling potential trend reversals. The price is currently going to test the upper descending resistance, sitting around $0.3156. A decisive breakout here could trigger a strong bullish move.
💎If #POLYXUSD breaks above $0.3156 with a solid 4H or daily close, the next target zone lies between $0.4000 and $0.4500, where sellers are likely to re-enter aggressively. You need to watch for increased volume and momentum to confirm this breakout.
💎On the downside, we have a reliable demand zone around $0.2314, with major support at $0.1933. These levels have provided significant liquidity for buyers in the past and are key for maintaining the bullish structure. The Bulls will definitely buy #Polymesh here and it will likely bounce back.
💎A breakdown below $0.1933 with a 4H or daily candle close would invalidate the bullish setup. This could lead to a steep drop, targeting $0.1500 or lower, potentially indicating a bearish market sentiment shift.
Stay focused, patient, and disciplined, Paradisers🥂
MyCryptoParadise
iFeel the success🌴
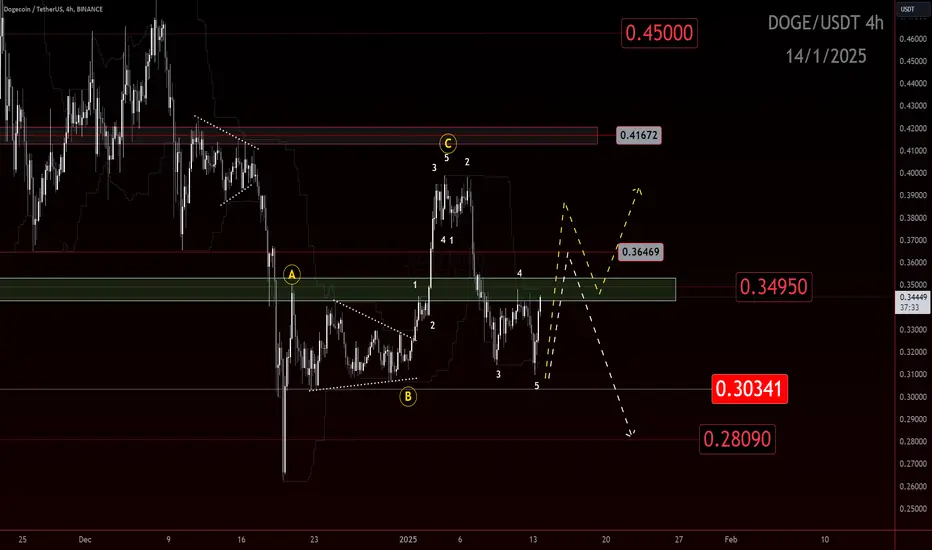
Bulls or Bears? Who’s going to be Top Doge!The market remains in a critical state, with key levels in play that will determine the next major move. The price has failed to break the .41 level, confirming the development of a 3-wave move up. This signals that the market may be entering a period of consolidation or correction, rather than continuing its upward trajectory.
Currently, the price has broken below key support and is facing rejection at this level. This rejection suggests that bearish momentum could be taking hold, with the potential for an impulse move down in the near future.
For bulls, the immediate focus is on reclaiming the .35 level. If the price fails to regain this level, the next potential target could be .28. Traders should remain vigilant as the market tests these crucial levels.
Key Levels to Watch
.35 Level
For bullish traders, reclaiming .35 is critical. If the price breaks back above this level, it would signal potential strength and might open the door for further gains. A failure to reclaim this level, however, could signal the start of a deeper pullback.
.28 Level
Should the bulls fail to reclaim .35, the .28 level becomes the next major point of interest with a potential of going deeper. This level could act as strong support, but a break below it may lead to further downside potential.
Potential for Impulse Down
At the moment, the market shows signs of a possible impulse move down, especially if the bulls cannot regain control above .35. If the price continues to reject at key levels, the market may quickly shift toward bearish pressure, with .28 coming into play as the next potential target.
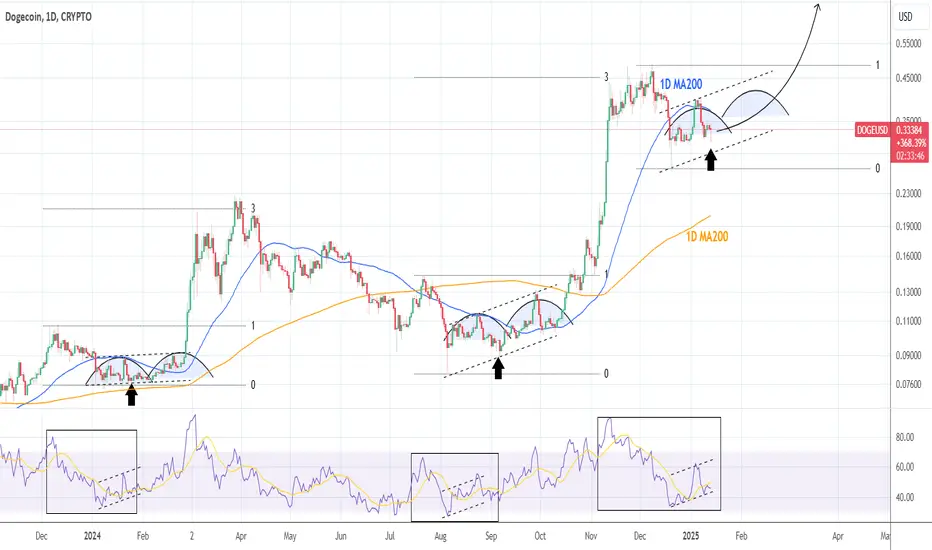
DOGEUSD: Typical prerally accumulation. Strong BUY.Dogecoin turned neutral on its 1D technical outlook (RSI = 45.150, MACD = -0.010, ADX = 26.634) as it tested the January 9th low. Technically this is a HL on the Channel Up that started after the December 20th 2024 bottom. The 1D RSI pattern looks very much like the last time it was trading on those (nearly) oversold levels after the August 5th 2024 bottom, as well as the time before that, the January 7th 2024 bottom.
All three are Channel Up patterns that were technical accumulations, separated in two phases. We have denoted those with the Arcs. In relative terms with those past patterns, we are currently at the end of accumulation phase 1, so the price should start rising to a new HH on the Channel Up. The past two patterns kickstarted a parabolic rally after that HH pullback, that marginally exceeded the 3.0 Fibonacci extension.
This projects that DOGE's long term target is the new 3.0 Fib from High to Low (TP = 1.6000).
See how our prior idea has worked out:
## If you like our free content follow our profile to get more daily ideas. ##
## Comments and likes are greatly appreciated. ##
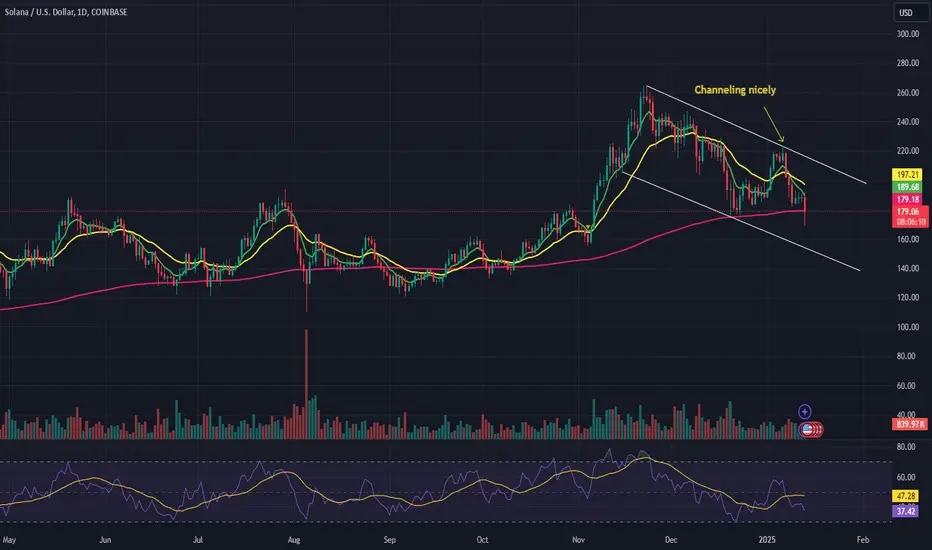
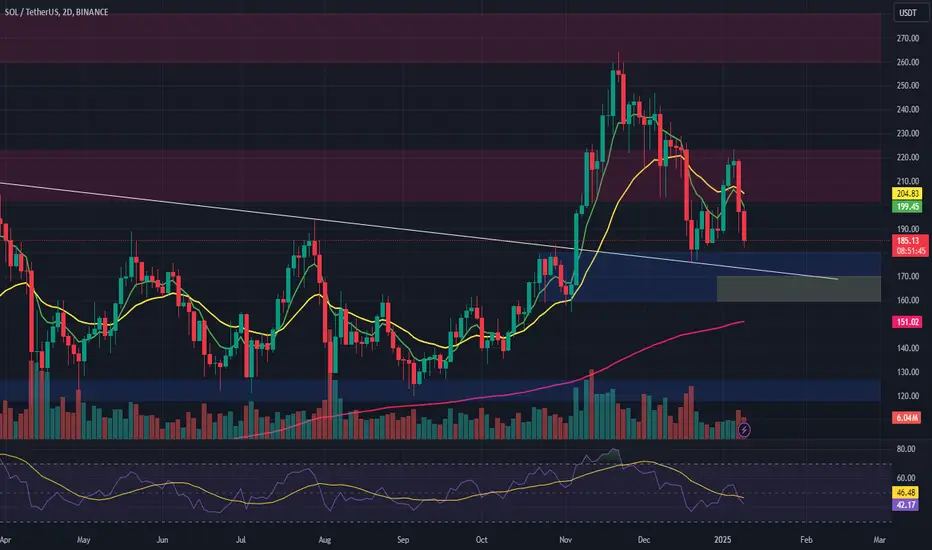
Solana (SOL/USD) – Bullish Technical Setup AnalysisPrice Action Recap:
Strong bounce off the $180 support level confirms its critical role as a floor for Solana.
The uptrend remains intact, with Solana forming higher lows and highs within an ascending channel.
Recent pullbacks showed strong buying interest at the lower trendline, suggesting dominance by the bulls.
Key Levels to Watch:
Support Zone:
$180: A crucial level that has held multiple times, acting as a floor for the price. A strong bounce here indicates continued bullish momentum.
Break below $180: If this support fails, the bullish outlook would be in jeopardy, and the price could shift to retest lower levels.
Resistance Zones:
$220-$230: First target zone, aligning with previous highs, where the price could face some resistance.
$250: Potential extension zone, derived from the measured move of the ascending channel, if the uptrend continues unabated.
Market Implications:
Bullish Continuation: If Solana continues to hold above $180 and momentum persists, there’s potential for a continued rally toward the $220-$250 range.
Bearish Scenario: A break below $180 would require a reassessment of the bullish outlook and could prompt a deeper correction, testing lower support levels.
Outlook:
Bullish Scenario: Solana could move toward the $220-$230 range, and with sustained momentum, may reach $250.
Bearish Scenario: A loss of $180 would shift the outlook to a more neutral or bearish stance, and potential downside targets could be below this support zone.
Conclusion:
Solana's uptrend remains strong, supported by $180. The $220-$230 zone is the next key resistance area. A break above this would confirm the continuation of bullish momentum, while a break below $180 would require caution and re-evaluation of the market dynamics.
Will SAND Make a Comeback or Sink Lower? Yello, Paradisers! Are you ready for what could be a make-or-break moment for SAND? Let’s dive into the details to ensure you don’t get caught on the wrong side of the market.
💎#SANDUSDT is approaching a key support level at $0.4787, a zone that has historically acted as a springboard for bullish momentum. This level has been tested multiple times, showcasing its strength. However, if this support fails to hold, it could trigger a wave of selling pressure, potentially dragging the price down to the next significant demand zone at $0.3754.
💎If SAND manages to hold above the 100-day EMA and regains bullish momentum, a retest of the $0.7463 resistance zone becomes highly likely. A successful breakout above this level could pave the way for a rally toward $1.00 or higher.
💎Volume is another critical factor to monitor. A rebound from the $0.4787 support level accompanied by strong buying interest could signal a quick bullish reversal. On the other hand, a breakdown below $0.3754 with increasing volume would likely intensify selling pressure.
💎This is a pivotal moment for #SANDUSD, Paradisers. The market is setting up for a decisive move, one that could shake out weak hands before the real trend emerges.
Stay patient, wait for confirmation, and always manage your risk. Trading isn’t about being emotional; it’s about being strategic. Only those who remain disciplined and focused will succeed in the long term.
MyCryptoParadise
iFeel the success🌴
Which way ADA: Break down or Sideway...sIf you find this information inspiring/helpful, please consider a boost and follow! Any questions or comments, please leave a comment!
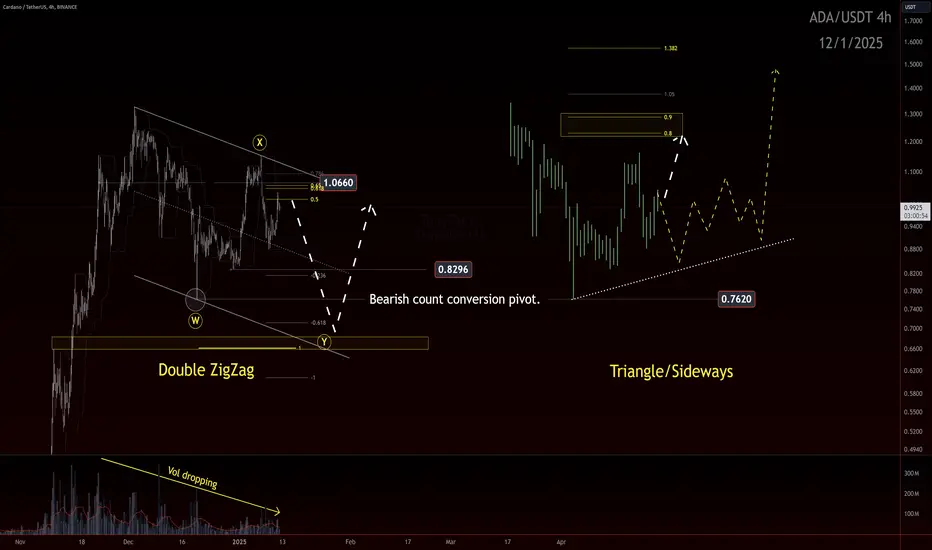
ADA Pattern Analysis: Key Levels and Scenarios
$1.20 Rejected Before Reaching
Cardano (ADA) recently made an attempt to push higher but failed to reach the $1.20 resistance level, resulting in a rejection. This rejection highlights $1.20 as a key barrier for the bulls. A successful break above this level in the future will likely require significant momentum and increased volume to confirm a continuation of the uptrend.
Move Up Didn’t Hit the 80% Retrace → Flat/2x3 Ruled Out
The recent upward move failed to reach the 80% retracement level, effectively ruling out the possibility of a flat correction or a 2x3 pattern. These structures typically require a deeper retracement to remain valid. With these possibilities eliminated, attention shifts to other likely scenarios that fit the current price action.
Likely X of 2xZZ or B of a Triangle/1 of Diagonal
The failure to hit the 80% retracement brings a few potential patterns into focus:
X of a Double Zigzag (2xZZ): ADA could be forming a complex corrective structure, with the current move acting as another actionary wave to a most likely break of the W pivot. X waves can be anything, depending, but a ZigZag is the most likely.
B of a Triangle: The price action may reflect a triangle formation, with ADA consolidating within a bounded structure before resolving either upward or downward.
1 of a Diagonal: The possibility of a Ending diagonal suggests the end of a trend.
$0.76 (BCC) Critical
The $0.76 level has emerged as the Bearish Count Confirmation/Conversion (BCC), a critical pivot for determining the pattern printing. Holding above $0.76 indicates that ADA is likely entering a sideways consolidation phase, building a base for the next significant move. A break below this level would signal potential weakness, invalidating some of the bullish scenarios and shifting the bias toward a more bearish outlook.
Conclusion
The $1.20 resistance rejection underscores the need for stronger momentum to break higher, while the $0.76 level serves as a key support. Observing price action at these levels will help determine whether ADA is in an X wave of a double zigzag, a B wave of a triangle, or the early stages of a diagonal.
Patience is key as these patterns develop.
Trade safe, trade smart, trade clarity.
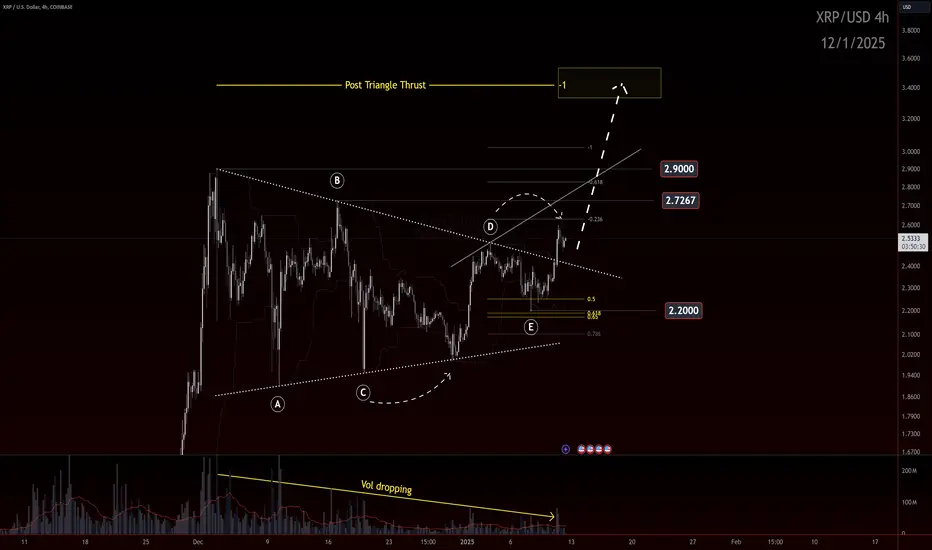
XRP: Post-Triangle Thrust in Play?If you find this information inspiring/helpful, please consider a boost and follow! Any questions or comments, please leave a comment!
XRP continues to hold up better than most assets in the current market, showing strength despite overall volatility. Based on the analysis of a potential triangle pattern, it appears XRP could be entering a Post-Triangle Thrust (PTT) phase, with a projected target above $3.
Key Levels to Watch
For this PTT scenario to unfold, XRP must break through critical pivot levels and maintain its position above them. On the chart, $2.20, $2.72, and $2.90 are pivotal areas of interest. A successful breach and hold of these higher levels would further validate the bullish outlook.
Additionally, the trend lines highlighted in the chart, which XRP has reacted to multiple times in the past, remain crucial. The upper trend line will need to hold as support to sustain the bullish momentum.
Volume Trends
One notable aspect of the current price action is the declining volume, as shown on the chart. While this is typical during a consolidation phase, increased volume would provide stronger confirmation of a breakout. Higher volume on a decisive move would signal greater market participation and conviction in the direction of the trend.
Conclusion
The potential for XRP to hit the $3 range hinges on its ability to break and hold above key levels, supported by stronger volume and respect for trend lines. Next week will be critical in determining whether this Post-Triangle Thrust plays out as anticipated. For now, all eyes are on the pivots, retrace, and market sentiment.
Trade safe, trade smart, trade clarity.
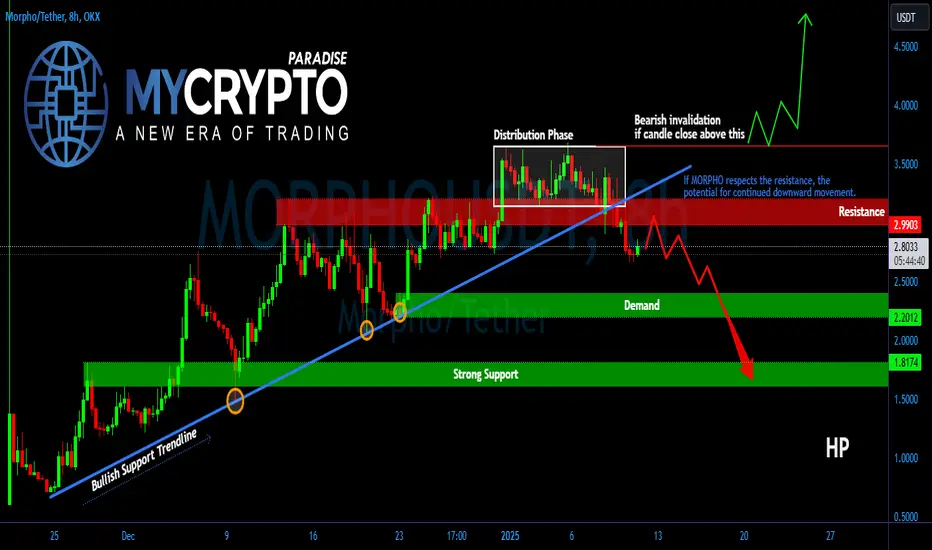
Bearish Warning for MORPHOUSDT! Is a Bigger Drop Coming?Yello, Paradisers! Could #MORPHOUSDT be setting up for a bigger drop, or is it just a short-term pullback? Let's break it down.
💎#MORPHO recently broke its bullish support trendline, which is a clear bearish signal. However, before we see further downside, there’s a high chance the price will retest the $2.90 to $3.10 resistance zone. This is a key area to watch.
💎If the price gets rejected at that resistance, the most likely scenario is a continued move downward toward the demand zone around $2.30 to $2.20. This demand area may cause a brief pullback, but if it fails to hold, we could see the price drop further to the stronger support zone below.
💎For the bearish outlook to be invalidated, the price would need to break above $3.66 and close a daily candle above it. If that happens, we’ll likely see a bullish continuation instead of further downside.
💎This is a critical moment for MORPHOUSDT. Be patient and wait for confirmation before making any moves. Remember, the market often tricks impatient traders before revealing its true direction.
Stay patient, stay disciplined. The next big move will reward those who wait for confirmation.
MyCryptoParadise
iFeel the success🌴
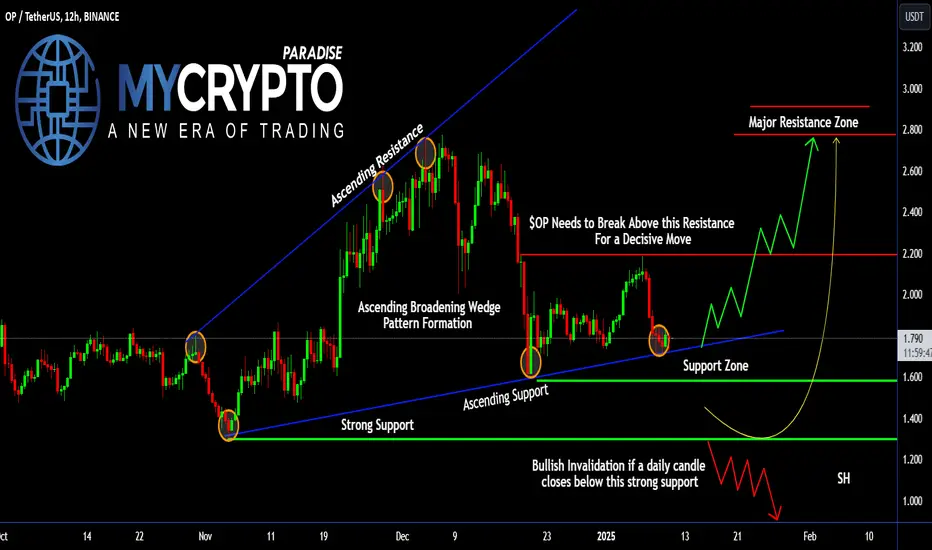
Can #OP Bulls Defend this Key Levels or Not? Key Levels to WatchYello, Paradisers! Will #OPUSDT finally break free or are we about to see a deeper pullback? Let’s analyze the current #Optimism setup:
💎#OP is currently forming an ascending broadening wedge pattern, which often signals indecision but can result in a strong breakout or breakdown. The price is approaching a key resistance zone at $2.191, a level it must break decisively for bullish momentum to continue.
💎A confirmed daily close above this resistance would open the door for a rally toward the major resistance area between $2.800 and $3.000, where significant selling pressure could emerge. For this move to sustain, watch for strong volume and momentum to validate the breakout.
💎On the downside, #OPUSD is leaning heavily on the ascending support near $1.791, with a broader support zone sitting between $1.584 and $1.300. This area has proven to be a reliable base during recent declines, providing the liquidity needed for buyers to defend the trend.
💎However, if NASDAQ:OP closes a daily candle below $1.300, the bullish structure will break down, likely leading to a deeper retracement toward $1.000 or lower levels, signaling a shift in market sentiment.
Stay focused, patient, and disciplined, Paradisers🥂
MyCryptoParadise
iFeel the success🌴
Market Volatility: The Trade That Taught Me PatienceEarly on, I thought I could outsmart market volatility. I’d jump into trades during big moves, hoping to catch the wave. But one day, it caught me instead.
The Day Volatility Got Me
I remember trading during a news event. The market spiked in my direction, and I got excited. I moved my stop-loss higher to give the trade “room to run.” Then, out of nowhere, the market reversed. My gains disappeared, and I ended up with a bigger loss than I could afford.
That trade taught me that volatility is unpredictable—and dangerous if you’re not prepared.
What Volatility Did to Me
-Tempted me to chase moves: I couldn’t resist jumping in, even when it wasn’t smart.
-Shook my confidence: The wild swings made me doubt my plan.
-Made me emotional: I panicked when things didn’t go as expected.
How I Fixed It
I stopped trading during news events unless it fit my strategy. I started using stop-losses and stuck to them, no matter what. And I reminded myself that no single trade is worth blowing my account.
What I Learned
-Volatility is part of trading—embrace it, but don’t let it control you.
-A solid strategy and risk management are your best defenses.
-Patience pays off when the market gets wild.
Struggling with market volatility? DM me—I’ve been there and can help. I also have a webinar this Sunday to help you tackle this challenge and stay grounded.
Kris/Mindbloome Exchange
Trade What You See
Trading Under Pressure: When Emotions Take OverThere was a time when the pressure of trading got to me. The market moved fast, and I felt like I had to act quickly or miss out. Fear, greed, and panic ruled my decisions instead of logic.
The Day Emotions Took Over
I remember one trade vividly. I jumped in because I didn’t want to miss what looked like a sure win. It turned against me, and instead of cutting my losses, I froze. I held on, hoping it would turn around—it didn’t.
By the end of the day, I wasn’t just frustrated with the loss. I was frustrated with myself.
What Emotional Trading Did to Me
-Clouded my thinking: Fear stopped me from taking good trades.
-Chased losses: Greed pushed me into setups that weren’t part of my plan.
-Made everything feel heavier: Every loss hit harder, and I felt stuck.
How I Turned It Around
I started journaling my trades to identify patterns. When I felt fear or greed, I’d take a moment to breathe and refocus. Slowly, I learned to trust my strategy, not my emotions.
What I Learned
-Trading is as much mental as it is technical.
-Reacting emotionally doesn’t work—it’s a fast track to mistakes.
-Staying calm and focused leads to better decisions.
If trading feels overwhelming or your emotions are taking control, you’re not alone. DM me—I’ve been there and can help. I also have a webinar this Sunday that will help you tackle this challenge.
Kris/Mindbloome Exchange
Trade What You See
SOL Long OpportunityMarket Context:
SOL is experiencing a retracement alongside the broader market, approaching a key support zone that offers a strategic entry for a long spot trade.
Trade Details:
Entry Zone: Between $160 – $170
Take Profit Targets:
$200 – $220
$260 – $280
Stop Loss: Just below $138
This trade leverages SOL's pullback to a critical support area with strong upside potential for continuation. 📈
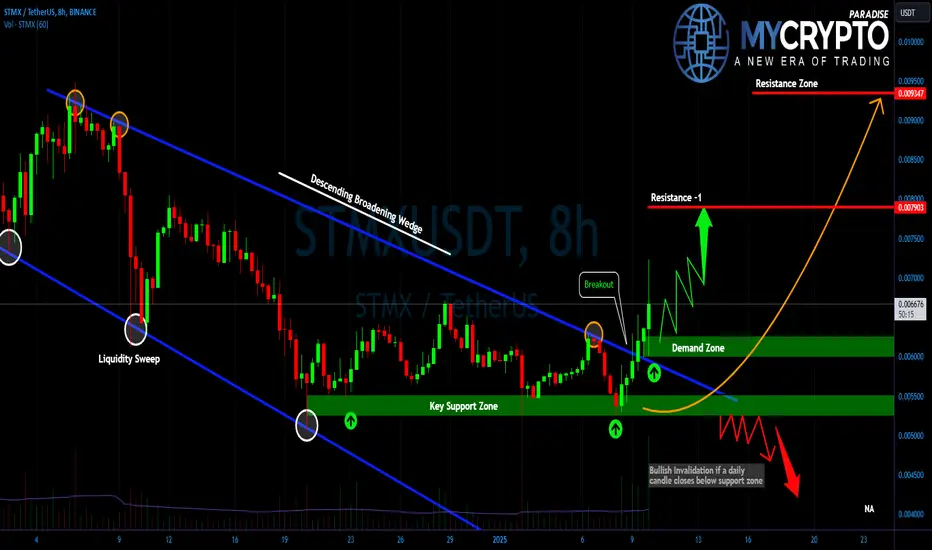
Is #STMX Ready for a Breakout? Don’t Miss This Move!Yello, Paradiser! Are you ready for what’s brewing with #STMX? The setup on the charts could be pointing to a big move don’t miss this critical update!
💎#STMXUSDT is currently displaying a bullish reversal structure that demands attention. A descending broadening wedge, recognized as a bullish pattern, has already confirmed its breakout. Before this breakout, a liquidity sweep near the wedge’s lower boundary suggested stop hunting behavior, a move often followed by significant directional momentum.
💎With the breakout in place, the demand zone between 0.006015 and 0.006256 now plays a pivotal role. This area could act as a springboard for upward momentum, with the price targeting 0.007893as the first resistance level. If bullish momentum persists, the next significant level lies around 0.0093, potentially marking an extended rally.
💎On the downside, if the demand zone fails to hold, it could trigger heightened selling pressure, dragging the price down to support at $0.005270. A close below this level would invalidate the bullish structure and open the door for further declines.
💎Volume remains a critical factor here. A surge in volume would lend confidence to directional moves, while lowvolume breakouts in either direction should be approached with caution, as they are often indicative of fakeouts.
💎The demand zone at $0.006015 offers a logical area for risk defined entries, aligning with the overall bullish continuation thesis. While the current outlook favors a gradual advance toward resistance levels, traders must stay vigilant for potential macroeconomic shocks or sudden market reversals.
Trade smart and keep your focus on the bigger picture!
MyCryptoParadise
iFeel the success🌴
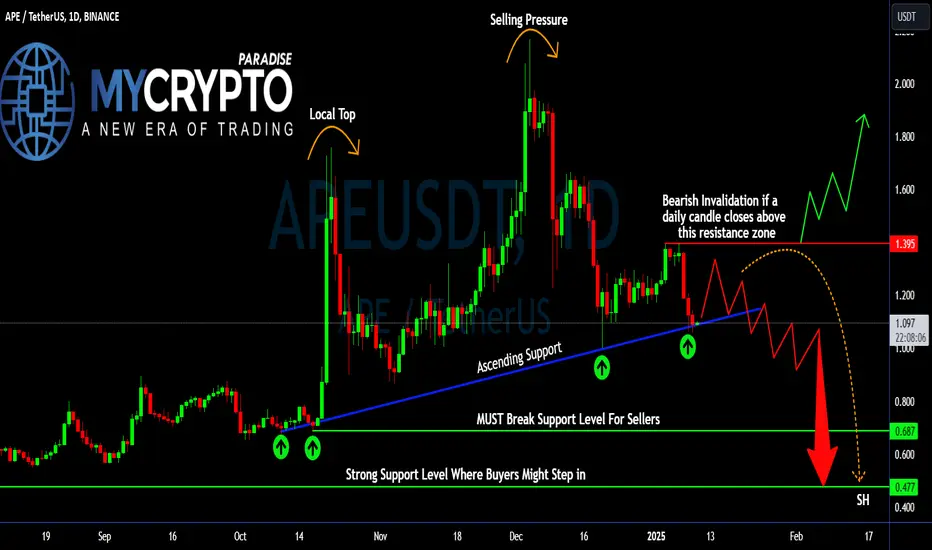
Can #APE Bulls Defend this Key Level or Not? Bears in ControlYello, Paradisers! Are we on the verge of a massive breakdown for #APEUSDT, or will the bulls reclaim control and surprise everyone? Let’s break down the #ApeCoin setup:
💎#APE has been under pressure since hitting a local top near the $2.00 region. Strong selling pressure has taken over, driving the price lower and putting the ascending support line, which has held since October, into question. This trendline is now critical for bulls, as a breakdown below could trigger a significant shift in market sentiment.
💎The immediate support level at $1.09 is acting as a psychological and technical barrier. However, if this level fails to hold, the price could drop rapidly toward the strong support zone around $0.68. This area aligns with historical demand levels and could attract buyers looking for value, but failure to find support here would expose #APEUSD to even lower levels, with $0.477 emerging as the next likely target.
💎On the bullish side, reclaiming the $1.40 resistance zone is essential to invalidate the bearish outlook. A daily close above this level would signal that bulls are regaining strength, potentially paving the way for a rally toward $1.80 and beyond. Until then, however, the bias remains bearish and bears seem in control.
Stay focused, patient, and disciplined, Paradisers🥂
MyCryptoParadise
iFeel the success🌴
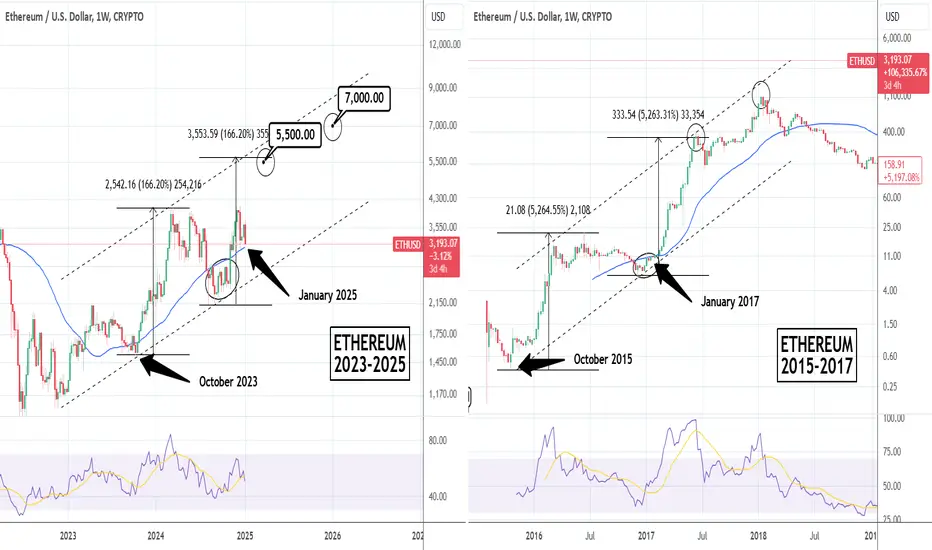
ETHUSD: Almost oversold, 2017 is the guide.Ethereum is approaching an oversold 1D technical outlook (RSI = 38.630, MACD = -47.400, ADX = 39.653) as the 1W candle is pulling back with a force to the 1W MA50. During the 2015-2017 Bull Cycle, on January 2017, ETH was starting the new bullish wave of its Channel Up after a weekly consolidation under the 1W MA50. The situation is identical today as the September-October 2024 consolidation under the 1W MA50 paved the way for the current bullish wave.
Both Cycles traded inside Channel Up patterns with the bullish waves in 2015- 2017 being identical at +5,264%. If the current wave is as strong as the first one, we should see a +166.20% rise (TP = 5,500). The top at the end of the Cycle can be close to 7,000.
## If you like our free content follow our profile to get more daily ideas. ##
## Comments and likes are greatly appreciated. ##
Critical Trendline Test Will BTC Bounce or Break ?
1. Trendline Support: The price is approaching a key ascending trendline, which has acted as support previously. A bounce from this area could signal a continuation of the uptrend.
2. Price Action: The recent sharp drop in price suggests selling pressure, likely testing the strength of the trendline and the marked support zone (around $91,500–$89,700). If this zone holds, it could provide a buying opportunity.
3. Risk/Reward Setup: The shaded areas highlight a possible trade setup:
Stop-Loss: Below the support level (around $89,700) to manage downside risk.
Target: Around $102,258, suggesting a potential bullish recovery toward resistance levels.
4. Scenario Analysis
Bullish: If the price bounces off the trendline, it could aim for a higher level, confirming the continuation of the broader uptrend.
Bearish: A breakdown below the trendline and support zone could invalidate the bullish setup, opening the way for further downside toward $86,000 or lower.
To confirm the direction, monitor additional indicators such as RSI for oversold conditions, volume for buying strength, or moving averages for trend confirmation. Let me know if you'd like further clarification or analysis!

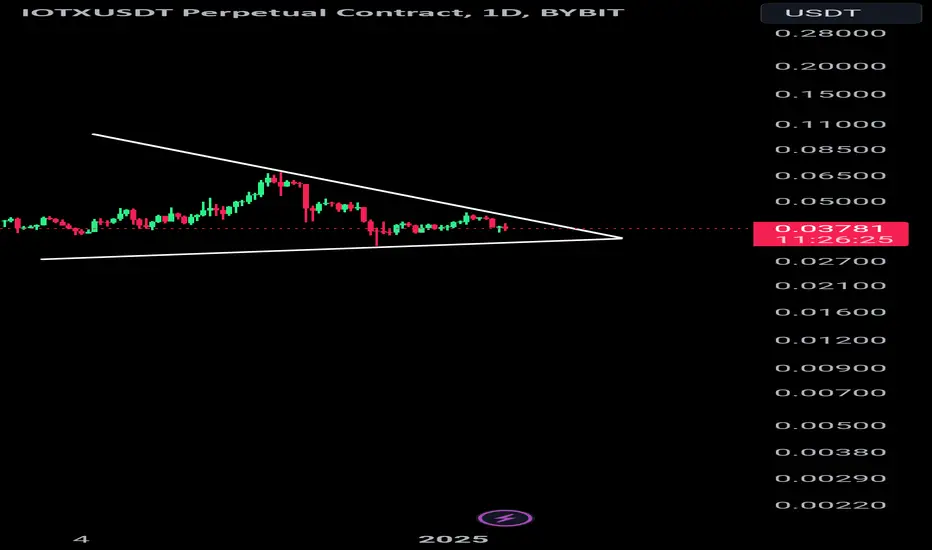
IOTX/USDT on the Edge Will the Triangle Break ?IOTX/USDT Technical Analysis Symmetrical Triangle Breakdown in Sight
Key Insights
Symmetrical Triangle Pattern: Price has been consolidating within a symmetrical triangle, creating lower highs and higher lows, signaling a potential breakout.
Critical Support Zone: The price is currently testing the lower trendline at $0.0378.
Bearish Scenario: A breakdown below this trendline support will trigger a short opportunity, aligning with the bearish market sentiment.
Target Levels
Primary target: $0.0300
Final target: $0.0250
Monitor closely for a breakdown confirmation. A close below support with increased volume could validate a downward move. Managing stop-losses above $0.0450 upper triangle boundary is recommended to mitigate risk.
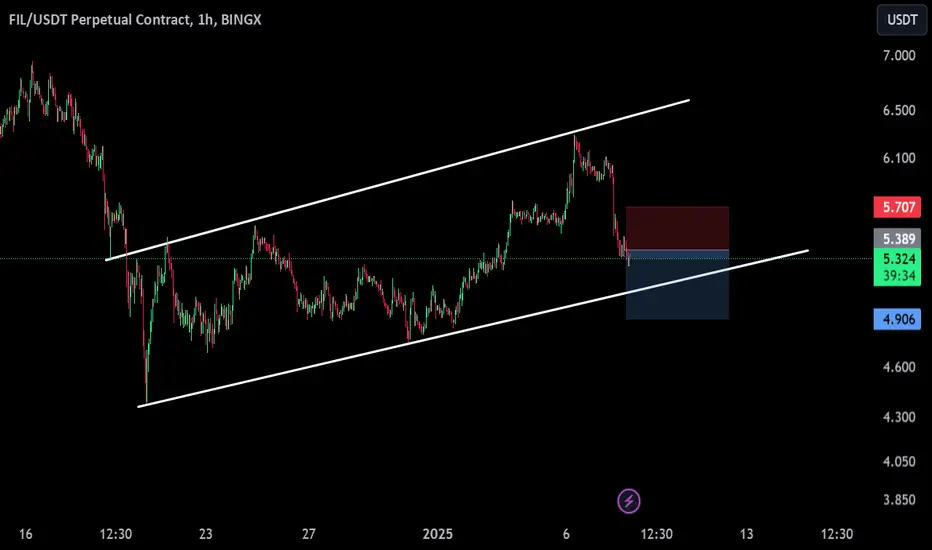
FIL/USDT Short Setup on Rising Channel BreakdownThis chart showcases a short position on FIL/USDT after a breakdown from a rising channel pattern. The price respected the upper and lower boundaries of the channel before breaking below the support, signaling a potential bearish continuation.
Key Levels
Entry Price: Around 5.39 (near the channel breakdown point)
Stop Loss: Set at 5.59 (above recent resistance)
Take Profit Target: Approximately 4.73 (aligned with prior support and pattern projection)
Technical Insights
Rising Channel Pattern: Generally bearish when a breakdown occurs, indicating a loss of bullish momentum.
Bearish Confirmation: A strong downside move with momentum below the lower trendline enhances the validity of this setup.
Risk-to-Reward Ratio: The setup offers a good R:R, making it an efficient short trade opportunity if market conditions align.
Traders can watch for further confirmation, such as volume spikes or retests of broken support levels acting as resistance, before adding to their positions.
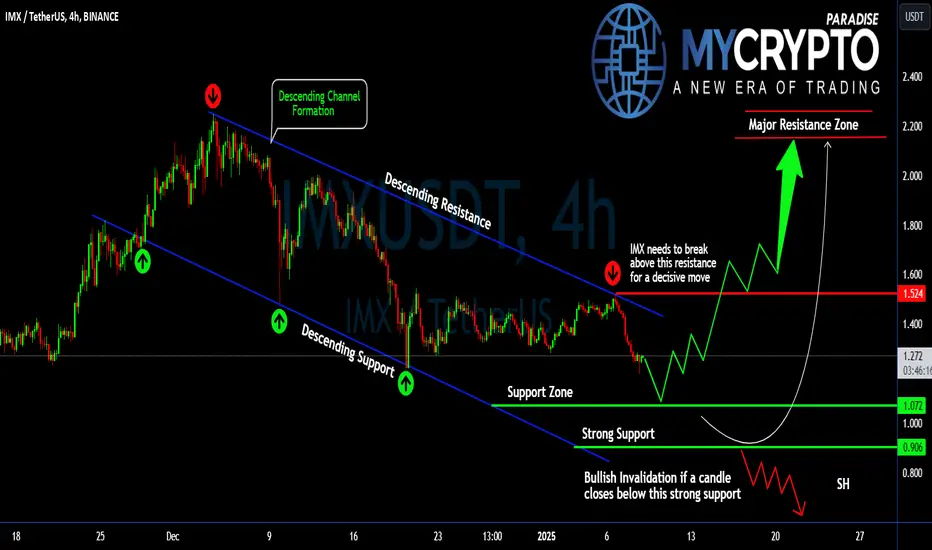
Will #IMX Bulls Get Enough Momentum For a Bullish Reversal?Yello, Paradisers! Is #IMXUSDT ready to make a decisive move, or are we in for more consolidation? Let’s dive into the key levels of #Immutable:
💎#IMX has been trading within a descending channel on the 4-hour timeframe, creating a classic pattern of lower highs and lower lows. #IMXUSD got rejected from the descending resistance at $1.52 and is going to lower levels for liquidity capture.
💎For a bullish breakout, #IMX needs to push above the descending resistance near $1.524. A confirmed close above this level would pave the way for a potential rally toward the $2.000–$2.200 major resistance zone, where sellers are likely to step in. This scenario hinges on strong bullish momentum and volume so you can watch these for confirmation.
💎If #Immutable cannot get enough momentum to breach above the descending resistance then the probability is high that it will go lower for support. The support zone between $1.072 and $0.906 is crucial. This level has held firm during recent declines, providing a solid base for price action. The bulls have previously stepped here on these levels and defended them.
💎However, if #IMXUSDT breaks below $0.906 and closes a candle below this strong support, the bullish outlook will be invalidated. In this case, #IMX could retest lower levels, with the next key zone around $0.800 or lower, signaling a significant shift in market sentiment.
Stay focused, patient, and disciplined, Paradisers🥂
MyCryptoParadise
iFeel the success🌴
SOLUSD: Rejection on the 1D MA50 turning to a buy opportunity.Solana turned bearish on its 1D technical outlook (RSI = 43.075, MACD = -3.090, ADX = 38.836) as it got heavily rejected yesterday on the 1D MA50. The price approached the 0 Fibonacci level which is the top of the bottom zone of the Channel Up. Technically as long as the 1D MA200 is intact, the pattern is intact and the trend remains bullish. Since the price is this close to the bottom, this 1D MA50 rejection has turned into the best buy opportunity for the short term. Once the 1D RSI dips a little lower, it will be identical to all prior RSI bottoms of the Channel Up. This is worth turning bullish right now, we are aiming for the 0.786 Fibonacci level (TP = 340.00).
## If you like our free content follow our profile to get more daily ideas. ##
## Comments and likes are greatly appreciated. ##

My Fitness Journey: How Hitting the Gym Upped My Trading GameThere was a time in my trading journey when I thought that focusing solely on numbers, charts, and the next big trade was the way to go. But honestly, I was burning out, feeling foggy, and my health was taking a backseat. That all changed when I decided to swap my late-night snacks for a gym membership.
The Day It Hit Me: I'll be real with you; I started working out not for the six-pack but because I needed to clear my head and get some energy back. And wow, did it ever transform my trading game. I've got the charts to prove it - my trading performance before and after getting fit. Before, I was missing opportunities, getting stressed, and making rash decisions. Now, I'm more alert, my timing's spot-on, and my risk management? It's like night and day.
What Being Out of Shape Does to You I did some digging, and there's actual science behind why this works. Exercise gets your brain firing on all cylinders, making you better at those quick, critical decisions we face every trading day. It's not about becoming a bodybuilder; it's about getting your blood pumping to where it counts - especially your brain.
How I Got My Groove Back I'm not saying you need to live at the gym. My routine's simple; I do what I can even while the markets are buzzing. A quick morning workout or some stretches during lunch breaks has made all the difference. It’s all about finding that sweet spot, where you're not just a trader but a healthy human being too.
What I Learned from All This This journey's been an eye-opener. I realized that being a good trader isn't just about knowing the market; it's about knowing yourself. This wasn't just about sharing data; it was about sharing a piece of my life, hoping it echoes with you. It's sparked so many chats because, let's be real, we all struggle with keeping our health in check while chasing those green candles.
Are You Trading While Unfit? The timing was perfect. With everyone talking about burnout and how to stay sharp, my story about how fitness upped my trading game felt like a message that needed to be out there. Whether you're into stocks, crypto, or forex, here's the deal - your health directly impacts your wealth.
If you’re stuck or want to chat about juggling trading with a healthy lifestyle, hit me up with a DM. I’ve walked this path, and I’m here to lend a hand!
Kris/Mindbloome Exchange