ETH 50MA Reclaims 0.5 FibInteresting take on ETH daily using just the 50MA and Fib levels.
Notice how the 50MA has interacted with the Fib levels since June 2021.
In May 2025, the 50MA crossed below the 0.618 Fib level, marking the bottom of the December 2024 drop.
The 0.5 Fib acted as support in October 2024 during the double top formation at the 0.236 Fib.
Now, the 50MA has crossed back above the 0.5 Fib.
As long as price holds above this 0.5 Fib level, the odds of further upside remain stronger.
Always take profits and manage risk.
Interaction is welcome.
Cryptotrading

Bitcoin: 170k–180k?If you find this information inspiring/helpful, please consider a boost and follow! Any questions or comments, please leave a comment!
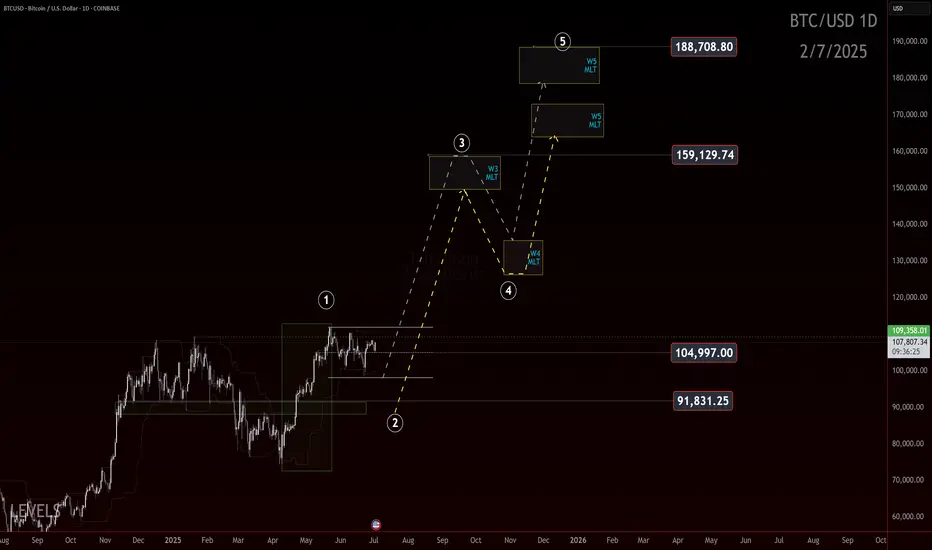
Bitcoin: 170k to 180k?
Let’s talk bias.
We’ve seen a powerful move off the 75k low, and it’s hitting some markers of a potential wave 1 impulse. If that structure holds and price doesn’t come back to wipe out the lows in a wave 2 retracement, then this is what we’d be looking at.
The idea? This is a conservative roadmap built off Elliott Wave Fibonacci projections and it targets the 170k to 180k zone.
Now, let’s be clear. This is a conservative projection. We’re not talking hopium fueled 250k moon targets here. We have no proof of that yet. We're anchoring the wave count and saying: if this is a 1, we’re due a 2, and then a 3 takes us to the upper levels.
But there’s a catch. Always is.
If price starts to fade back through the 91.8k area in a deep aggressive retrace, this roadmap gets less likely. Breaking the 75k pivot means the impulse structure failed or was misread, and we shift the count.
Until then, the 170k–180k level is a possible destination based on this roadmap.
Trade Safe!
Trade Clarity!
Sol searching, for an entry. If you find this information inspiring/helpful, please consider a boost and follow! Any questions or comments, please leave a comment!
The Elliottician’s Paradox: 12-12 or Zigzag? Bias Is the Key
Ever stare at a chart and ask, “Is that a 12-12 or a classic zigzag?” Yeah… welcome to the paradox we Elliotticians live in. Pattern recognition’s a blessing and a curse because context is everything, but confidence can get you wrecked.
This one’s got me on the edge.
What’s Happening Here
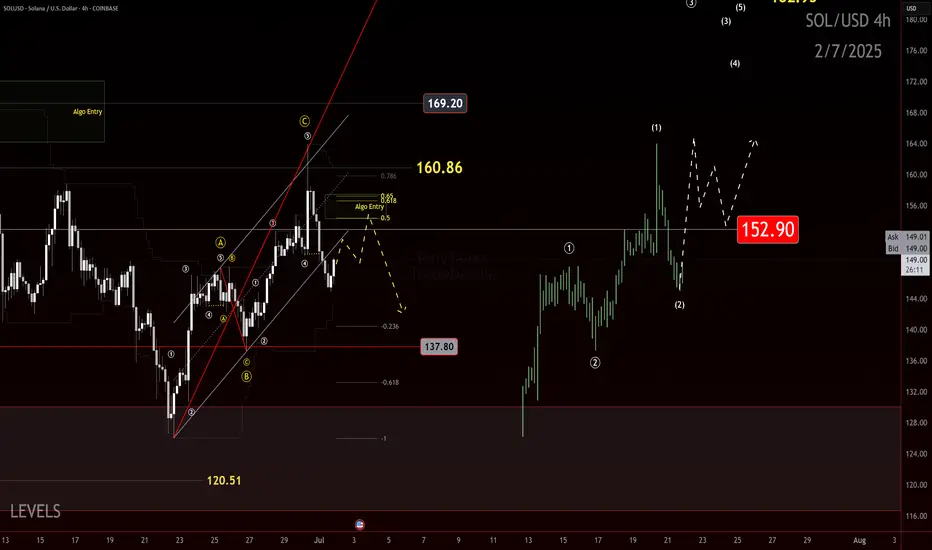
We’re currently watching a move that could be either:
- A corrective zigzag (5-3-5), or
- A 1-2, 1-2 setup, gearing up for a blastoff
That’s the core dilemma — two valid options, both technically legal. So what tips the scales? Bias.
The Line in the Sand: 152
Here’s what I’m watching for:
Key Level: 152
- That’s the bull/bear line for me.
- A strong impulsive reclaim above 152 flips the script. I’d reconsider the bearish view if price surges with intent.
- But if we return to 152 in a sluggish, corrective way? I’ll be eyeing continuation lower, aligned with a more traditional zigzag structure.
Elliott View
This is where the paradox plays out:
If we’re looking at a 1-2, 1-2 setup, expect:
- A powerful Wave 3 soon (should not be shy)
If it’s a Zigzag ABC:
- Then we should expect a corrective internal retracement and continuation to the down side, at minimum past the origin of the initial move.
The chart will speak loudest. But structure and strength of this next leg will confirm the story.
Final Thoughts
Trading isn’t about being right. It’s about managing scenarios — and this one’s a classic fork-in-the-road moment. I’ve got a plan for both directions.
152 is my trigger. Stay below it and fade the rally. Break above it impulsively, and I’ll flip my bias with it.
The Elliottician’s paradox isn’t a trap — it’s an invitation to stay sharp.
Your Turn
How are you reading this structure? Do you favor the zigzag or the 1-2 setup? Drop a comment and let me know.
Trade safe, trade clarity!
Ethereum - This structure decides everything!Ethereum - CRYPTO:ETHUSD - trades at a key structure:
(click chart above to see the in depth analysis👆🏻)
After Ethereum retested the previous all time high in the end of 2024, we saw quite a harsh move lower. This move was followed by an expected recovery, however Ethereum is still trading below a key structure. Either move is still possible and will shape the future of Ethereum.
Levels to watch: $2.500, $4.000
Keep your long term vision!
Philip (BasicTrading)

Quantitative Trading Models in Forex: A Deep DiveQuantitative Trading Models in Forex: A Deep Dive
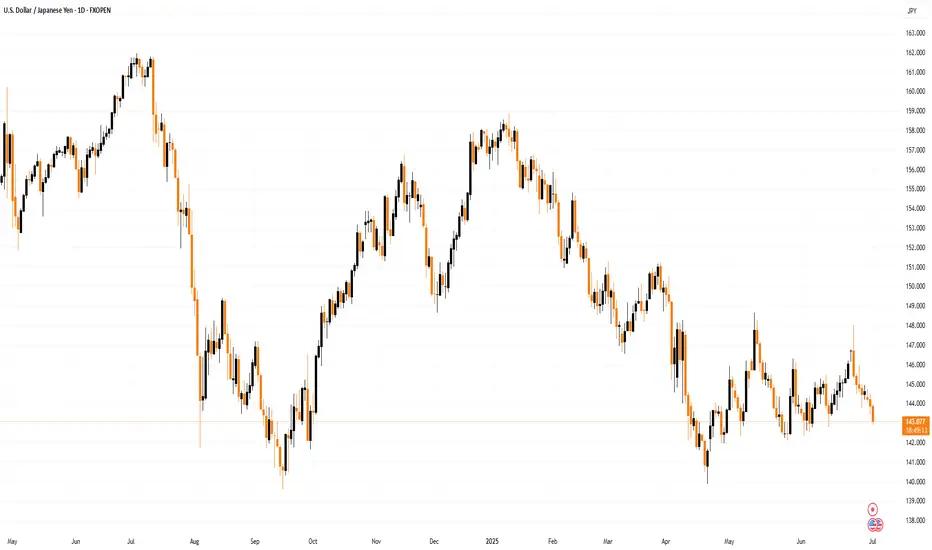
Quantitative trading in forex harnesses advanced algorithms and statistical models to decode market dynamics, offering traders a sophisticated approach to currency trading. This article delves into the various quantitative trading models, their implementation, and their challenges, providing insights for traders looking to navigate the forex market with a data-driven approach.
Understanding Quantitative Trading in Forex
Quantitative trading, also known as quant trading, in the forex market involves using sophisticated quantitative trading systems that leverage complex mathematical and statistical methods to analyse market data and execute trades. These systems are designed to identify patterns, trends, and potential opportunities in currency movements that might be invisible to the naked eye.
At the heart of these systems are quantitative trading strategies and models, which are algorithmic procedures developed to determine market behaviour and make informed decisions. These strategies incorporate a variety of approaches, from historical data analysis to predictive modelling, which should ensure a comprehensive assessment of market dynamics. Notably, in quantitative trading, Python and similar data-oriented programming languages are often used to build models.
In essence, quantitative systems help decipher the intricate relationships between different currency pairs, economic indicators, and global events, potentially enabling traders to execute trades with higher precision and efficiency.
Key Types of Quantitative Models
Quantitative trading, spanning diverse markets such as forex, stocks, and cryptocurrencies*, utilises complex quantitative trading algorithms to make informed decisions. While it's prominently applied in quantitative stock trading, its principles and models are particularly significant in the forex market. These models are underpinned by quantitative analysis, derivative modelling, and trading strategies, which involve mathematical analysis of market movements and risk assessment to potentially optimise trading outcomes.
Trend Following Models
Trend-following systems are designed to identify and capitalise on market trends. Using historical price data, they may determine the direction and strength of market movements, helping traders to align themselves with the prevailing upward or downward trend. Indicators like the Average Directional Index or Parabolic SAR can assist in developing trend-following models.
Mean Reversion Models
Operating on the principle that prices eventually move back towards their mean or average, mean reversion systems look for overextended price movements in the forex market. Traders use mean reversion strategies to determine when a currency pair is likely to revert to its historical average.
High-Frequency Trading (HFT) Models
Involving the execution of a large number of orders at breakneck speeds, HFT models are used to capitalise on tiny price movements. They’re less about determining market direction and more about exploiting market inefficiencies at micro-level time frames.
Sentiment Analysis Models
These models analyse market sentiment data, such as news headlines, social media buzz, and economic reports, to gauge the market's mood. This information can be pivotal in defining short-term movements in the forex market, though this model is becoming increasingly popular for quantitative trading in crypto*.
Machine Learning Models
These systems continuously learn and adapt to new market data by incorporating AI and machine learning, identifying complex patterns and relationships that might elude traditional models. They are particularly adept at processing large volumes of data and making predictive analyses.
Hypothesis-Based Models
These models test specific hypotheses about market behaviour. For example, a theory might posit that certain economic indicators lead to predictable responses in currency markets. They’re then backtested and refined based on historical data to validate or refute the hypotheses.
Each model offers a unique lens through which forex traders can analyse the market, offering diverse approaches to tackle the complexities of currency trading.
Quantitative vs Algorithmic Trading
While quant and algorithmic trading are often used interchangeably and do overlap, there are notable differences between the two approaches.
Algorithmic Trading
Focus: Emphasises automating processes, often using technical indicators for decision-making.
Methodology: Relies on predefined rules based on historical data, often without the depth of quantitative analysis.
Execution: Prioritises automated execution of trades, often at high speed.
Application: Used widely for efficiency in executing repetitive, rule-based tasks.
Quantitative Trading
Focus: Utilises advanced mathematical and statistical models to determine market movements.
Methodology: Involves complex computations and data analysis and often incorporates economic theories.
Execution: May or may not automate trade execution; focuses on strategy formulation.
Application: Common in risk management and strategic trade planning.
Implementation and Challenges
Implementing quantitative models in forex begins with the development of a robust strategy involving the selection of appropriate models and algorithms. This phase includes rigorous backtesting against historical data to validate their effectiveness. Following this, traders often engage in forward testing in live market conditions to evaluate real-world performance.
Challenges in this realm are multifaceted. Key among them is the quality and relevance of the data used. Models can be rendered ineffective if based on inaccurate or outdated data. Overfitting remains a significant concern, where systems too closely tailored to historical data may fail to adapt to evolving market dynamics. Another challenge is the constant need to monitor and update models to keep pace with market changes, requiring a blend of technical expertise and market acumen.
The Bottom Line
In this deep dive into quantitative trading in forex, we've uncovered the potency of diverse models, each tailored to navigate the complex currency markets with precision. These strategies, rooted in data-driven analysis, may offer traders an edge in decision-making.
*Important: At FXOpen UK, Cryptocurrency trading via CFDs is only available to our Professional clients. They are not available for trading by Retail clients. To find out more information about how this may affect you, please get in touch with our team.
This article represents the opinion of the Companies operating under the FXOpen brand only. It is not to be construed as an offer, solicitation, or recommendation with respect to products and services provided by the Companies operating under the FXOpen brand, nor is it to be considered financial advice.
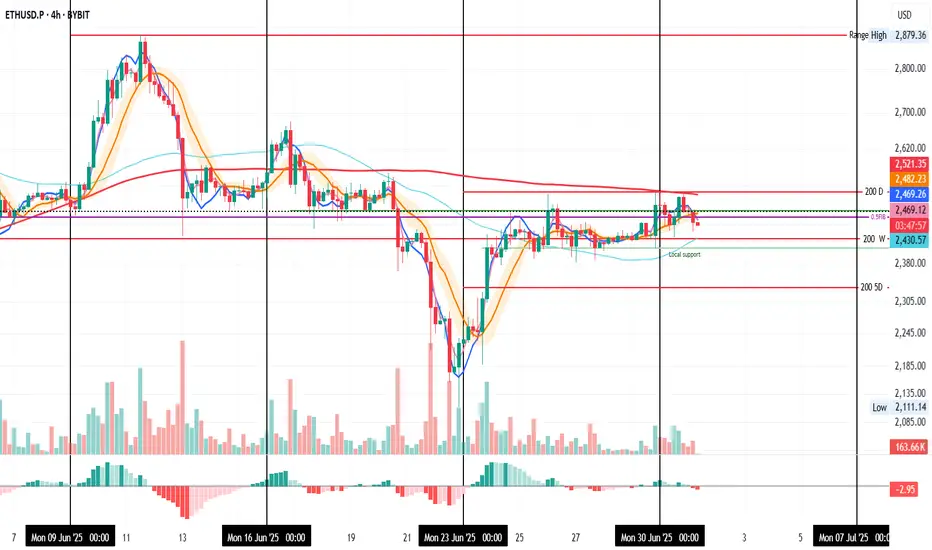
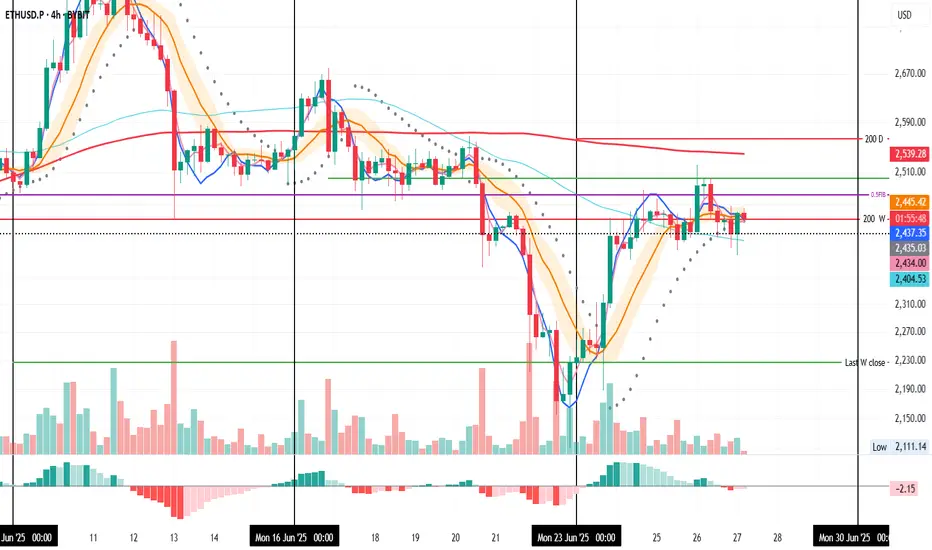
ETH Pushed Back, Support in Sight
ETH on the 4H just closed below the last daily close and the 0.5 Fib again, after getting pushed back from the 4H 200MA and daily 200MA resistance zone.
The next key supports are the weekly 200MA and the local support zone.
Also worth noting: Trump and Musk are stirring things up again. The last time this dynamic appeared, it triggered a selloff a few weeks ago, even before the conflict began.
Always take profits and manage risk.
Interaction is welcome.
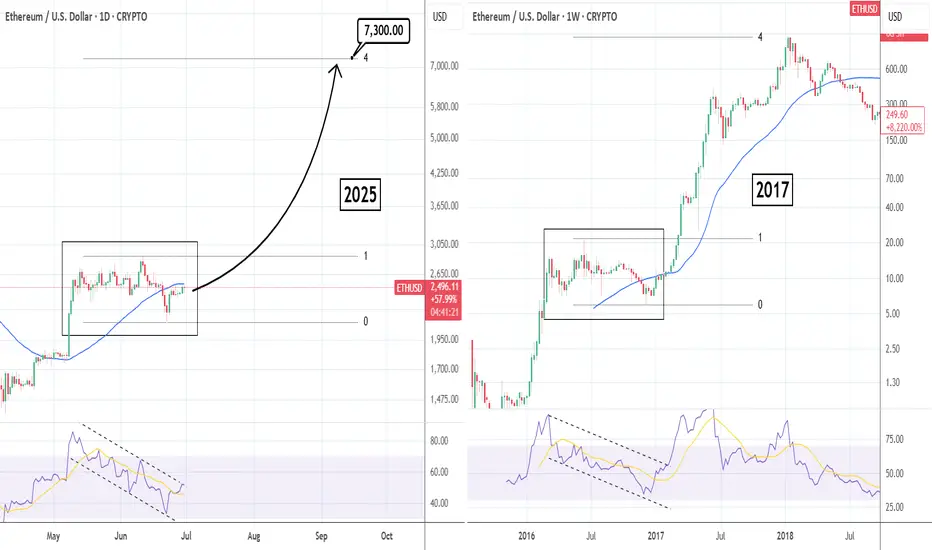
ETHUSD: Parabolic rally similar to 2017 targets $7,300Ethereum is neutral on its 1D technical outlook (RSI = 50.960, MACD = -24.810, ADX = 18.527), attempting to break over the 1D MA50, while still being inside a 6 week consolidation. This is no different than the 2016 consolidation on the 1W chart, that turned out to be just an accumulation pattern before a massive 2017 bullish breakout to the 4.0 Fibonacci extension. Time to go heavily long on ETH with TP = 7,300.
## If you like our free content follow our profile to get more daily ideas. ##
## Comments and likes are greatly appreciated. ##
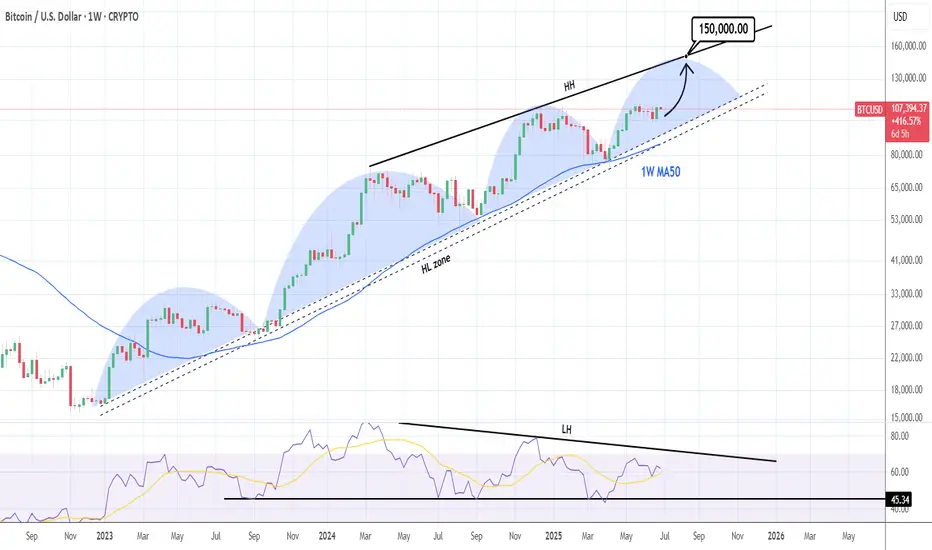
BTCUSD: $150,000 on a repetitive pattern.Bitcoin is neutral on its 1D technical outlook (RSI = 54.823, MACD = 486.400, ADX = 23.402) possibly going through the last consolidation before the next breakout to a new ATH. The whole 2023-2025 Bull Cycle has been on a repetitive pattern, bottoming on the HL Zone and peaking on the HH trendline, while forming clear wave structures. According to this, the next HH should be around 150,000 (TP).
## If you like our free content follow our profile to get more daily ideas. ##
## Comments and likes are greatly appreciated. ##
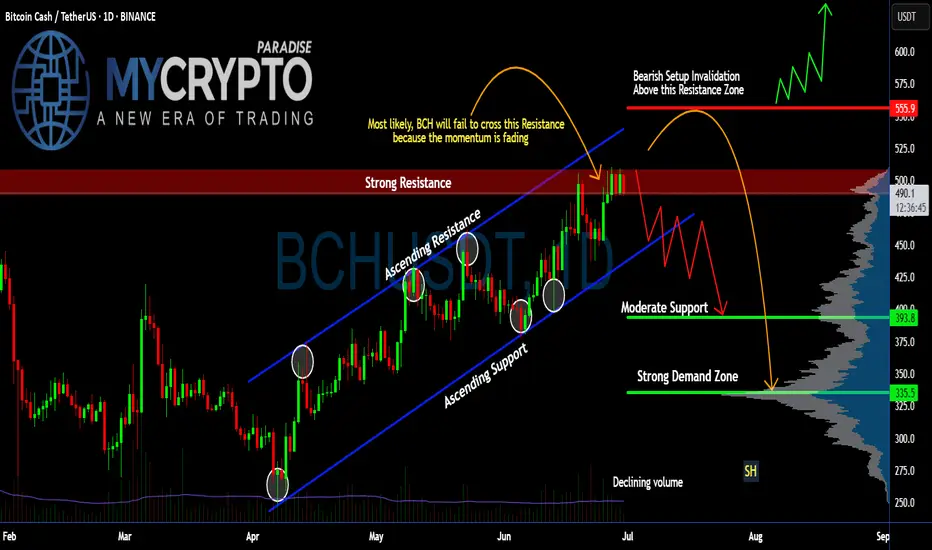
Is #BCH About to Fall or Will it Continue to Rise? Key LevelsYello Paradisers! Have you seen what’s cooking on #BCHUSDT lately? Let’s dive into the latest structure on #BitcoinCash and what may unfold next:
💎#BCH has been trading within a well-respected ascending channel since early April, consistently bouncing between dynamic ascending support and resistance levels. However, the current move into the $500–$505 resistance zone is showing clear signs of momentum exhaustion, as price stalls and volume fades.
💎The strong resistance area between $500 and $505 has rejected price multiple times, and this recent rejection aligns with both the channel resistance and a bearish momentum divergence in volume. Unless #BCHUSD can break and hold above this zone, bulls are fighting a losing battle.
💎The invalidation of the bearish setup lies above $555. Only a confirmed breakout and sustained hold above this level would negate the current bearish structure and open room for a larger bullish expansion. Until then, the risk of a deeper retracement is very real.
💎Currently trading around $490, #BCH looks vulnerable to a drop toward the moderate support zone near $393, with the strong demand zone between $335 and $340 being the high-probability area for a smart-money reaccumulation—if the market flushes weak hands first. This zone also lines up with previous high-volume nodes on the VRVP.
Trade smart, Paradisers. This setup will reward only the disciplined.
MyCryptoParadise
iFeel the success🌴
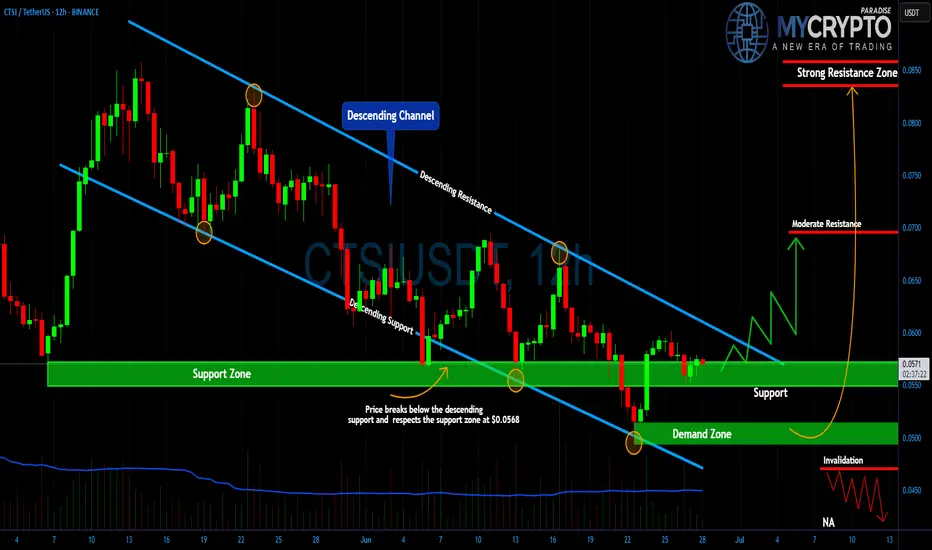
CTSI About to Detonate? Yello Paradisers! Are you ready before CTSI makes its next explosive move? Because this setup is flashing signals that most traders will only realize when it's already too late.
💎#CTSI/USDT has been trading within a clearly defined descending channel, consistently respecting both the resistance and support trendlines. What's important now is how the price has reacted after dipping into the lower boundary. After breaking slightly below the descending support, the price immediately rebounded from the key horizontal support area at $0.0552 a region that has repeatedly proven its strength over the last few weeks.
💎This recent price action confirms strong buyer interest at the current levels, and as long as the $0.0550–$0.0570 zone holds, #CTSI remains in a potential accumulation phase. The reaction here suggests that smart money might be stepping in early, preparing for a breakout move that could take retail traders by surprise.
💎If momentum begins to build and the structure breaks above the descending resistance line, the first technical obstacle will be around $0.0700 a moderate resistance that has capped price action before. A sustained move through this level would confirm the breakout, with the next key target sitting at the strong resistance zone near $0.0850. This would represent a solid bullish extension for those positioned early inside the channel.
💎However, the invalidation point is also very clear. A breakdown below the $0.0500 region, where the final demand sits, would invalidate the bullish setup and open the door to deeper downside. For now, though, the structure is favoring a potential reversal, and the market is giving us a clean range to work with.
Strive for consistency, not quick profits. Treat the market as a businessman, not as a gambler.
MyCryptoParadise
iFeel the success🌴
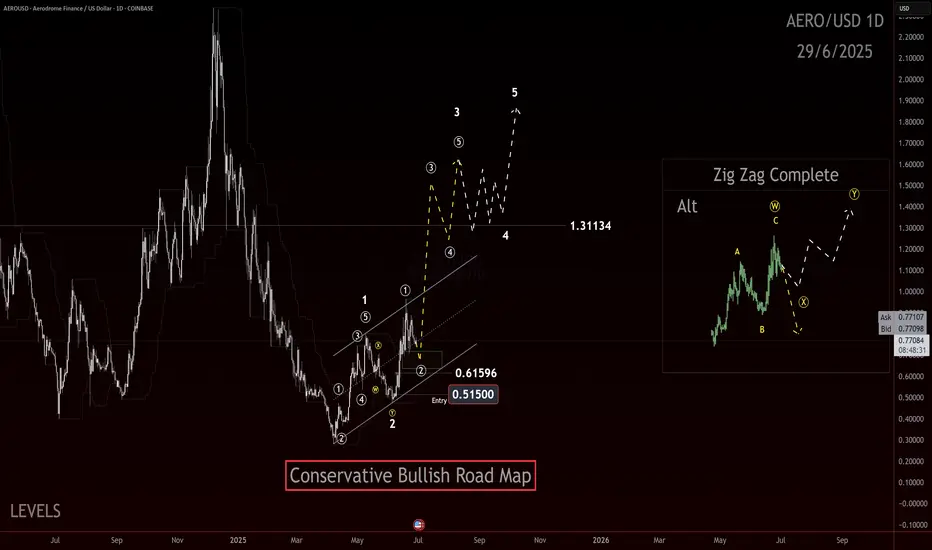
AERO, break down or the sound barrier!?If you find this information inspiring/helpful, please consider a boost and follow! Any questions or comments, please leave a comment!
AERO started by showing the kind of impulsive structure that could lead to a much larger advance. The internal retracement off the low was deep enough to flush weak hands but shallow enough to retain the broader bullish context.
The structure looks like a completed wave 2 correction: a double zigzag down into that .51-.61 pocket, finishing with an impulsive pop off the lows. That initial thrust is exactly the type of reaction you want to see if this is the early stages of a wave 3 or C advance.
What’s next? Ideally, price continues to respect the 0.615 level and we see price return back to the channel and then breaks above it with momentum, signaling the start of the next leg up. A clean swift move above .965 would help confirm that bulls are in control and we’re not dealing with an extended corrective mess.
Upside targets are layered: 1.31 is the first zone to watch—an area of prior structural reaction. Beyond that, the move has potential to extend above 1.80+ in a classic wave 5 push, provided we continue to see impulsive follow through.
Bias is bullish while price holds above .61 and continues to print higher lows. Any significant break back into that .51-.61 zone without reclaim would invalidate this setup and shift focus back to low prices.
Trade safe, trade clarity!
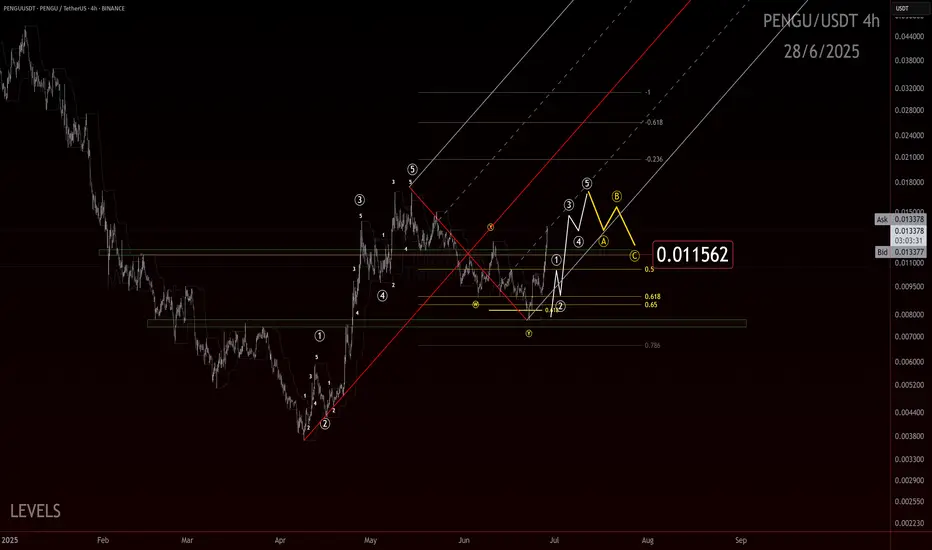
Penguins Can’t Fly, But This Chart Might If you find this information inspiring/helpful, please consider a boost and follow! Any questions or comments, please leave a comment!
The move off the low looks like a clean, completed impulse wave sharp, decisive, and showing solid structure. After that, we had a double ZZ retracement. While it was a bit deeper than the textbook ideal, it still fits perfectly within the normal range you’d expect for a healthy correction. Now, we’re seeing another smaller-degree impulse forming from the .007 pivot, suggesting that the market is gaining momentum again.
Here’s what we’re watching closely:
The secondary impulse off .007 continues to build structure.
We want to see a pullback after impulse completion that ideally holds above the .011 region, showing the market respects previous support and AOIs.
The structure of this potential pullback needs to be corrective rather than impulsive to confirm bullish continuation.
A clean move above prior swing highs would confirm that the larger wave 3 or C is underway.
Overall, this chart is ticking the boxes for a potential larger upside push if the market respects key levels and continues to print impulsive structure higher.
Trade Safe!
Trade Clarity!
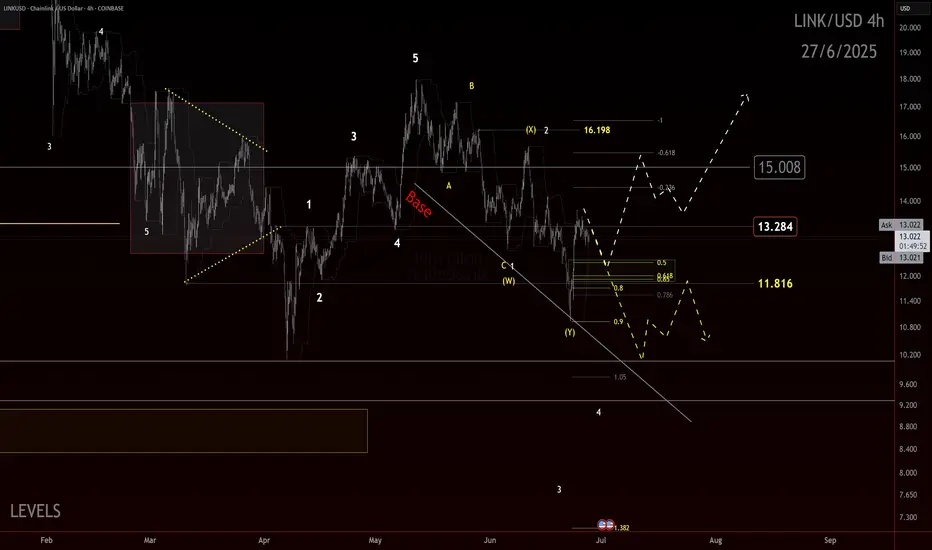
Final $LINK in the corrective chain?If you find this information inspiring/helpful, please consider a boost and follow! Any questions or comments, please leave a comment!
LINK could be finishing a double zigzag correction. Recent reaction at the channel’s most likely target area shows promise. Watching for an internal retrace that holds above key support.
Key Levels:
11.81: Ideal retrace floor
11.00: Break kills impulse idea
13.25: First upside flip needed
15.00: Big level to break for bulls
Bulls have been tricked before with possible impulse starts. This one has the right look and confluence, but caution is warranted. Ideally, we get consolidation and push above 13.25 to build confidence in further upside.
As long as price holds above 11.81 and builds higher lows, potential remains for an impulsive move up. Break below 11 and bias flips back to bearish continuation.
Trade Safe!
Trade Clarity!
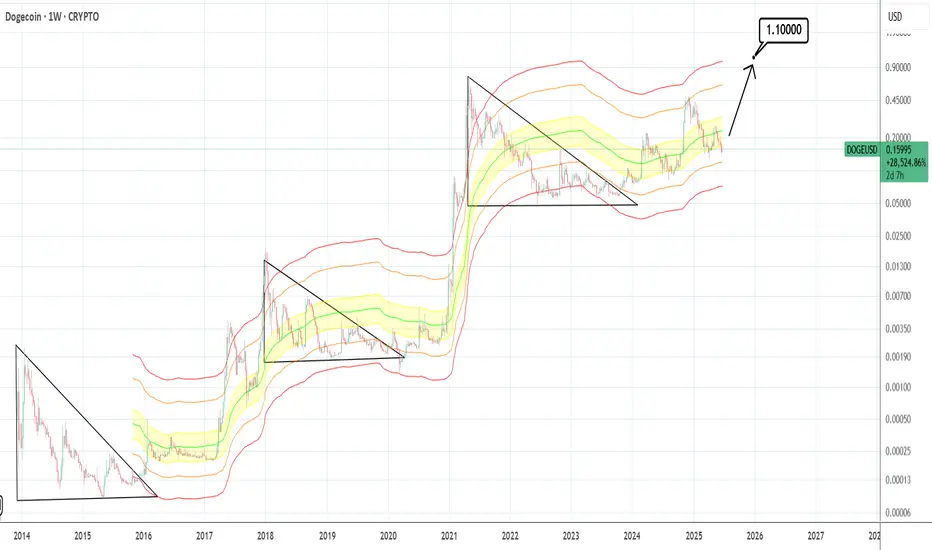
DOGEUSD: $1.100 is the minimum target.Dogecoin is bearish on its 1D technical outlook (RSI = 37.555, MACD = -0.00967, ADX = 29.193), suggesting that it is heavily undervalued in relation to the position it has during the same stage of the previous Cycles. All Cycles have smashed through the top red Mayer Multiple Band before pricing the Top. This means that by the end of the year, we can expect at least $1.100 for Doge (current projection of the Top Mayer Band).
## If you like our free content follow our profile to get more daily ideas. ##
## Comments and likes are greatly appreciated. ##
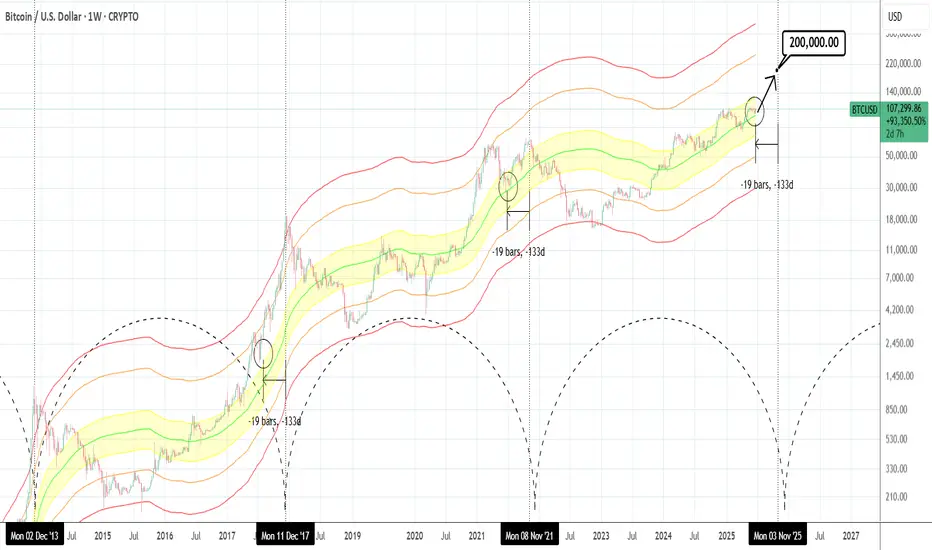
BTCUSD: Hasn't gone parabolic yet.Bitcoin is just now re-entering the bullish state on its 1D technical outlook (RSI = 55.820, MACD = 291.960, ADX = 15.180), being correcting/consolidating in the past 30 days. According to the Mayer Multiple Bands, it's stil inside the range (upper band) of the 1 Stdev Below-Mean-1 Stdev Above (yellow range). This suggest significant upside potential as being roughly 19 weeks before the Cycle tops, it matches the late June 2021 bottom inside that zone as well as the July 2017 bottom just over the top of that zone. The orange trendline has been the minimum target on every Cycle but looks unlikely to hit it by the end of the year. If however it goes parabolic as all Cycles had at this stage, $200,000 isn't at all far fetched before the Cycle tops.
## If you like our free content follow our profile to get more daily ideas. ##
## Comments and likes are greatly appreciated. ##
ETH 4H – Testing the 200W MA
ETH is trying to reclaim the 200-week MA on the 4H chart.
The last 4H candle closed right on top of it.
The first 4H bar from June 26 closed above the 0.5 Fib, but that level was eventually lost.
If the 200W MA holds as support, price may attempt to flip the 0.5 Fib into support again.
Always take profits and manage risk.
Interaction is welcome.
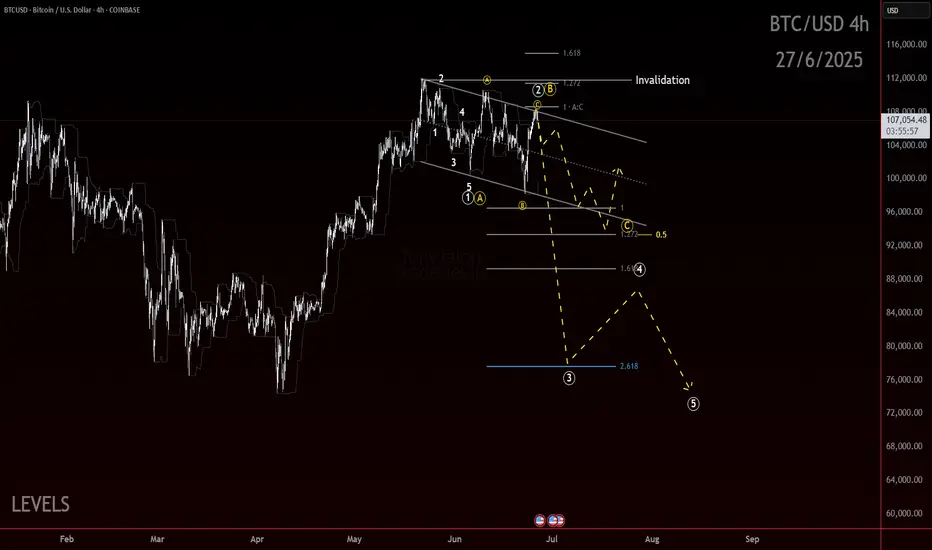
Bitcoin Top is In! Bear considerationsPrice has been carving out an unclear correction off the high. The recent structure has many squinting. Is it done or the calm before another wave of selling?
I am weighing two bearish scenarios here. One is more aggressive than the other. But both start with the same idea. No new high before another low.
Let’s start at the top.
The initial move down off the recent high could count as an impulse. Whether that is a wave 1 or a wave A is still up for judgment. Either way, that first leg sets a bearish tone at the larger degree.
Here’s where it gets interesting. The correction since then shows traits of a flat. A running one at the moment.
This opens the door to two active bearish projections:
A wave C collapse, implying a completed A B C correction and a downside resolution.
A wave 3 drop, for a possible top if this is an impulsive sequence.
That is the fork in the road. And it all hinges on the next move.
Right now, the smallest degree impulse off the low is doing some heavy lifting.
If that pivot holds and we only get an internal retracement like a micro wave 2, the door is still open for upside continuation.
But if that impulse gets invalidated, I would expect bears to press. First for a break below 100k, then toward the 95k area.
Here is how to think about it:
Hold the small impulse → Potential upside
Break the impulse base → Wave C or 3 likely underway
Context still leans bearish. Lower highs are still in play. But we are hunting a specific structure to confirm it.
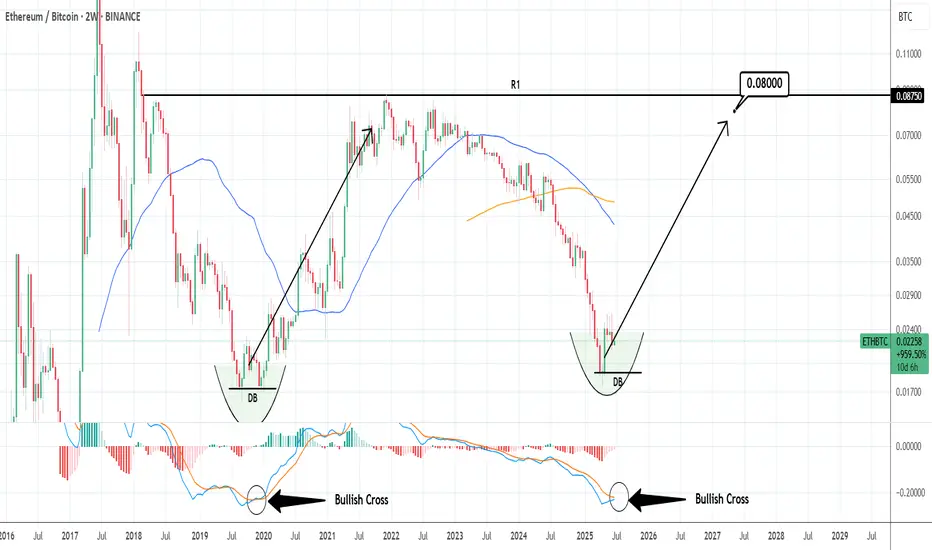
ETHBTC: Ethereum to outperform massively Bitcoin.ETHBTC turned neutral again on its 1D technical outlook (RSI = 41.566, MACD = -0.00033, ADX = 21.423) as in the past 4 weeks it failed to extend the rebound of the April 14th bottom. Ahead of a MACD Bullish Cross, a little further correction to make a Double Bottom (DB) would make the pattern more bullish, much like the December 9th 2019 DB. That was the start of Ethereum's bull season. Similarly, we expect it to start outperforming Bitcoin massively and approach the R1 level (TP = 0.0800).
## If you like our free content follow our profile to get more daily ideas. ##
## Comments and likes are greatly appreciated. ##
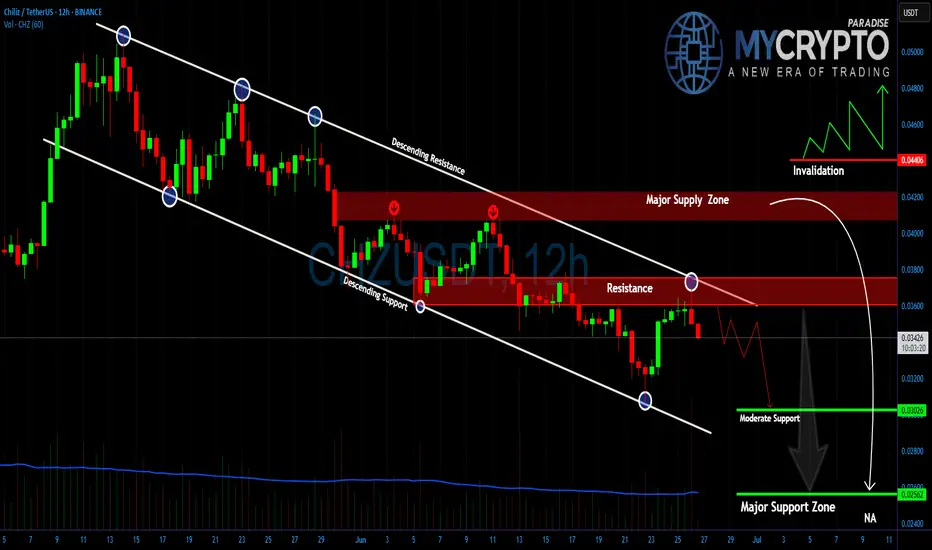
CHZ Bulls Are Getting Trapped Again —Another Nasty Drop Loading?Yello Paradisers did you notice how clean this CHZ rejection was? After a textbook touch of descending resistance, the price got slammed down again, and what comes next might catch many traders off guard. If you’re not prepared, this next leg could drain portfolios fast.
💎#CHZ/USDT continues to respect its well-defined descending channel on the 12H chart. Every time price attempts to rise, it's met with aggressive selling and this latest bounce was no different. Price failed to even reach the major supply zone between 0.03800 and 0.04200 before getting rejected at the resistance layer around 0.03600. This weakness suggests buyers are running out of steam and may not have the power to defend current levels for much longer.
💎The setup is straightforward #CHZ is trading within a strong bearish structure. The lower highs and lower lows pattern remains intact, and the most recent push up couldn’t break the descending resistance line. This latest rejection also aligns with the horizontal resistance just below the supply zone, which adds confluence to the bearish outlook. Unless the price breaks and closes above 0.04423 which would invalidate the current downtrend the path of least resistance remains to the downside.
💎The next level to watch is moderate support at 0.03026, but more importantly, all eyes should be on the major support zone down at 0.02562. That’s where significant liquidity is likely to be resting and that’s where smart money will be hunting for entries once retail panic sets in.
Right now, volume remains weak, and there’s no bullish momentum strong enough to break out of this channel. Until that changes, expect this to play out as another trap pushing late longs into losses before sweeping the lows.
MyCryptoParadise
iFeel the success🌴
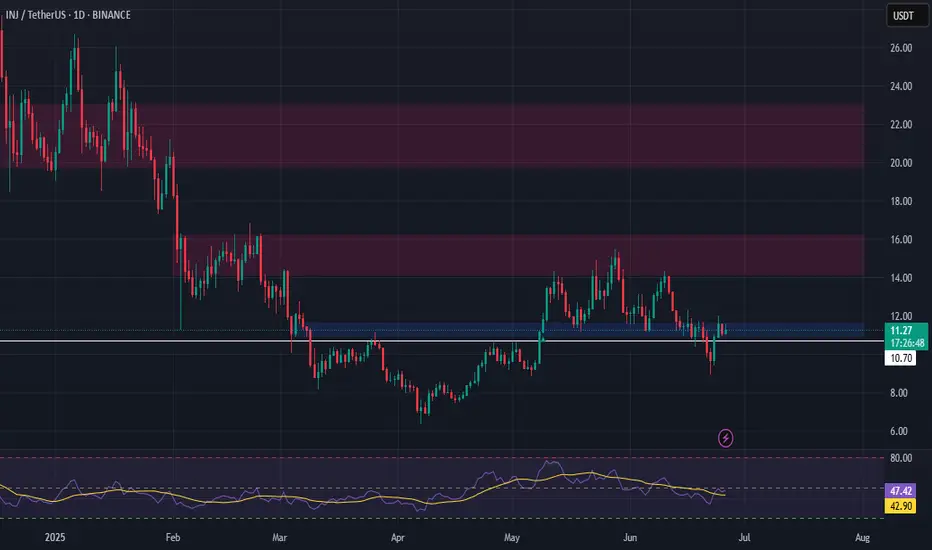
INJ Long Swing Setup – Breakout Retest Opportunity at Key LevelIf the crypto market pushes higher and INJ flips current resistance into support, we’ll be looking to enter on a retest of the $11.60 zone. This level could act as a launchpad for the next leg up.
📌 Trade Setup:
• Entry Zone: $11.60 – $11.60 (Breakout Retest)
• Take Profit Targets:
o 🥇 $14.20 – $16.25
o 🥈 $19.80 – $23.00
• Stop Loss: Daily close below $10.70
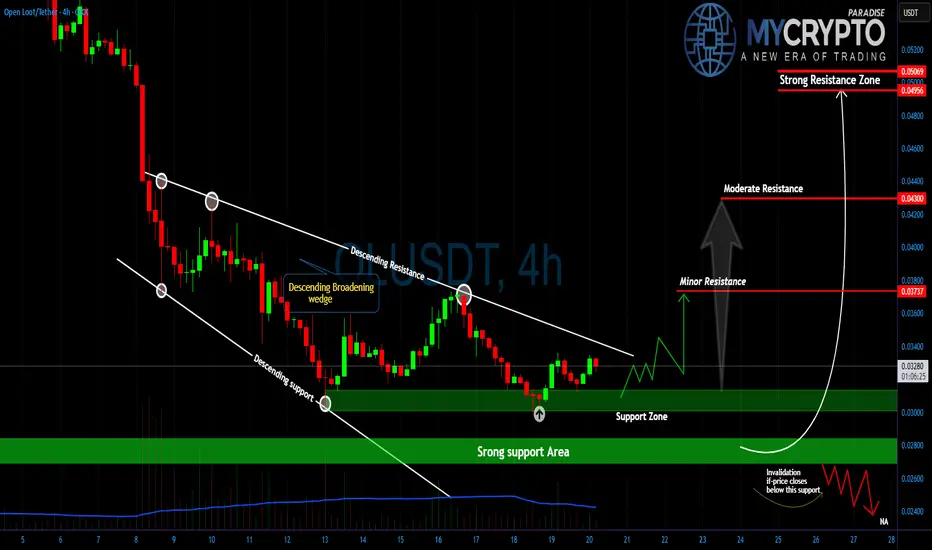
OLUSDT Ready to Explode? Don’t Miss This SetupYello Paradisers, is this the calm before the storm? #OLUSDT has just bounced off a key support zone and is now grinding right under a critical resistance. If you’ve been following our recent plays, you know exactly how this pattern can end with an explosive move that catches the herd completely off guard. This chart setup demands attention right now.
💎What we’re seeing is a textbook descending broadening wedge formation, which historically leads to powerful breakouts when the price breaks through the upper trendline with volume. #OLUSDT has respected this wedge perfectly, with two touches on both the resistance and support lines, confirming its technical strength. At the time of writing, the price is testing this resistance again, and any sustained breakout above it could flip the current structure bullish and trigger a rally.
💎The recent bounce came directly from a strong support zone between $0.028 and $0.030, an area that has consistently absorbed selling pressure. This level is now acting as the foundation for a potential trend reversal. As long as the price remains above this zone, bulls remain in control of the narrative. However, a daily close below $0.028 would invalidate the current bullish setup, signaling that bears may still have fuel left to drive the price lower, potentially targeting the $0.024 region.
💎On the upside, if the resistance gives way, we’re watching three major reaction zones: the first is minor resistance at $0.037, then moderate resistance around $0.043, and finally, the strong resistance zone at $0.046 to $0.050, which would represent a full breakout completion and a 50% move from current levels. These levels are not just random numbers; they represent areas of high liquidity and previous heavy sell interest, so they must be approached with caution and strategy.
Stay ready. Stay focused. And always play the long-term game like a pro.
MyCryptoParadise
iFeel the success🌴
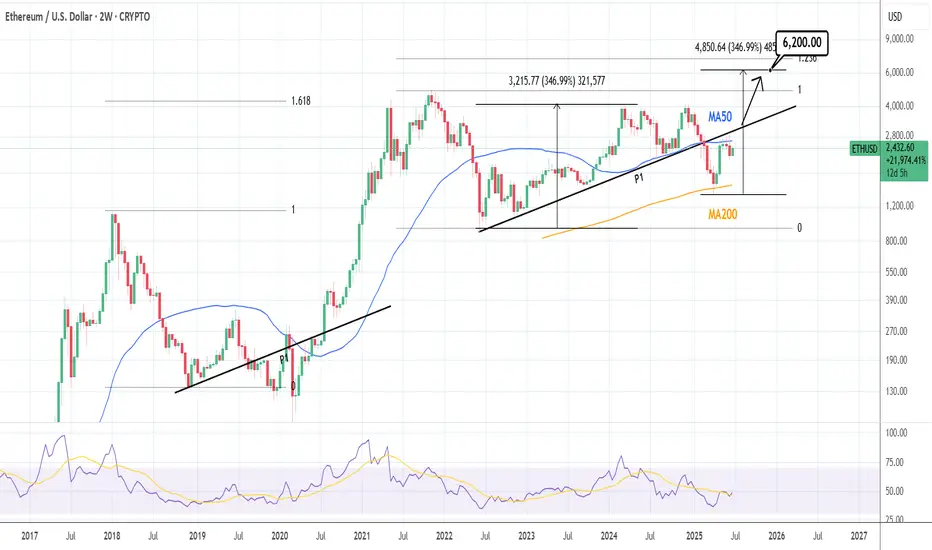
ETHUSD: Waiting for one last breakout.Ethereum remains neutral on its 1D technical outlook (RSI = 48.083, MACD = -39.26, ADX = 21.833), failing so far to close over its 2W MA50, where it's been rejected in the past 3 candles. The last Resistance before the price starts the parabolic rally is the P1 trendline. The price has been trading over it for the majority of this Cycle and only broke under it during the recent Tariff War. A breakout there, extends the Cycle to possibly at least a +346.99% rally from the bottom (TP = 6,200).
## If you like our free content follow our profile to get more daily ideas. ##
## Comments and likes are greatly appreciated. ##
Bitcoin - We have to see new highs now!Bitcoin - CRYPTO:BTCUSD - is now at the previous highs:
(click chart above to see the in depth analysis👆🏻)
It could really not be more exciting on Bitcoin at the moment. With the current "all or nothing" potential breakout or double top creation, we will either see a bullrun or a bear market. So far, bulls are still strong, so the chances of a breakout luckily remain higher.
Levels to watch: $100.000
Keep your long term vision!
Philip (BasicTrading)
