Can #LTC Bulls Make Recovery or Bears will Continue to Dominate?Yello Paradisers! Are you ready for the next wave of #LTC that can catch many traders off guard? Let's see the latest setup of #Litecoin and what can happen next:
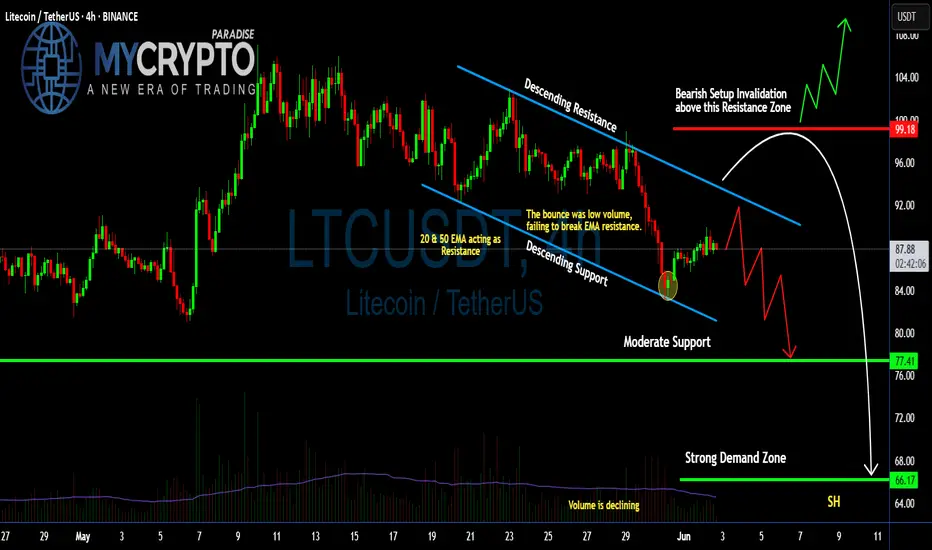
💎#LTCUSDT is currently trapped inside a descending channel, signaling sustained bearish pressure. The most recent bounce came with declining volume and failed to reclaim the 20 & 50 EMA — a clear sign that bulls are running out of steam. These EMAs are now acting as dynamic resistance, capping every upward attempt.
💎The #LTCUSD structure remains bearish as long as the price stays below the key resistance zone near $92.00, especially under $99.18, which marks the invalidation of the bearish setup. If that zone is broken convincingly with huge volume, we could see a short squeeze toward $104.00. Until then, the bias will stay on the downside.
💎Support at $77.41 might offer temporary relief, but if sellers break through that level, all eyes will shift to the strong demand zone at $66.17 — a region that has historically attracted high-volume buying and could serve as a potential bounce area.
💎Volume continues to decline, showing that momentum is fading with each bounce. This increases the probability of a breakdown continuation unless the trendline resistance is flipped with strength and backed by volume. Right now, the chart shows weakness, not reversal.
Stay disciplined. The next big opportunity will come to those who wait not those who chase.
MyCryptoParadise
iFeel the success🌴
Cryptotrading
Bitcoin Order Book - How To Trade ItBitcoin Order Book Analysis | Massive BTC Liquidity Zones You Need to Watch
In this video, we break down the Bitcoin (BTCUSD) order book and highlight the biggest buy and sell levels currently driving market sentiment. These are the exact price zones where whales and institutions are placing large orders—often creating powerful support and resistance that can trigger breakout or reversal setups.
In This Breakdown:
• Where major buy/sell walls are forming in the BTC order book
• How order book depth can predict short-term price direction
• Real-time liquidity pockets traders are watching now
• Key price levels to watch for possible long/short entries
This is a must-watch if you’re actively trading BTC and want to track where the smart money is stacking their positions.
⸻
Tools Featured:
• BTCUSD real-time chart
• Order book heatmap / depth
• Liquidity zone visualizations
• Volume profile overlays
• Sentiment Tool
⸻
Use this insight to position your trades around high-probability reversal or breakout zones. Comment your BTC target below, and follow for daily pro-level crypto insights.
⸻
#Bitcoin #BTCUSD #OrderBookAnalysis #BTCOrderFlow #WhaleActivity #LiquidityZones #CryptoTrading #PriceAction #CryptoTA #BitcoinStrategy

ETH - ORDER BOOK - BIG LEVELS Ethereum Order Book Analysis | Key ETH Levels Revealed (Real-Time Liquidity Zones)
In this video, we dive into the Ethereum (ETHUSD) order book to uncover major liquidity levels that could influence price action in the short and medium term. By analyzing real-time data, we identify where whales and institutions are placing large orders, which often act as strong support and resistance zones.
What You’ll Learn:
• How to spot large buy/sell walls on the ETH order book
• Why these levels matter for short-term traders
• Real-time reactions to major liquidity zones
• Potential long/short trade setups around key areas
This is essential viewing if you’re trading ETH intraday or swing, and want to anticipate where the next major move may come from.
⸻
Tools Used:
• ETHUSD price chart
• Real-time order book data
• Volume heatmaps
• Liquidity zone mapping
• Sentiment Tool
⸻
Stay ahead of the crowd by understanding how the market reacts to big players’ order placements. Don’t forget to leave a comment with your ETH target, and follow for more pro-level crypto analysis.
⸻
#Ethereum #ETHUSD #ETHAnalysis #CryptoTrading #OrderBook #ETHOrderFlow #LiquidityLevels #CryptoTA #PriceAction #WhaleWatching

Watching for a Double Signal on ETH ETH 4H – Watching for Dual Signal Confirmation
ETH is now trading above the BB center, with both the MLR and SMA also above.
PSAR hasn’t flipped yet, but if upside continues, we could see a bullish flip soon.
If PSAR flips while price holds above range low, that’s a potential dual signal (trend + structure).
Still, this is speculative—price could easily reject here and head lower.
Reminder: ETH remains under the 200MA on both the 4H and daily timeframes.
However, it’s currently holding the 5D 200MA. Idea on that coming soon.
Always take profits and manage risk.
Interaction is welcome.
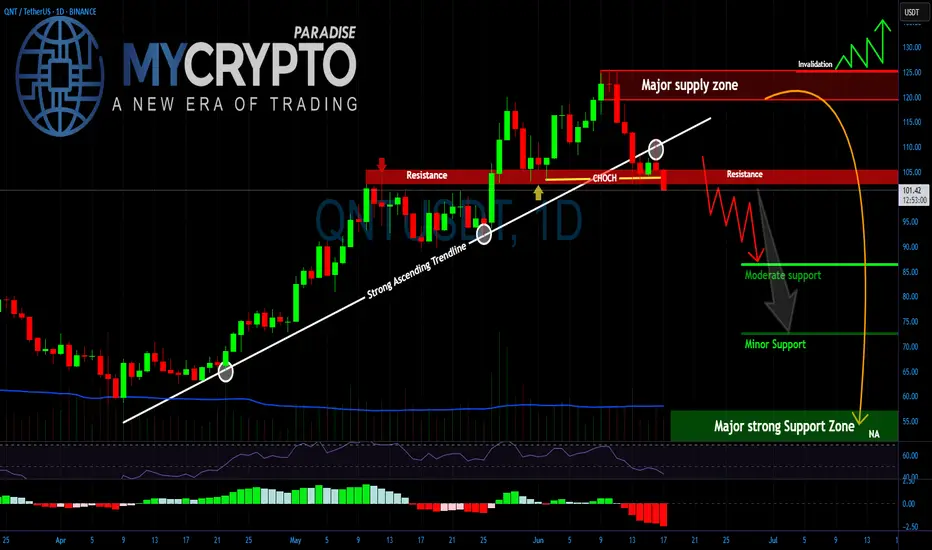
QNT Is Breaking Down — Are You ReadyYello Paradisers, Have you seen what just happened with #QNTUSDT? After weeks of grinding higher, the structure has cracked and that crack could turn into a landslide if you're not ready. This isn’t the time for hope or guesswork. It's the time for strategy.
💎#Quant has broken below a major ascending trendline that’s held since April, marking a pivotal shift in its momentum. The market just printed a clean Change of Character (CHoCH) around the $105–106 level, right at the confluence of a key support-turned-resistance zone. That CHoCH level, once a strong foundation for bullish continuation, has now flipped into a headwind. As long as the price stays below this range, we remain in the danger zone.
💎 Adding fuel to the fire is the major supply zone looming above, from $122 to $128. This area has already triggered rejection in the past and will now serve as the final invalidation for any short-term bullish dreams. A reclaim of this zone is highly unlikely in the near term, given the structure and momentum.
💎Now with the trendline cleanly broken and the market unable to hold higher lows, all eyes are on the lower support zones. The $85 region may provide a temporary cushion, but the real magnet lies deeper. We are closely watching the $72–75 area for signs of temporary relief, but the main high-probability reaccumulation zone is sitting all the way down at $55–60. This zone will likely attract smart money accumulation if the market gets there, it will not be by accident.
💎 This isn’t the time to be catching falling knives. Unless #QNT can reclaim the broken trendline and push back above the $106–110 range with conviction, the path of least resistance is down. That also means every lower high that prints now is an opportunity for trained eyes.
Stay ready. Stay focused. And always play the long-term game like a pro.
MyCryptoParadise
iFeel the success🌴
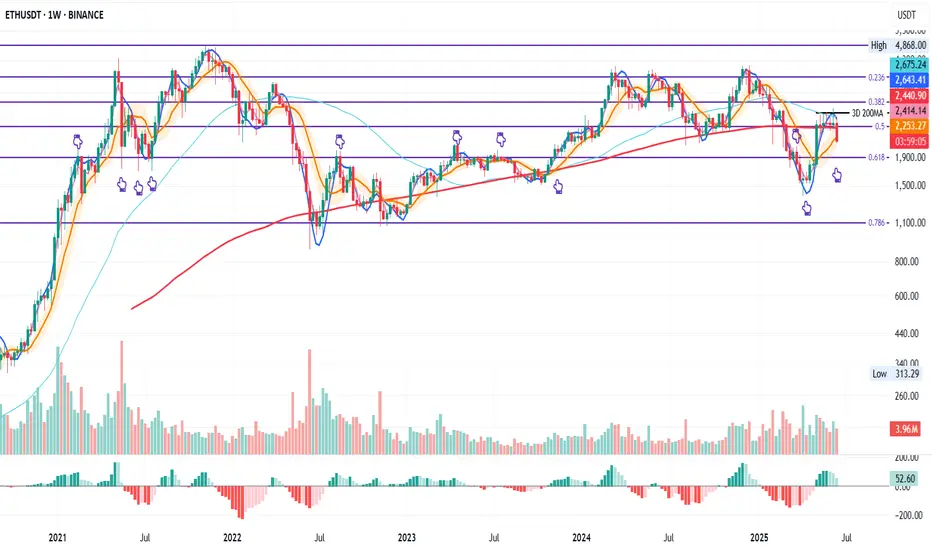
ETH Weekly – Eyes on $1900When panic creeps in, zoom out.
ETH on the weekly has lost both the 200MA and the 0.5 Fib.
In my opinion, if the BB center doesn’t hold here, price could retest the 0.618 Fib level a zone it tends to flirt with often.
The $1900 area might become a solid buy zone.
Always take profits and manage risk.
Interaction is welcome.
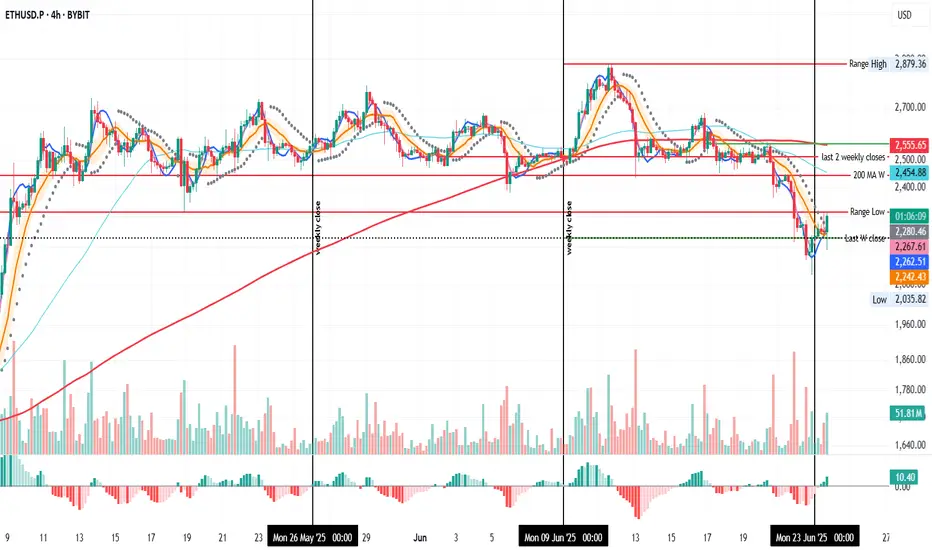
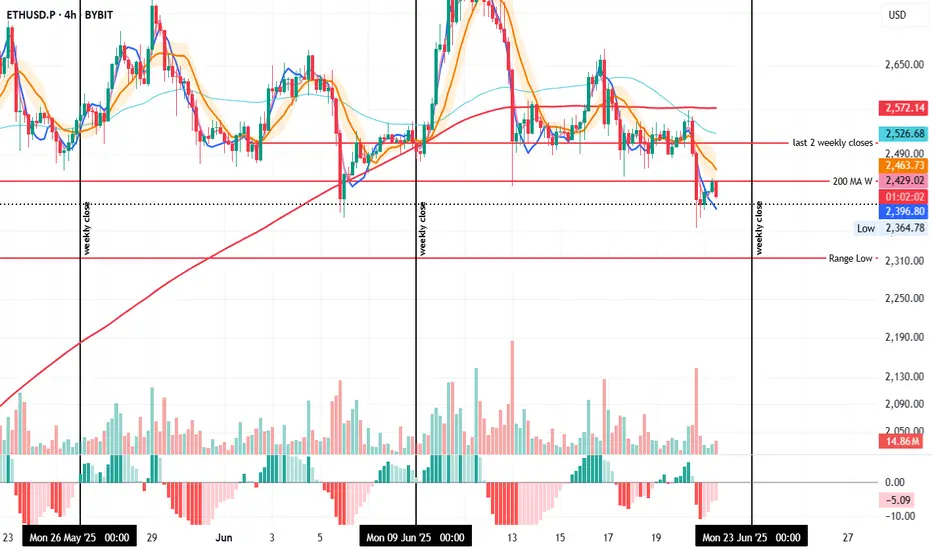
ETH 4H – Testing Support, Rejected by Weekly 200MAOn the 4H, ETH is closing below the weekly 200MA but is trying to hold the last daily close as support—similar to what it did on June 5 at 20:00.
The difference: back then, the 4H 200MA acted as support; now it’s been clearly rejected and price sits well below it.
With the weekly close approaching, if ETH stays under the weekly 200MA, there's a strong chance it revisits the range low support.
However, if it manages to reclaim the 200MA before the close, a move toward the last two weekly closes may still be on the table.
Always take profits and manage risk.
Interaction is welcome.
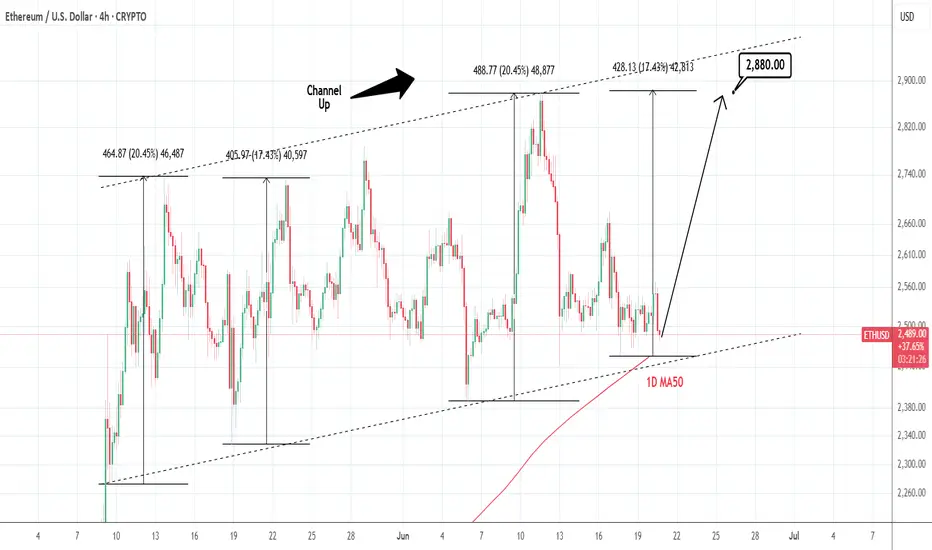
ETHUSD: Channel Up testing 1D MA50. Optimal buy.Ethereum is neutral on its 1D technical outlook (RSI = 47.020, MACD = 17.220, ADX = 20.205), consolidating for the past 3 days. This time it is about to test the 1D MA50, which is technically the long term Support. Since it is also almost at the bottom of the Channel Up, we see this as the most optimal level to buy and aim for the same +17.43% rise (TP = 2,880) it did in May.
## If you like our free content follow our profile to get more daily ideas. ##
## Comments and likes are greatly appreciated. ##
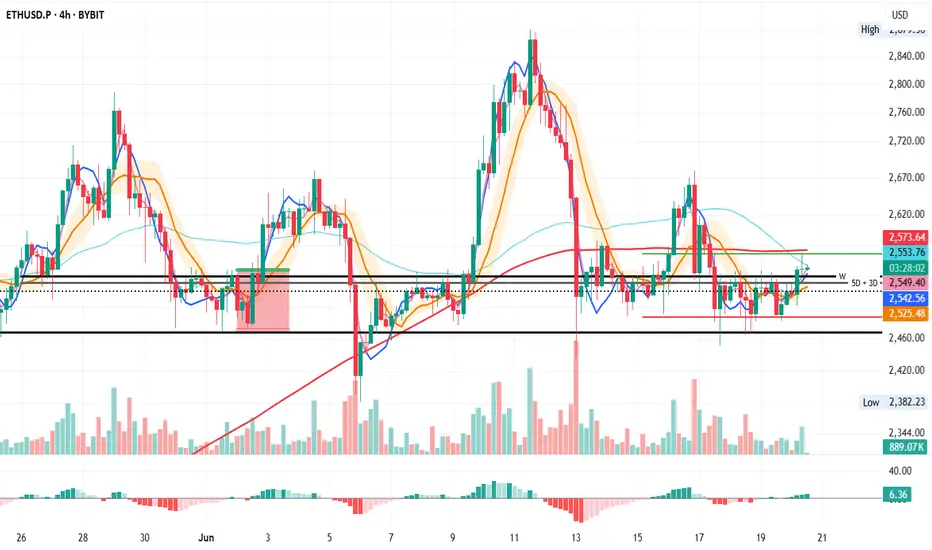
ETH/USDT Key Levels Reclaimed on 4HOn the 4H, price has closed above the 5D + 3D, and W resistance levels.
Will these levels hold and become a launchpad for new higher highs—and possibly counter the 200MA?
We can’t know for sure, but we can make educated guesses.
Always take profits and manage risk.
Interaction is welcome.
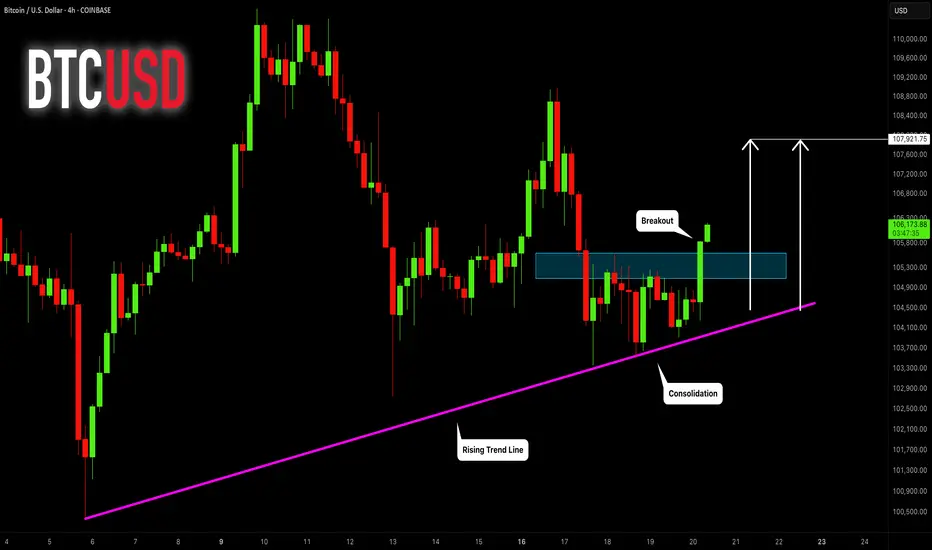
BITCOIN (BTCUSD): Strong Bullish Confirmation?!
Bitcoin has a high chance to rise more, following
a strong bullish reaction to a rising trend line on a 4H.
Goal - 108000
❤️Please, support my work with like, thank you!❤️
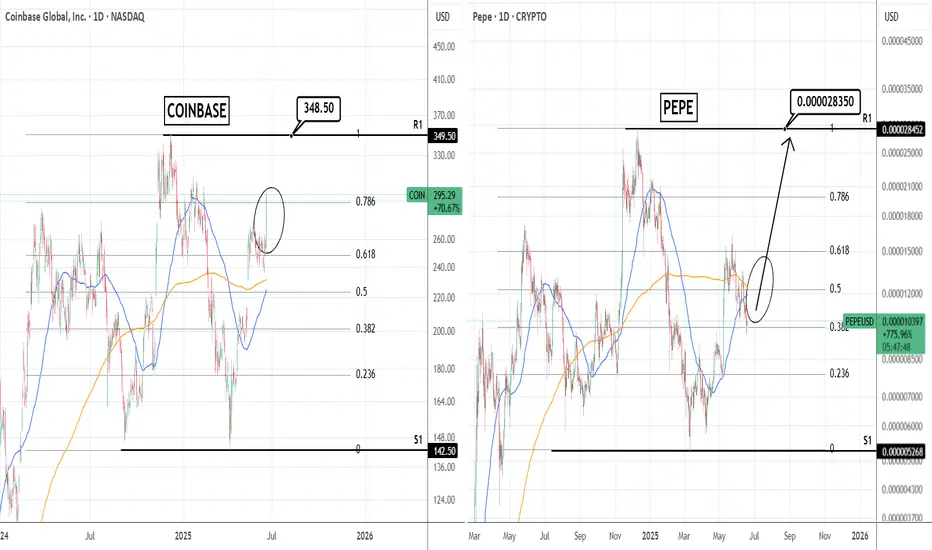
COINBASE: Is it a guide on how to trade PEPE??Coinbase saw a massive surge yesterday as the Senate cleared the path for stablecoin regulation. This turned its 1D technical outlook almost overbought (RSI = 68.001, MACD = 11.870, ADX = 26.090). Our TP = 348.50 on COIN remains but oddly enough, we see a stronger than expected correlation with PEPE. Since it is now lagging after the Senate decision, this may be a great time to buy PEPE as this pattern shows that soon it will follow Coinbase upwards anf they will converge.
See how our prior idea has worked out:
## If you like our free content follow our profile to get more daily ideas. ##
## Comments and likes are greatly appreciated. ##
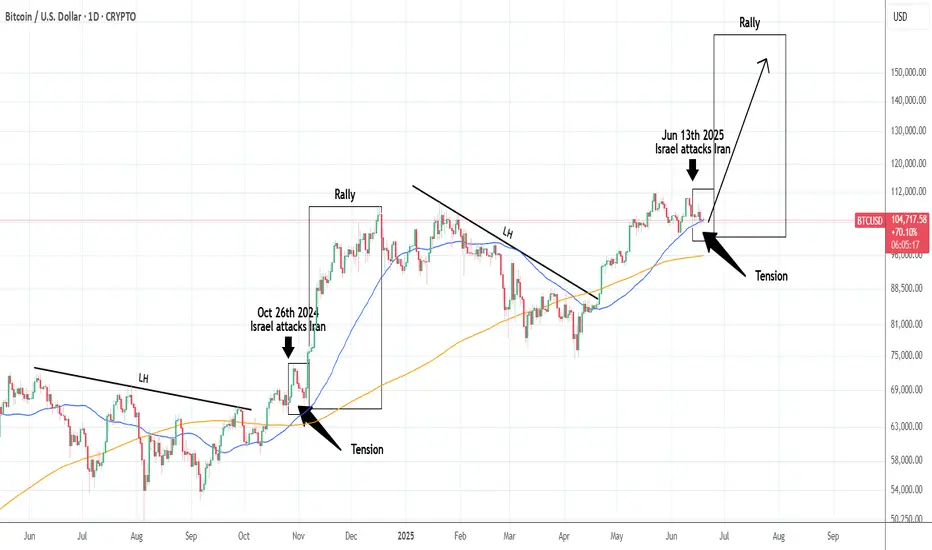
BTCUSD: Israel-Iran conflict like October 2024.Despite the Middle East tension, Bitcoin remains long term bullish on its 1W technical outlook (RSI = 63.167, MACD = 6883.200, ADX = 33.150). It remains supported on its 1D MA50, in fact in the same manner it was during the previous Israel-Iran conflict. I was on October 26th 2024, when Israel launched three waves of strikes against 20 locations in Iran and other locations in Iraq, and Syria. Simila to the June 13th 2025 attacks. It is more than striking how similar the two price patterns are. Assisted by the U.S. elections on November 5th 2024, a massive rally followed the Middle East conflict. A repeat of that may very well send Bitcoin to $150,000 and above.
## If you like our free content follow our profile to get more daily ideas. ##
## Comments and likes are greatly appreciated. ##
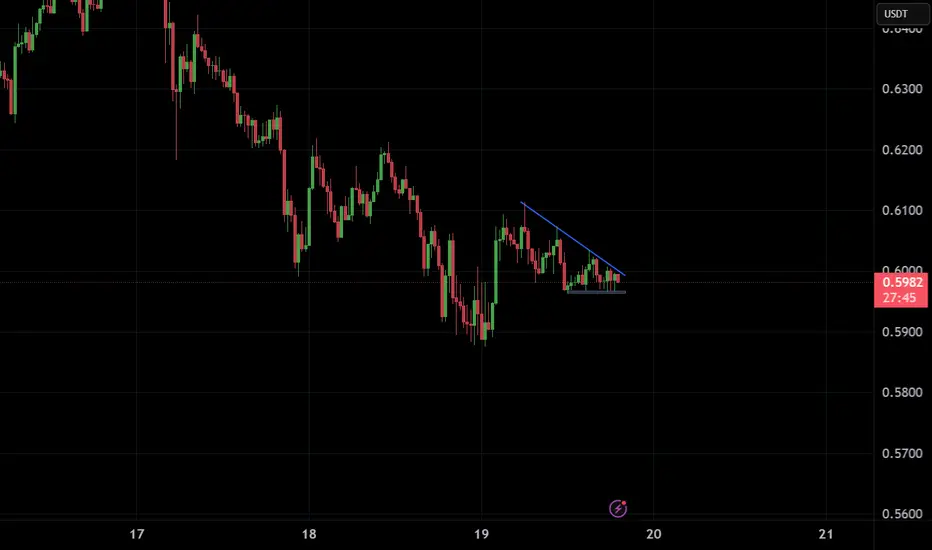
ADAUSDT IDEAlower lows and a flat. Seems to be a trade opportunity which ever side it goes off breaking its current structure.
Is #ARB Ready For a Recovery or will it continue to Fall? Yello Paradisers! Are you watching #ARBUSDT closely or not? Let's look at the latest #Arbitrum trading setup and what could be next for it:
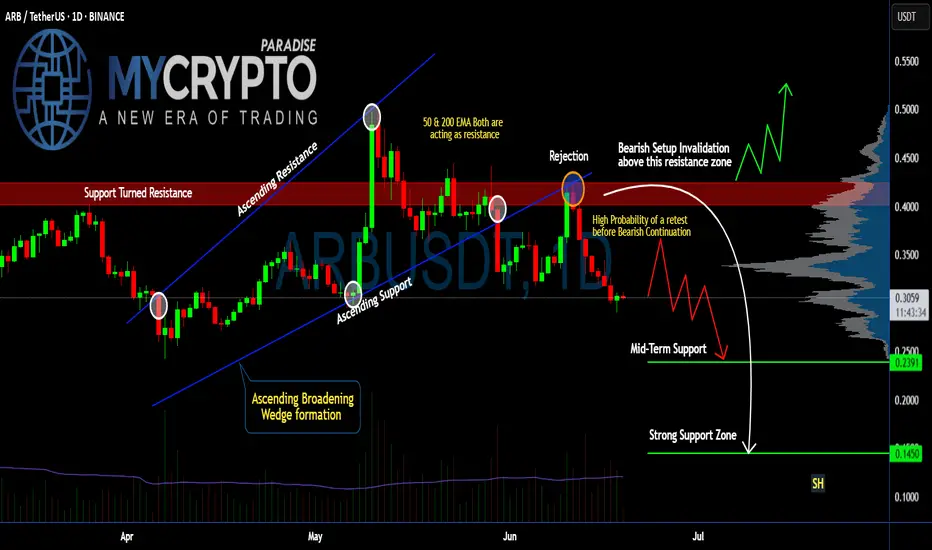
💎#ARB just completed a breakdown from an Ascending Broadening Wedge. This breakdown has made the previous support into the resistance after the price rejection. Currently, there is a high probability that #ARBUSD might do a retest before continuing downward.
💎After the wedge breakdown, price got rejected hard from the $0.39–$0.42 resistance zone, where both the 50 EMA and 200 EMA are now stacked against the bulls, acting as strong dynamic resistances. This confluence of resistance increases the probability that this level won't be reclaimed easily. The setup is clearly bearish unless invalidated above $0.42.
💎We’re seeing a lack of follow-through on the bounces, which signals hesitation and likely a trap for late buyers. As long as we remain below the resistance block, the next logical move is a retest of mid-term support at $0.2391.
💎But it doesn't stop there. If this mid-level gives in — and the structure suggests it might — the next area to watch is the $0.1450 zone, a strong historical support and the first place we expect real buyers to step in. This could be the level where a high-probability reversal finally sets up.
Trade smart, Paradisers. This setup will reward only the disciplined.
MyCryptoParadise
iFeel the success🌴
SEI Rebound or Final Trap?Yello Paradisers, have you considered that this little bounce might be the last trap before a brutal selloff? SEIUSDT is giving us strong signals that most retail traders are missing and if you’re not reading the structure clearly, you’re walking straight into a setup designed to clean you out.
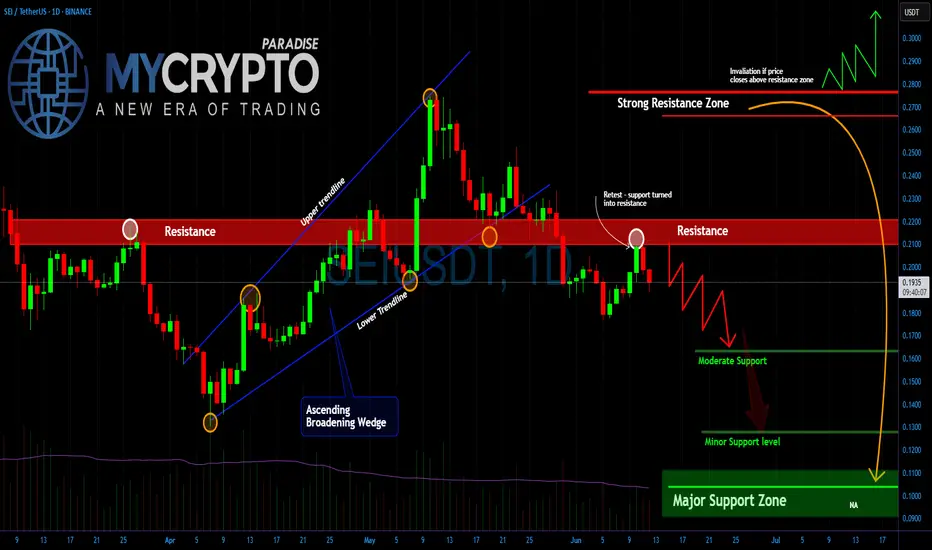
💎The recent price action shows a clear rejection from the $0.22 level, which has now confirmed itself as a strong resistance zone. What’s more concerning is that this resistance rejection comes right after the price broke down from an Ascending Broadening Wedge. This is not a random pattern it’s a classic formation that tends to attract breakout buyers and then punishes them with aggressive downside moves once the structure fails.
💎Currently, the market is drifting just below that resistance, attempting weak bounces. However, there is a clear lack of bullish momentum. If this weakness persists, the next stop is around the $0.16 region, where moderate support is likely to be tested.
💎If sellers get aggressive, that level might not hold, and we could head lower into the $0.13 area still not where true value lies. The major support zone sits far below, around the psychological $0.10 level, and that’s where the real high-probability bounce setup is likely to occur.
MyCryptoParadise
iFeel the success🌴
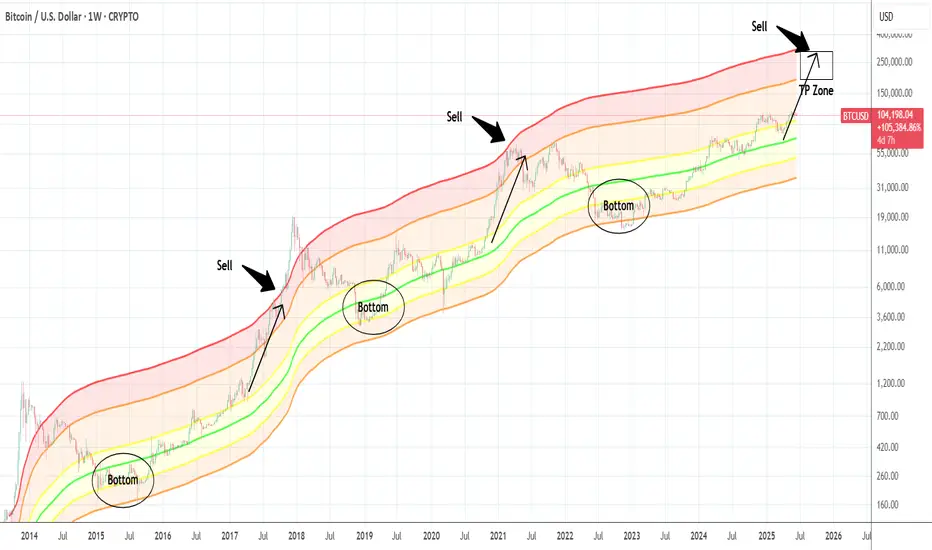
BTCUSD: Nowhere near a top yet.Bitcoin remains neutral on its 1D technical outlook (RSI = 47.257, MACD = 443.000, ADX = 29.912) due to high volatility recently but the bullish long term trend is intact and even more so, hasn't yet started the year-end rally. The Mayer Multiple Bands have always priced a Cycle's Top on their red trendline so no matter how high that may seem from the current market price, the TP zone should be between the orange (2 Stdev above) and red (3 Stdev above) trendines. Minimum TP = 200,000 for this Cycle.
## If you like our free content follow our profile to get more daily ideas. ##
## Comments and likes are greatly appreciated. ##
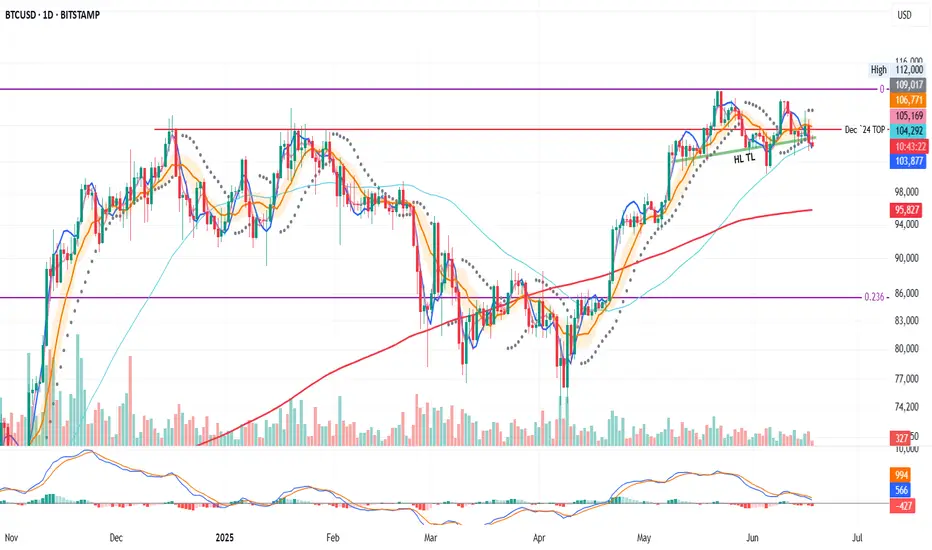
BTC on the Daily: Bearish Structure Locked In?So, on the daily, price is in a clear bearish context.
PSAR is bearish
MLR < SMA < BB center
We're about to close below the 50MA
Price already broke below the Higher Lows trendline and the December 2024 top
At this point, it all depends on the macro situation and the FOMC tone tonight.
If the outcome is positive, there's a chance price rebounds.
If not, the chart looks ready to dive.
Bitcoin Daily Linear chart getting Squeezed on FED day - Caution
Those Fib circles are showing their strength again.
See how PA is pushed by them 99% of the Time.
And right now, we see PA ina tight Squeeze between horizontal Local support and that falling red 236 fib circle.
The Apex of that Bearish pennant is near the end of this month.
And, Today, depending on how Markets react to the FED Rate decision, PA could break away from this
A Push higher will meet resistance around 109K
A Drop lower would find support around 100K - 98K
And if I am going to show a Bearish side, a drop to the 4.618 at 92K is VERY possible given Macro events
We live in Hope that the Bulls Will show up
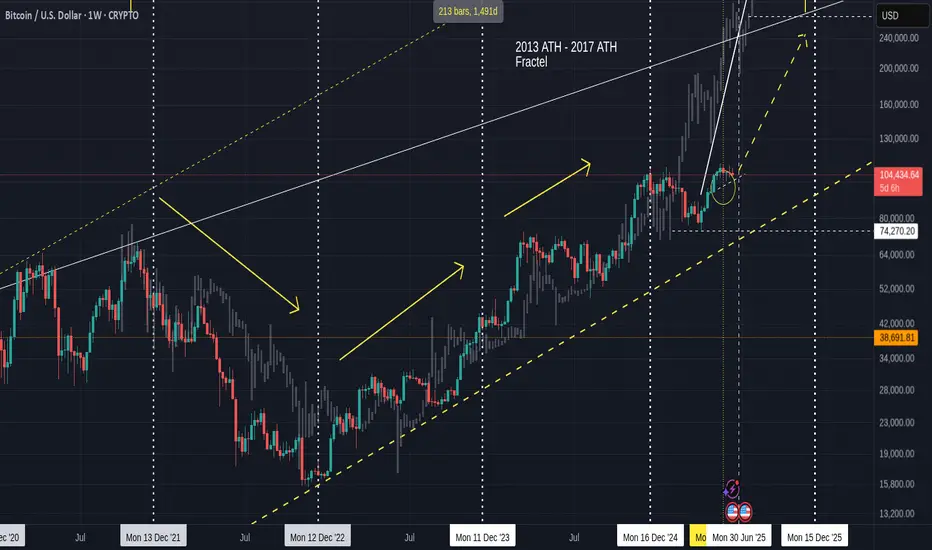
Bitcoin in expected price zone, may go lower then UP ?
This is the old fractal chart and I have faded out the Fractal from 2013 to 2017,
Everything ese remains unchanged since Feb this year.
We hit the expected price range indicated by the circle and we are still in that area but I expect, once the month closes and we have a small red month candle, then we can start printing Green again.
The daily version of this chart shows us more local detail
We have left the area of resistance and so now, we have a free move BUT I think we may dip down to that line of support around 100K - 98K
This would not be a bad thing to do before the end of the month as it would cool off the PA / RSI and MACD and so give confidence to the serious investor while scaring the pats off the New guys and Gals.
The Daily MACD still has a way to dip before it may find support on the neutral line
This level could see PA near that line of support but it is possible for MACD to drop while PA ranges.
So we could see that Dip to line of support and it may offer the last 100K buying zone for a very long time ..
But we do have Stupid people trying to start WW3 with Lies and Greed - this could possibly destabilise things.
Be Cautious
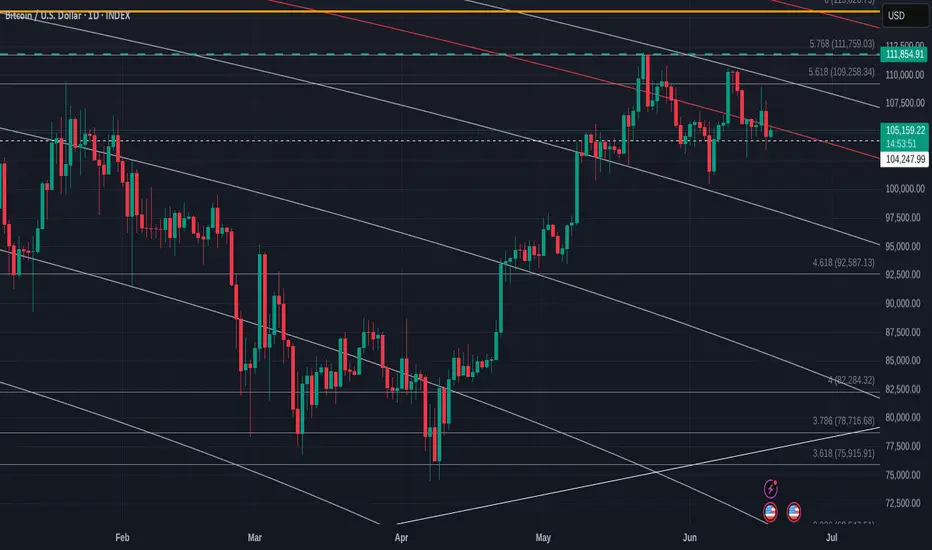
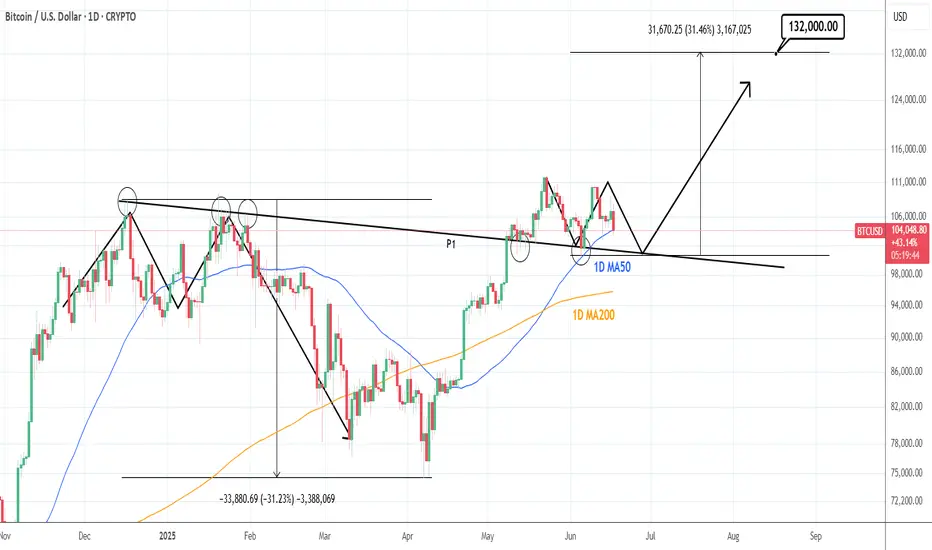
BTCUSD: 1D MA50 and 100k form a strong support base.Bitcoin has turned neutral again on its 1D technical outlook (RSI = 45.783, MACD = 629.200, ADX = 20.857) and is about to get bearish as it hit its 1D MA50 today, erasing the gains of the last 3 days. The 1D MA50 has held two times since June 5th and another one might be what Bitcoin needs to justify the next rally. Besides this however, we got a heavier Support on the P1 trendline, which on the previous ATH (Dec 17th 2024) was a Resistance and since May 12th 2025 it turned into Support. Technically, as long as 100,000 holds, we expect a strong rebound into August that may repear the inverse of December 2024 - March 2025 (-31%) and rise by +31% (TP = 132,000).
## If you like our free content follow our profile to get more daily ideas. ##
## Comments and likes are greatly appreciated. ##
Dogecoin - Don't forget the dog now!Dogecoin - CRYPTO:DOGEUSD - still remains quite bullish:
(click chart above to see the in depth analysis👆🏻)
Basically during every major bullrun on Dogecoin, we always saw a correction of at least -60%. Therefore the recent drop of -70% was not a surprise at all but rather a natural all time high rejection. If Dogecoin manages to now create bullish confirmation, the bullrun will continue.
Levels to watch: $0.2. $0.5
Keep your long term vision!
Philip (BasicTrading)

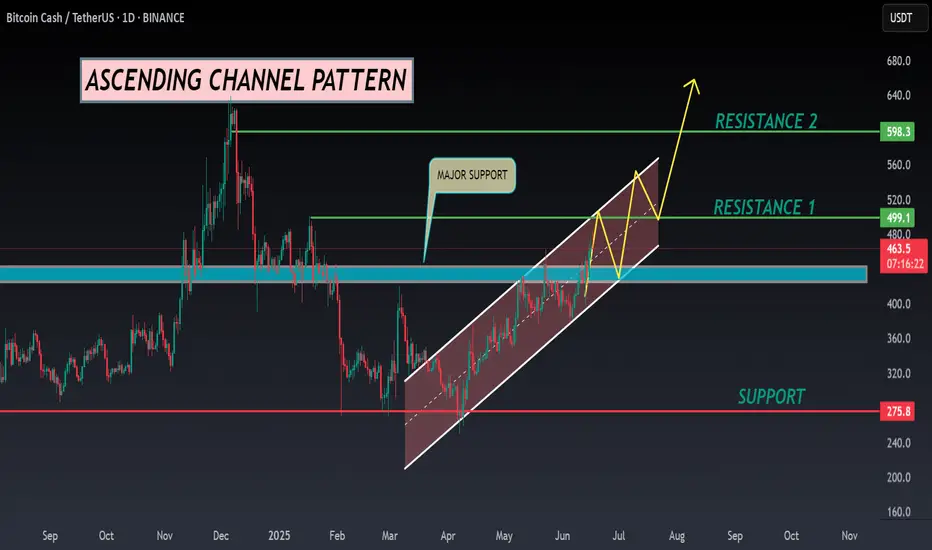
BCH ANALYSIS🔆#BCH Analysis : Channel Following ⛔️⛔️
As we can see that #BCH is following ascending channel on daily time frame. Also there is an instant resistance area. We can see a bullish formation here. And if it trade with good volume then we can see a proper bullish move in #BCH
🔖 Current Price: $463
⏳ Target Price: $598
⁉️ What to do?
- Keep your eyes on the chart, observe trading volume and stay accustom to market moves.🚀💸
#BCH #Cryptocurrency #ChartPattern #DYOR
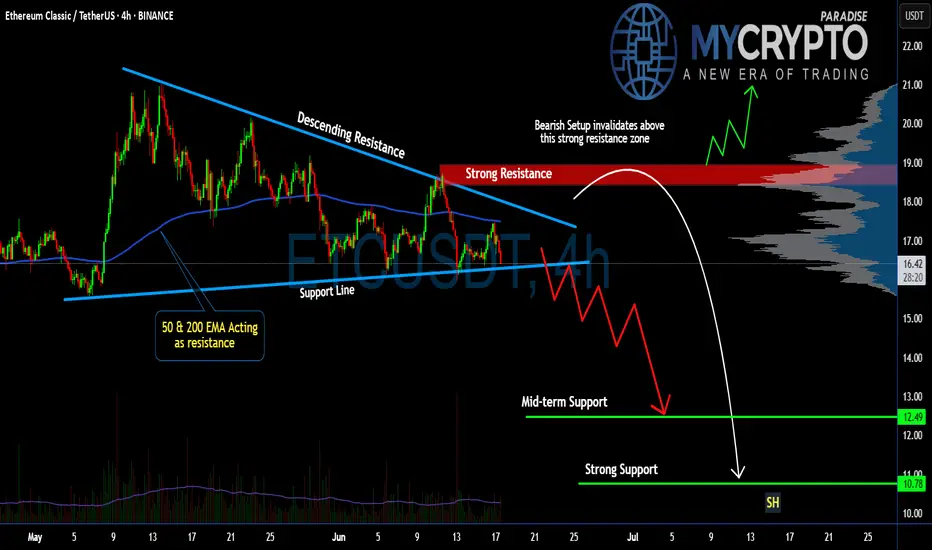
Is #ETC Ready For a Breakdown or Will it Recover From Here? Yello Paradisers! Have you checked what’s unfolding on #ETCUSDT lately? Let's look at the latest moves of #EthereumClassic:
💎#ETC has been trading inside a descending triangle for weeks, and once again, it failed to break above its strong descending resistance line, with the 50 & 200 EMAs acting as a dynamic ceiling on every rally attempt. These two indicators are stacking against the bulls, reinforcing the overhead pressure and keeping ETC pinned below key resistance levels.
💎The red zone between $18.60 and $19.20 has been acting as a strong resistance area and that’s exactly where the last bounce got rejected. The setup is clear: as long as price remains below this red supply zone, any short-term bullish case is invalidated. Each rejection here only fuels further downside conviction.
💎Unless we see a high-volume breakout and hold above $19.20, the structure remains extremely vulnerable. This is the invalidation level for the bearish thesis. If bulls can't flip that, the current pattern suggests continuation to the downside.
💎#ETCUSD is currently hovering around $16.50, with short-term bounces being aggressively absorbed. The mid-term support zone around $12.49 is likely the first magnet for price, but don’t get too comfortable there. The real target lies deeper: the strong support zone around $10.78 is shaping up to be the key smart money reaccumulation area if the selling intensifies. This is where real interest may return—but only after retail gets flushed.
Trade smart, Paradisers. This setup will reward only the disciplined.
MyCryptoParadise
iFeel the success🌴