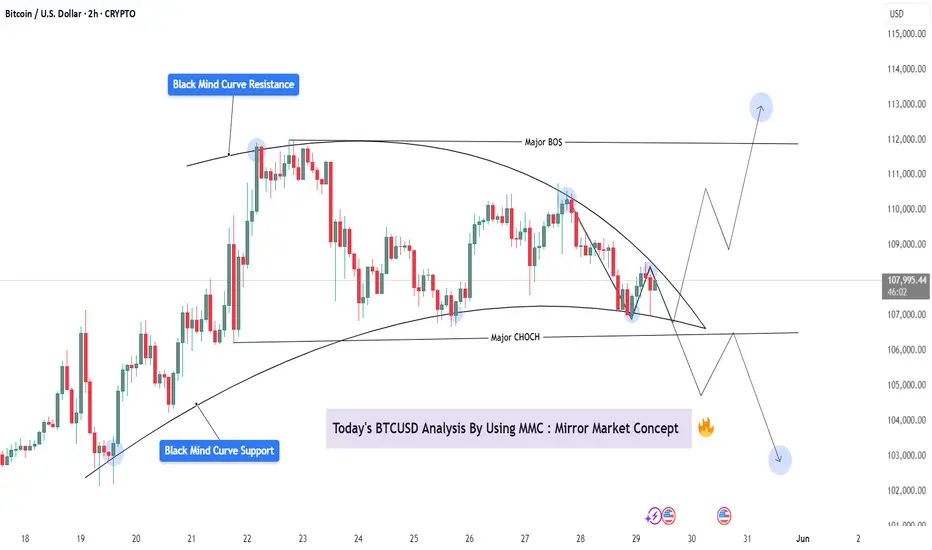
BTCUSD Analysis – Mirror Market Concepts (MMC) Action + Target🧭 Mirror Market Concepts (MMC) Explained
Mirror Market Concepts analyze repeating emotional and structural patterns in the market—like looking at a price “mirror” that reflects past movements into the present. Core tools include:
Mind Curve Resistance/Support
CHoCH (Change of Character)
BOS (Break of Structure)
Price Reflection Zones
These tools let us understand not just what price is doing—but why it's reacting at specific levels.
📊 Technical Breakdown of the Chart
🔹 1. Black Mind Curve Support & Resistance
The chart is framed between a rising support curve and a descending resistance curve, forming a psychological squeeze zone.
These mind curves represent subconscious institutional memory—where reactions often repeat based on historical liquidity and risk-off/on behavior.
🔹 2. Major CHoCH (Change of Character)
Price broke below a previous minor higher low, shifting sentiment from bullish to neutral/bearish.
This CHoCH happened within the mind curve boundary, signaling that we’re transitioning into a decision phase.
🔹 3. Major BOS (Break of Structure)
The BOS occurred during the recent drop, confirming sellers took temporary control.
However, price respected the lower mind curve support, which may still hold as the "mirror zone."
🔹 4. Key Compression Pattern (MMC Symmetry)
Price is forming a symmetrical wedge between the two curves, often seen in MMC just before a major explosive move.
The pattern resembles past behavior where price compressed before breaking out in either direction.
🎯 Potential Scenarios (Plotted on Chart)
📈 Bullish Path:
If BTC breaks above the descending curve + confirms above 109,000, we may see:
✅ Target 1: 111,000 (BOS retest)
✅ Target 2: 112,500–113,000 zone (previous emotional high + liquidity sweep)
📉 Bearish Path:
A breakdown below 107,000 and curve support suggests sellers regain control:
⚠️ Target 1: 105,000 (local demand zone)
⚠️ Target 2: 102,500–103,000 (full MMC retrace)
⚠️ Watchlist Considerations:
Two key economic news events (highlighted on chart) could serve as catalysts.
Wait for confirmation and volume breakout before committing to either side.
This is a textbook MMC compression pattern, and patience is key before reacting.
🧠 What Makes This an MMC Setup?
🔄 Mirror Reflection of past rallies and drops forming current wedge
🧩 Mind Curve Boundaries acting like subconscious trend guides
🔁 CHoCH + BOS sequencing for momentum shift detection
💡 Psychological memory zones holding strong reactions
📌 Summary
BTC is caught in a psychological squeeze between mind curve support and resistance.
Structure favors a coming breakout or breakdown, but confirmation is critical.
MMC tools show a high-probability setup—either toward 112K or 103K based on where the breakout happens.
📣 Community CTA (Call-to-Action):
📊 How are you trading this BTC curve compression?
💬 Share your charts, setups, or alternate views below. Let’s decode the market mirror together.
Cryptotrading
BTCUSD: 1M turned overbought and that's not alarming at all! Bitcoin has turned bullish even on its 1M technical outlook (RSI = 70.030, MACD = 16,156.720, ADX = 38.100) but that's not a reason to expect any strong corrections as this is the part were it technically rises more during Bull Cycles. The basic structure of the Cycle is an Ascending Triangle which breaks when the parabolic rallies begin. Based on the ratio of the last two Cycles, the new rally should be around +130% from the top of the Ascending Triandle. That gives a $160,000 fair estimate as far as the Cycle top is concerned.
## If you like our free content follow our profile to get more daily ideas. ##
## Comments and likes are greatly appreciated. ##

BTC Bulls Awakening from the Shadows – OB + 79% Fib Reaction 📈 BTCUSD | 30-Min Bullish Reversal Setup from OB + 79% Fib Zone
Smart Money never misses a good discount… and this BTCUSD setup is that juicy premium-to-discount play we wait for.
🔍 1. Price Action Context
Market sold off into a clearly defined Order Block
Price tapped precisely at the 79% Fib level
Internal liquidity sweep confirmed below recent equal lows
No candle close below OB = structure still intact
This is what we call the "Trap + Reverse" move. Late shorts just got baited.
🧱 2. Confluences Stacking Up
💎 79% Fib Retracement — Deep discount zone for Smart Money
💎 Bullish Order Block — Last up candle before the sharp sell-off
💎 Liquidity Sweep — Price swept short-term lows = inducement
💎 Channel Structure — Midline bounce = potential breakout
The OB + Fib overlap = a high-probability buy zone with minimal risk
🎯 3. Trade Plan
Entry Zone: 108,250–108,650
Stop Loss: Below 108,000
Take Profit: 110,758 (premium zone)
⚖️ 4. RRR (Risk-Reward Ratio)
📥 Entry: ~108,400
🔒 SL: 108,000
💰 TP: 110,758
✅ RRR ≈ 1:5.8
This is sniper-level asymmetric risk. You don’t chase candles — you wait here, like a lion in the grass 🦁.
🔁 5. What to Watch Next
Price must reclaim and close above 108,867 for confirmation
If we get a BOS (Break of Structure) above 109,200 = 🚀
Hold above the mid-channel line = bullish continuation
💬 Comment “LONGED BTC 💎” if you caught this with the OB bounce!
📌 Save this to study OB + Fib synergy.
👀 Watch price action at 109,200 — breakout zone incoming?

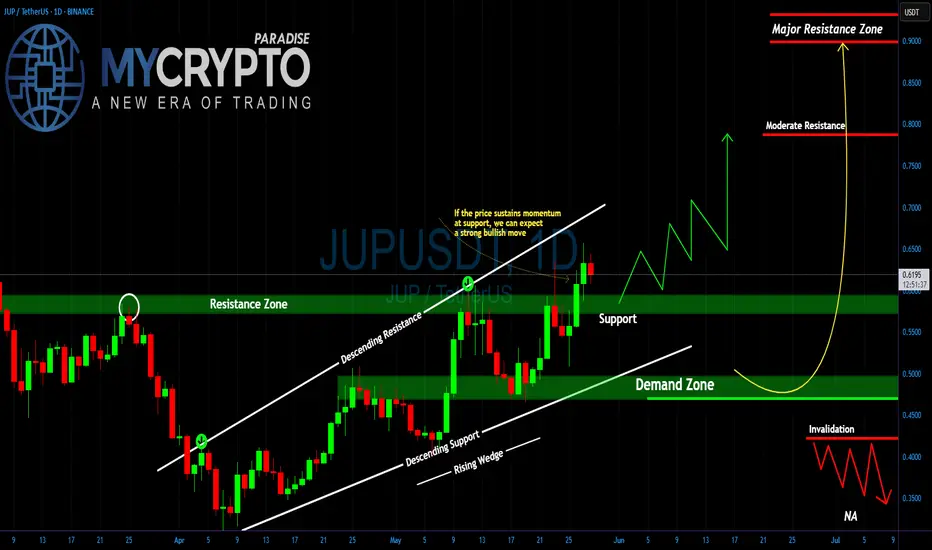
JUPUSDT Breakout... or Classic Bull Trap?Yello Paradisers are you truly prepared for one of the cleanest and most deceptive setups we've seen on JUPUSDT in weeks? A decisive move is building, but so is a very well-placed trap and only those who remain disciplined will navigate it safely.
💎#JUPUSDT has broken above a key resistance level that has rejected price action several times in the past. That same level is now being tested as support, and the market’s reaction here will be crucial. If this retest holds, we could see a continuation of the bullish structure with strong upward momentum. But this is precisely where many get caught assuming it’s a straightforward breakout, when in fact it could be the final bait before the flush.
💎The level at $0.5870 is now our line in the sand. If price remains above it, what we are witnessing is likely a healthy pause and consolidation before another impulsive leg upward. However, if $0.5870 fails, the next area of interest is the demand zone near $0.4718. A sharp move into this region could trap late bulls and shake out weak hands. The key will be whether buyers step in aggressively on that dip. A fast and strong rebound from the demand zone would confirm renewed strength, offering a potential high-probability long entry but only if the reaction is immediate and decisive.
💎To the upside, we are watching the moderate resistance around $0.7865, which could slow the move briefly. But the real game begins near the major supply zone at $0.8992. That’s where we expect smart money to begin unloading positions and anyone serious about preserving profits must be prepared to react accordingly.
💎However, if the price fails to hold even the demand zone and breaks below $0.4718, the entire bullish setup gets invalidated. That becomes our structural flip level, and if breached, we’ll turn bearish and prepare for further downside and potential lower lows.
Discipline, patience, robust strategies, and trading tactics are the only ways you can make it long-term in this market.
MyCryptoParadise
iFeel the success🌴
Ethereum - The bottom is finally in!Ethereum - CRYPTO:ETHUSD - is starting the rally:
(click chart above to see the in depth analysis👆🏻)
Finally, after dropping an expected -65% over the past couple of months, Ethereum is retesting and already rejecting a significant horizontal structure. Together with the strong confluence of support, Ethereum is now creating a long term bottom, initiating the next bullish cycle.
Levels to watch: $2.000, $4.000
Keep your long term vision!
Philip (BasicTrading)

Bitcoin Hits New All-Time Highs — Rally Targets $130K+Bullish Momentum Accelerates:
Bitcoin has reached new all-time highs, confirming a strongly bullish technical outlook. Accelerating upside momentum and growing investor confidence are driving the current rally.
Breakout Confirmation:
A decisive breakout from a broadening wedge pattern has unlocked potential targets in the $130,000–$135,000 range, signaling a likely continuation of the uptrend.
Key Support Levels:
With Bitcoin now trading well above $106,000, the previous resistance at $108,000 is expected to act as strong support during any pullbacks — providing a clear risk threshold for traders.
Favorable Risk-Reward Setup:
This alignment of:
Strong momentum
Completed consolidation
Successful breakout
...creates a compelling risk-reward scenario and reinforces the case for continued upside in the current bull cycle.
Bitcoin may just be getting started on its next leg higher. 🚀🔥
#Bitcoin #BTC #AllTimeHigh #Crypto #TechnicalAnalysis #Bullish #Breakout #MarketMomentum #CryptoTrading #CryptoMarket
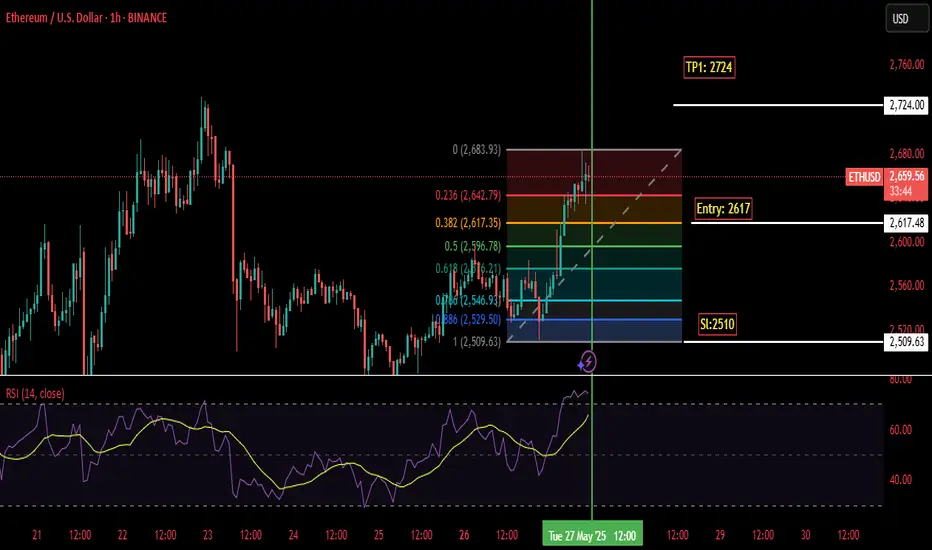
ETHUSDETHUSD has printed potential HH so i will make a buy limit entry using FIB at 0.382 leve(2617) With SL of 2510 and TP 2724 the risk on this trade is 0.3%
Is #LTO Ready for an Explosive Move or Another Trap Ahead? Yello Paradisers! Are you watching how #LTO is quietly tightening within a triangle while the rest of the market looks away? This might just be the last moment of silence for #LTONetwork:
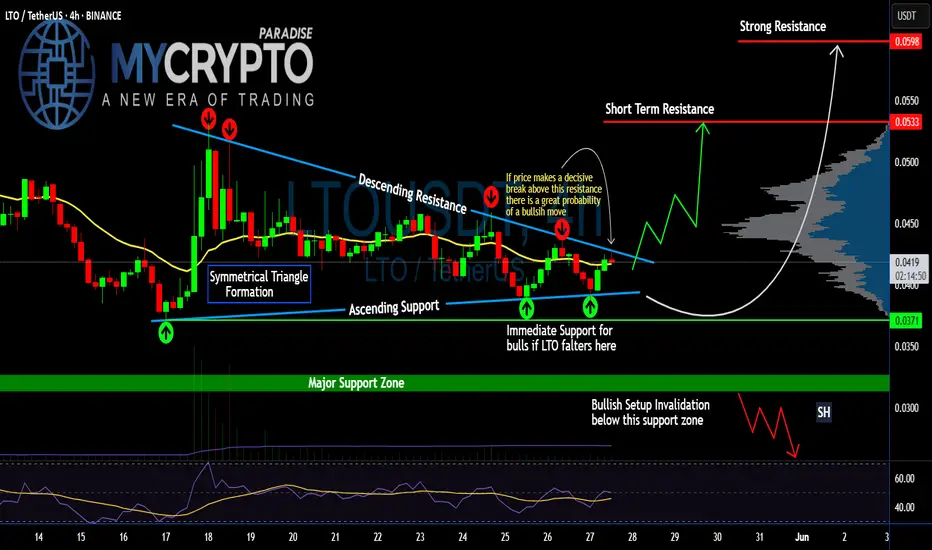
💎#LTOUSDT is currently consolidating within a clean symmetrical triangle, wedged tightly between a descending resistance and an ascending support trendline. This pattern has already seen multiple touches on both edges, suggesting price is nearing the point of decision.
💎What makes this formation more compelling is how #LTOUSD is holding just above the immediate support at the $0.0371 zone and 20EMA is also acting as support. This area has acted as a launchpad twice already, keeping bullish hopes alive. Price is once again pressing against the upper boundary of the triangle, increasing the odds of a breakout on the next attempt.
💎If bulls manage to push above the descending resistance and we see a confirmed breakout with strong volume, the first upside target sits at $0.0533, which is a key short-term resistance level. From there, momentum could carry the price toward $0.0598, where a strong historical resistance lies based on the volume profile.
💎However, the bullish structure is clearly invalidated on a break below $0.0321. Any decisive move under this support zone would shift the short-term outlook in favor of the bears, potentially opening a path toward lower support.
Discipline, patience, robust strategies, and trading tactics are the only ways you can make it long-term in this market.
MyCryptoParadise
iFeel the success🌴
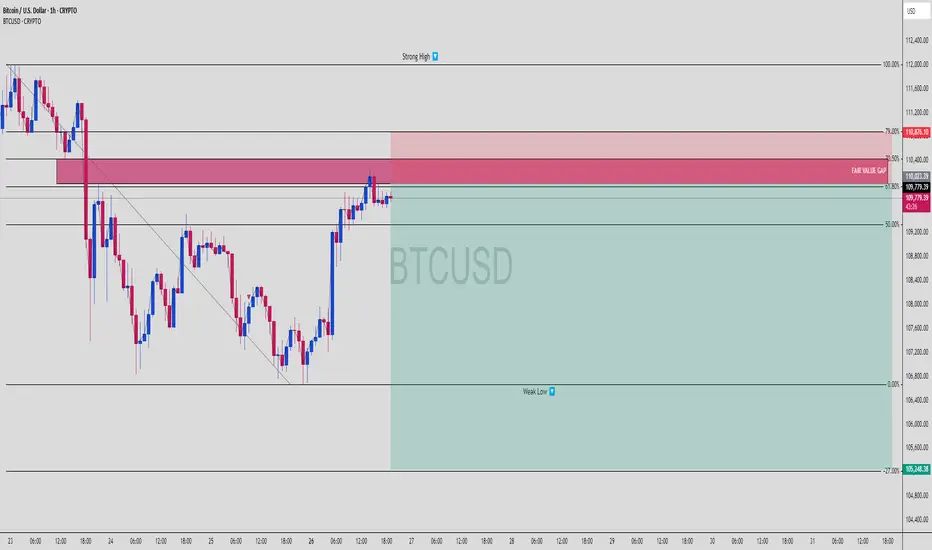
BTC Short Locked – FVG + 79% Fib = Liquidity Grab Incoming📉 BTCUSD | 1H Smart Money Short – Premium Rejection in Play
Bitcoin just tapped into a nasty supply zone that aligns with:
🟥 Fair Value Gap (FVG)
🔻 79% Fibonacci Retracement
💥 Previous Breaker Block Zone
🧠 Clean Internal Liquidity sweep
🚩 Structure still bearish – no HH
🔍 1. Market Structure Breakdown
Price broke down aggressively from the top (early signs of redistribution)
We’re now retesting the FVG + OB zone
No candle close above the Strong High = still valid bearish context
🧱 2. Zone Confluence
📍 FVG (Fair Value Gap): Imbalance created during impulsive sell-off
📍 OB + Breaker: Strong resistance holding inside 70.5%–79% retracement
📍 Strong High: Still protected
📍 Weak Low: Below = prime target for liquidity sweep
Price kissed the edge of that 79% Fib and immediately rejected = 🔥 confidence for a swing short
🎯 3. Trade Plan
Entry: Around 110,800 (inside FVG zone)
Stop Loss: Above 112,400 (Strong High)
Take Profit: 105,248 (below Weak Low liquidity)
⚖️ 4. RRR (Risk-Reward Ratio)
📥 Entry: 110,800
🔒 SL: 112,400
💰 TP: 105,248
✅ RRR ≈ 1:3.5
Solid asymmetric setup with clearly defined structure, inducement, and imbalance = Smart Money textbook trade.
📉 5. Why This Works
Retail longs are entering late = exit liquidity for big players
Price filled the FVG but failed to break structure
Weak low below is clean AF, likely to be swept for continuation
1H/4H alignment = high conviction short
💬 Type "SHORTED BTC 💥" if you saw this setup before the drop!
📌 Bookmark this – confluence stacking is how you win consistently
👊 Share this with someone still buying the top 📈🙃
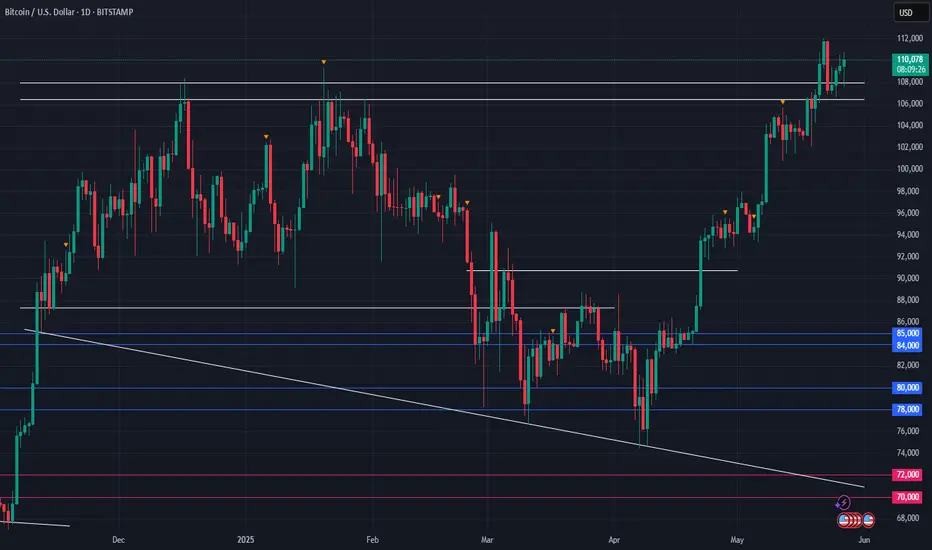
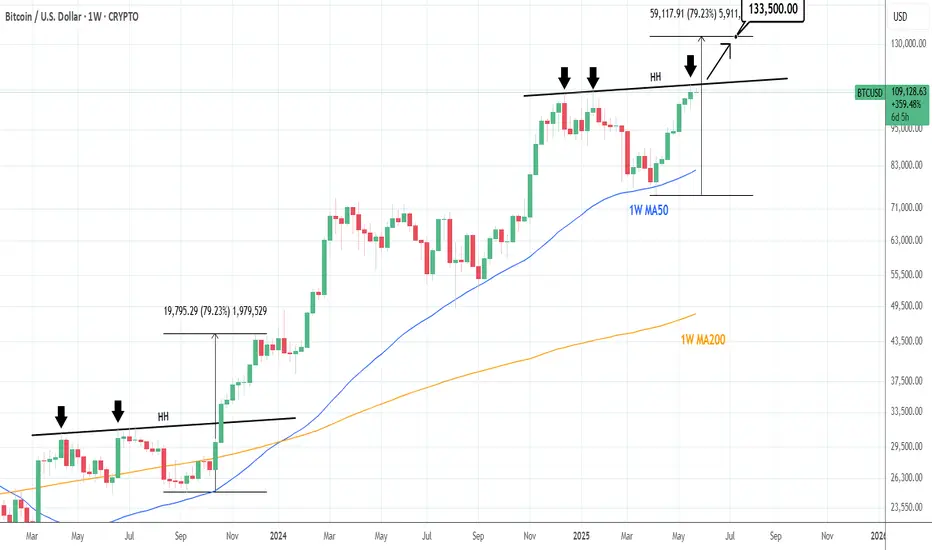
BTCUSD: Urgently needs to break above this trendline!Bitcoin is bullish on its 1D technical outlook (RSI = 65.624, MACD = 4011.100, ADX = 25.476) but not overbought anymore as the aggressive weekly rallies since the 1W MA50 rebound have been decelerated. The next heavy obstacle is the HH trendline that runs on top of the January 20th 2025 and December 16th 2024 Highs and got hit last week. So far the price hasn't crossed above it but it needs to urgently in order to avoid a rejection with snowball effects.
The last time Bitcoin faced a similar HH trendline Resistance was on the October 23rd 2023 1W candle and it succesfully smashed through it, completing a +79.23% rise before consolidating again. If it breaks again above it, we expect the same minimum rally, which gives us a TP = 133,500.
## If you like our free content follow our profile to get more daily ideas. ##
## Comments and likes are greatly appreciated. ##
Bitcoin : Impulse up or Flat Trap!?If you find this information inspiring/helpful, please consider a boost and follow! Any questions or comments, please leave a comment!
BTC has staged a solid move off the May 25 low — but the context matters. We’re facing two distinct, high-stakes scenarios here: one bullish, one bearish. What happens next hinges on whether the May 25 rally is the start of a new impulse or the final leg (C wave) of an expanded flat off the all-time high.
Structure Breakdown
Bearish View: We’re completing a textbook expanded flat from the ATH:
A wave started May 23
B wave pushed to a lower low.
C wave began May 25 and is likely wrapping up now
If valid, this sets the stage for a powerful Wave 3 down.
Bullish View: The May 25 low marked the end of a corrective phase:
Rally from that low is an impulsive Wave 1
A pullback to the 108k golden zone would represent Wave 2
Wave 3/C up could follow from that base
What to Watch
The area around 108,000–107,100 is a magnet. If price retraces into this zone with a corrective look and holds, bulls could be in control. But if we roll over hard from here, it supports the expanded flat thesis — and a much deeper move likely follows.
Outlook
This is a moment for sharpen focus. The chart structure is clean, but the outcome isn't binary until we see what kind of retrace (if any) forms.
Watch 108k like a hawk. If bulls defend it, there’s room to talk new highs. If we break impulsively from here, expect acceleration lower — fast.
Trade safe, trade smart, trade clarity.

ADA Is Approaching a Trap Zone ? Yello Paradisers, are you watching how ADA is slowly coiling up near a crucial level while pretending nothing’s happening? Don’t be fooled — this is the calm before the storm, and the next move could wipe out the unprepared.
💎#ADAUSDT is currently respecting a well-established ascending channel. We’ve already seen three meaningful reactions at the ascending support, each triggering fresh bullish momentum. At the same time, the price is pressing just above a key demand zone around the $0.73–$0.74 region. This level remains absolutely critical for the bulls to defend if the structure is to remain intact.
💎What adds strength to this setup is #ADA’s current trading position above both the 50 EMA and 200 EMA on the daily timeframe. This reinforces the short-to-mid-term bullish bias. The 50 EMA is starting to slope upward, signaling that momentum could be gradually building, while the 200 EMA sits well below as solid structural support.
💎As long as the price continues to respect the ascending support line and stays above the demand zone, we expect a continuation move toward the $0.8728 moderate resistance. A successful break and close above that could open up the next leg toward $1.0011, where a strong supply zone sits waiting.
💎The real danger lies below $0.6495. A daily close under this level would not just invalidate the current setup it would completely shift market structure and expose ADA to deeper downside, likely towards the $0.60 area or lower.
Discipline, patience, robust strategies, and trading tactics are the only ways you can make it long-term in this market.
MyCryptoParadise
iFeel the success🌴

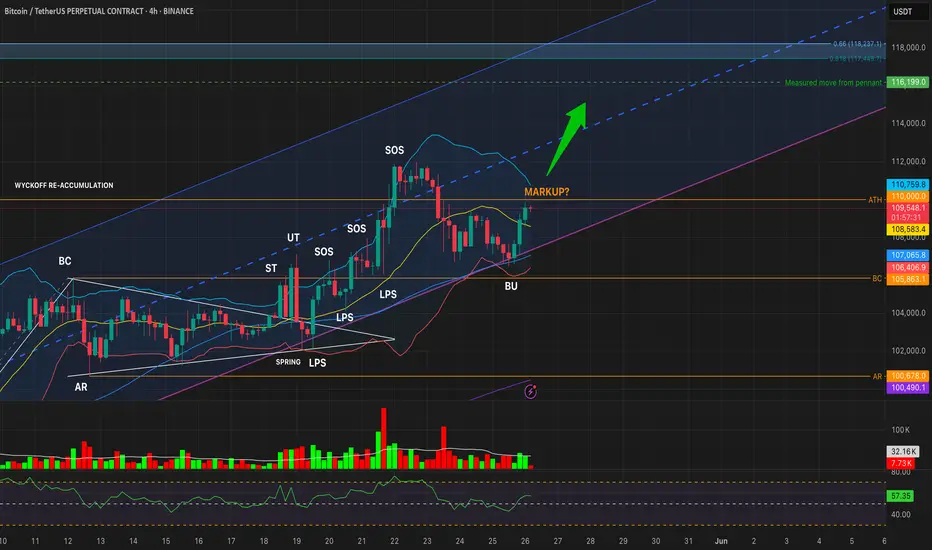
BTCUSDT – Reaccumulation Breakout or Bearish S/R Flip?Timeframes: 1W • 1D • 4H
Structure: Wyckoff Reaccumulation nearing Phase E — but ATH is acting as resistance
🔹 WEEKLY OUTLOOK: Macro Structure Points to Markup
Last weekly candle closed above the reaccumulation Buying Climax (BC), showing bullish intent
Weekly upper Bollinger Band is rising toward 113k
RSI at 67, strong but not overbought
Structure suggests we’re entering Wyckoff Phase E
Weekly Targets:
🟢 TP1: 113,049 (Upper BB)
🟢 TP2: 116,199 (measured move)
🟢 TP3: 118,237 (Fib 0.66 extension)
🔹 DAILY OUTLOOK: Still Holding Above Reaccumulation Range
Multiple daily closes above the BU (backup) zone, but all below 110k ATH
RSI is strong (~66), and price is tracking near the upper BB, but volume is not convincing
Until a daily close above 110,000, breakout remains unconfirmed
🔹 4H OUTLOOK: Structure Valid, Momentum Rising
BU zone held; price made two lower lows followed by a higher high
RSI has reclaimed 57+, and volume is picking up modestly
4H structure looks like an early Phase E breakout attempt, but...
⚠️ Caution: Is This a Bearish S/R Flip?
While the broader Wyckoff structure suggests a transition into markup, we must also consider the bearish scenario:
BTC may be failing a support/resistance flip at 110k
All timeframes have rejected at or below 110k, despite multiple attempts
If we see a lower high under 109k + 1D close below 105,863 with red volume and RSI < 45 → this becomes a confirmed bull trap
📊 TL;DR:
BTC is structurally bullish — but we are at the final test zone.
🔓 Breakout confirmed: Daily close above 110k
🔒 Failure confirmed: Close below 105,863 + red volume + RSI breakdown
Stay nimble. This is either the last shakeout before markup… or the top of the range before reversal.
#Bitcoin #BTCUSDT #Wyckoff #CryptoTrading #TechnicalAnalysis #Reaccumulation #Breakout #SupportResistance
ETH Trap & Drop Setup – OB Rejection + Bearish Channel📉 Ethereum (ETHUSD) | 1H SMC Breakdown | Bearish Setup Explained
Another clean setup for the SMC gang. ETH just gave us a beautiful opportunity, respecting market structure, reacting to Order Block supply, and aiming to clean up sell-side liquidity. Let’s dive in 👇
🧱 1. Structure: Bearish Channel Formation
ETH has been moving in a tight bearish channel, producing:
Lower highs (confirmed supply zones)
Lower lows (liquidity grabs + structure breaks)
This shows consistent bearish pressure.
🧊 2. Premium OB Tap + Rejection Zone
Price just retraced into a Bearish Order Block sitting in the Premium zone, right around $2,514.
💥 OB zone is aligned with:
Upper channel resistance
Supply rejection
Clean inefficiency fill
Price wicked inside and immediately rejected = Smart Money active.
🧠 3. Retail Psychology Trap
Retail likely:
Longing support bounce
Placing stops under structure lows
Not respecting OB/imbalance narrative
Meanwhile, Smart Money:
Enters short from OB
Targets imbalanced zones
Eyes the $2,270 weak low
🎯 4. Liquidity Pool & Final Target
🔻 Target Zone: $2,270
This level is:
A weak low (high chance of being swept)
Sits at lower channel boundary
Acts as a liquidity magnet
Expect price to accelerate as it approaches this zone.
⚔️ 5. Trade Plan (Short Setup)
📍 Entry: $2,514 OB Zone
🔐 Stop Loss: Above $2,582 (structure break + OB invalidation)
🎯 Targets:
TP1: $2,460
TP2: $2,400
TP3: $2,270
⚖️ RRR: ~1:4+ – high precision trade
🧠 Key Concepts in Play:
Order Block Rejection
Premium Pricing Sell Setup
Bearish Channel Continuation
Liquidity Sweep Targeting
📌 Chart Summary:
"Don’t chase candles – follow the narrative. OB tells the story, liquidity gives the profit."
📚 Study the OB zone reaction. These setups repeat every week across assets if you know what to look for.
💬 Drop “ETH OB SNIPER” in the comments if this is your kind of entry.
📈 Tag a trader who needs to stop fading Smart Money moves!

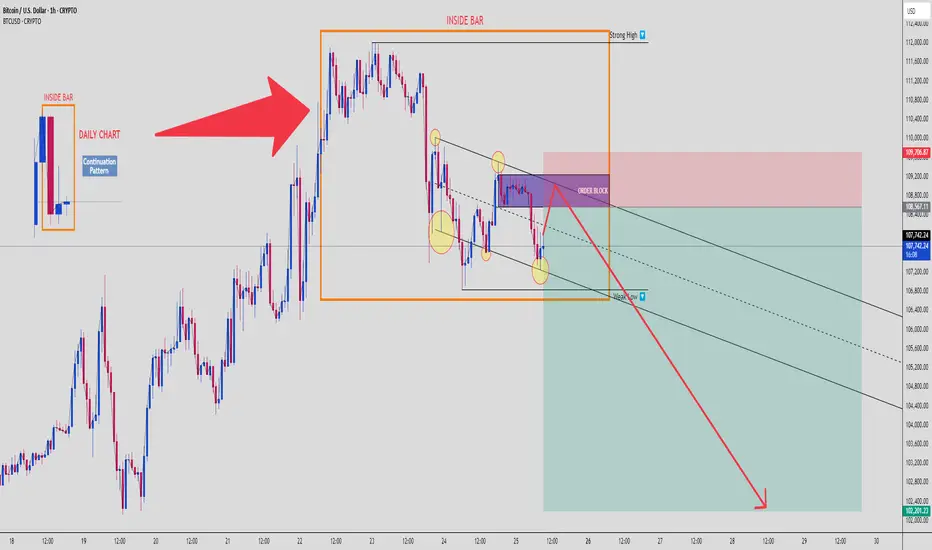
BTCUSD: Inside Bar Trap + Order Block Rejection Targeting $102K📉 Bitcoin | SMC Breakdown | 1H Chart
Welcome to a clean Smart Money setup, where retail gets baited and Smart Money gets paid. Let’s break down what’s happening on BTCUSD, 1H chart, using multi-timeframe confluence and Smart Money Concepts. 👇
🗓️ 1. Daily Chart Confluence
We start with a Daily Inside Bar Pattern – a classic continuation setup, often used by institutions to trap traders before expansion. BTC ranged tightly, then broke to the upside to grab liquidity, not start a rally.
🟥 Daily High = Liquidity Pool
🟧 Inside Bar Range = Manipulation Zone
This is the trap zone.
🧱 2. Order Block Rejection (1H)
Price tapped a clearly defined Bearish Order Block in premium pricing, just above the mid-range of the Inside Bar.
💥 Reaction confirmed:
Rejection candles from OB
Structure respecting downside bias
Fakeout = Fuel for downside expansion
📉 3. Bearish Continuation Structure
Price is moving within a descending channel, respecting internal supply zones. Each lower high is met with supply pressure, and internal lows are swept before moving lower.
You’re looking at a high-probability continuation move toward the weak low marked near $102,200.
🧊 4. Weak Low as Final Target
This level is a classic liquidity magnet – weak lows = retail stop clusters = Smart Money target.
We expect BTC to:
Tap OB
Reject with minor pullback
Break structure
Fill imbalance and target weak low
It’s a beautiful setup if managed correctly.
🧠 5. Psychology & Trap Narrative
Retail is:
Buying the breakout of Inside Bar
Placing stops under weak lows
Ignoring the OB rejection
Smart Money is:
Selling from OB
Riding the imbalance
Grabbing liquidity from below
This is where you flip from reaction-based trading to narrative-based execution.
🧮 6. Trade Setup Summary
📍 Entry Zone: $108,500–$109,700 (OB zone)
🔐 Stop Loss: Above $109,800 (invalidate OB)
🎯 Target:
TP1: $106,500
TP2: $104,000
TP3: $102,200 (Sell-side Liquidity Sweep)
⚖️ RRR: Approx. 1:4 to 1:5 depending on entry
⚠️ Risk Management:
Do not overleverage.
This setup rewards patience and narrative confirmation, not emotional entries. Wait for OB confirmation and rejection.
📈 If this hits, it’s a chart you screenshot and study again and again.
💬 Comment “INSIDE BAR MASTERCLASS” if you’re watching this play out live. Share with your trading circle.
Sideways Still in Play for ETH After RejectionIf you find this information inspiring/helpful, please consider a boost and follow! Any questions or comments, please leave a comment!
Recap
Ethereum just tapped into a key Area of Interest and got rejected. The move confirmed short-term resistance while keeping the broader wave structure intact. Although no clear breakdown has followed, the rejection signals that the asset is still mid-cycle.
The expectation now is for a sideways consolidation. This aligns with a developing wave 4, but the price action ahead will determine how this structure unfolds.
Wave Structure
At present, the count favors a completed wave 3 followed by a wave 4 that is still forming. The rejection at the AOI fits the narrative of a corrective structure underway. Whether that plays out as a triangle or a flat will depend on how the next legs print.
Key markers are in place:
AOI was respected
No breakdown of the prior key support level
Above the 0.382 to 0.5 retracement zone remains in focus as a reaction area
Should price expand beyond typical retrace/time boundaries, the degree of the count may need to be adjusted. A more complex correction or a deeper reset could shift the current interpretation from a wave 4 into something more substantial.
Outlook
• Rejection confirms resistance
• Expecting sideways movement to continue
• Watching the 0.382 to 0.5 zone for key price behavior
• Price action will determine the next wave structure
• If momentum expands rapidly, degree reassessment is on the table
Ethereum’s current posture suggests a market in digestion mode. Whether this leads to a launch into wave 5 or deeper corrective behavior, the next prints will be critical. No confirmation of bullish continuation yet.
More updates soon as the next leg develops.
Trade safe, trade smart, trade clarity.

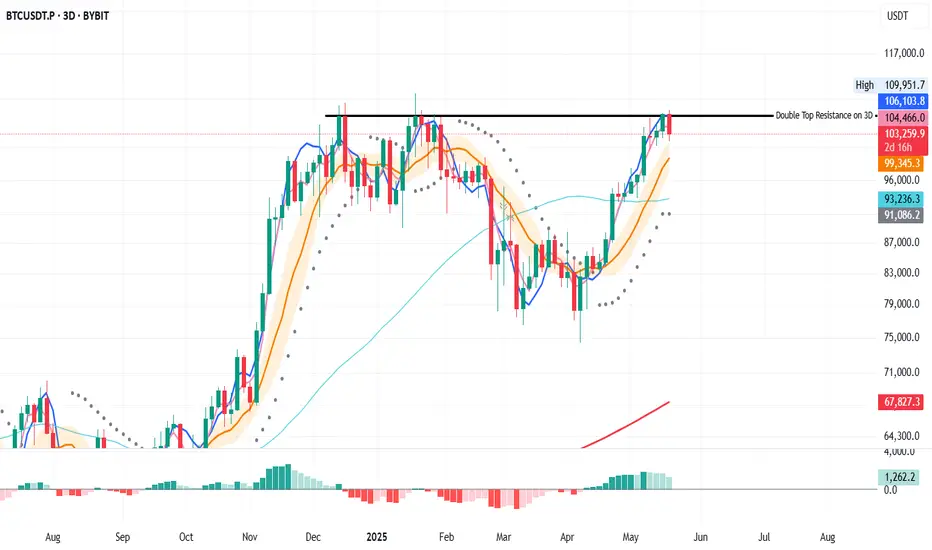
Is BTC Poised for a Pullback or Continuation? Key Levels on 3D We’ve got a strong resistance level formed by the double top from Dec 14, 2024, and Jan 19, 2025.
✅ Price is above the 200MA, 50MA, and Bollinger Bands.
✅ MLR > SMA confirms the bullish momentum.
I don’t see any immediate reasons to panic. A pullback to the Bollinger Bands or even the 50MA could be in play, but the price action will depend heavily on macro conditions. 🌎
⚠️ If you're highly leveraged, consider risk management. Keep an eye on price action and stay cautious.
📈 Keep close, follow me for more insights, and thank you for reading! Stay safe. 🙏
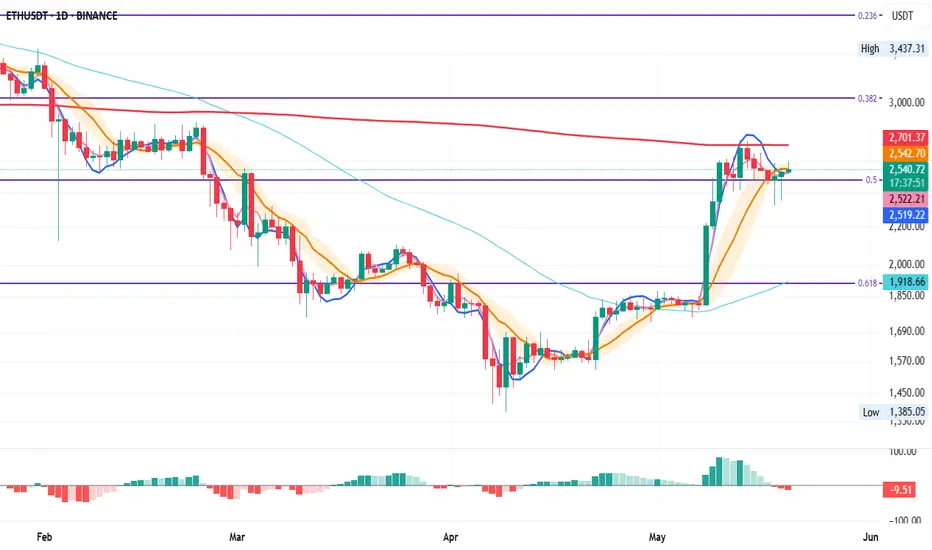
ETH Update: Pressed Between Key Levels on the Daily
ETH is currently pressed between the 200MA and the 50% Fibonacci level—two major areas of interest.
On May 14th, we saw a clear rejection at the 200MA, followed by solid support at the 50% Fib on May 18th-19th. 📉
MLR < SMA < BB Center isn't ideal, so we need to play it safe and let price do its thing. If we close above the BB Center and macro conditions support the move, we could see upside. 🌱
⚠️ Keep safe, follow for unbiased TA, and always manage risk! 📊
OTHERS 200MA – Next Attempt: If and When?
On the Others daily chart, there’s a formed inverse head and shoulders. The base of the formation acted as support during the last drop after rejection from the 200MA.
Now, price is attempting to push through the BB center, with SMA and MLR helping from underneath. Additionally, there’s a clear ascending trendline that continues to act as dynamic support.
Only price action will confirm the next move toward the 200MA.
Posts come from time to time—interactions help with visibility.
Manage risk—it’s the only constant

PENGU 12H – System Entry Triggered
PENGU just gave a system entry on the 12H time frame.
📌 The black line represents entry points from the 3D and 1W time frames. It has acted as a key level in the past and has now been flipped into support again.
📈 Price is currently pushing into the pink box, which may act as short-term resistance. Keep an eye on how long it takes to break through this zone—if it lingers too long, we might see a temporary rejection.
🟢 OBV is rising
🟢 MACD is turning bullish
🟢 Fundamentals look very strong
I believe PENGU still has upside potential from here.
✅ Stick to the system—no guessing tops. Let price action guide the decisions.

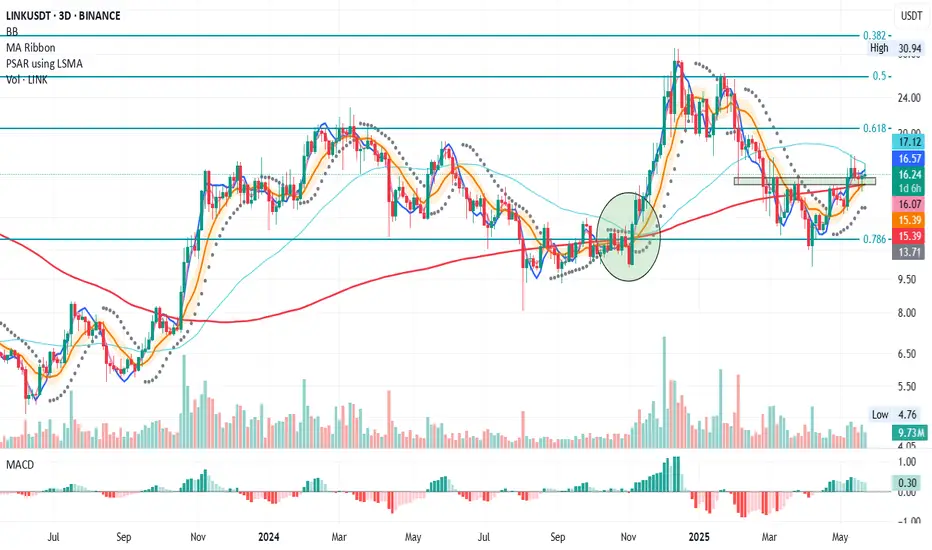
LINK 3D – Watching the 50MA Reclaim
After a clear rejection at the 200MA on April 25, LINK is now trading above the 200MA, but has faced rejection at the 50MA.
The green zone represents a key support area that started forming on Feb 3.
✅ MLR > SMA > BB Center, confirming that the bullish structure remains intact.
🔍 Note how the BB center and SMA are now aligned. The last time this happened (see orange zone) was also after a drop, and the recovery only started after price reclaimed the 50MA.(see green circle)
Unless macro headwinds (e.g. tariff war escalation) drag the market down, the key level to watch is the 50MA. A close above it could mark the next leg up. 📈
Thanks for reading!
If you found this useful, give it a like or drop a comment.
Manage risk, take profits.
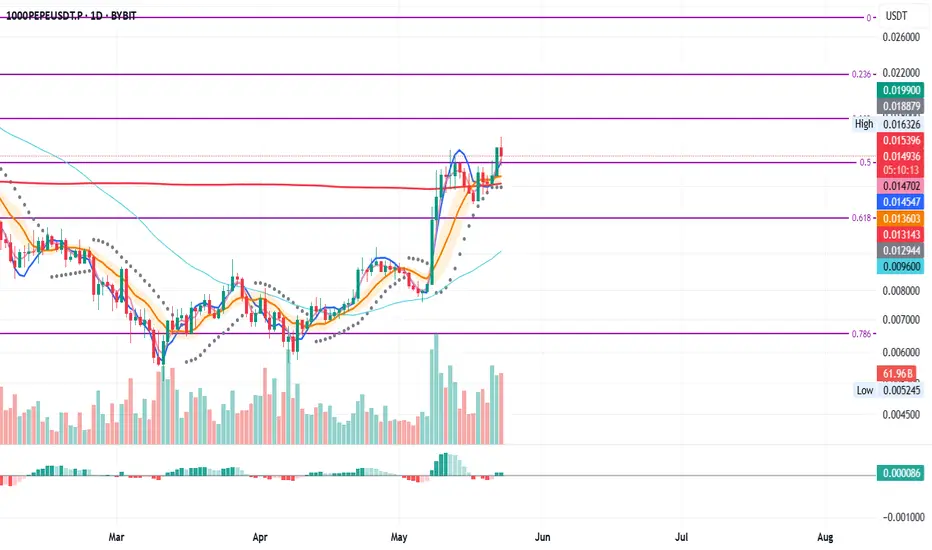
PEPE Daily – Testing Key Fib Support
After getting rejected at the 0.5 Fibonacci level on May 14, PEPE is now retesting it as support.
On the way down, price found support at the 200MA, even after briefly closing below it on the daily chart.
You could argue MLR > SMA, but both are still above the BB center and the 200MA, which maintains the overall bullish structure.
⚠️ Watch for a daily close below the 0.5 Fib—that would weaken the structure and could lead to further downside.
Look closer at smaller time frames.
Thanks for reading—if you found this engaging, react or comment.
Always manage risk and take profits. 📊
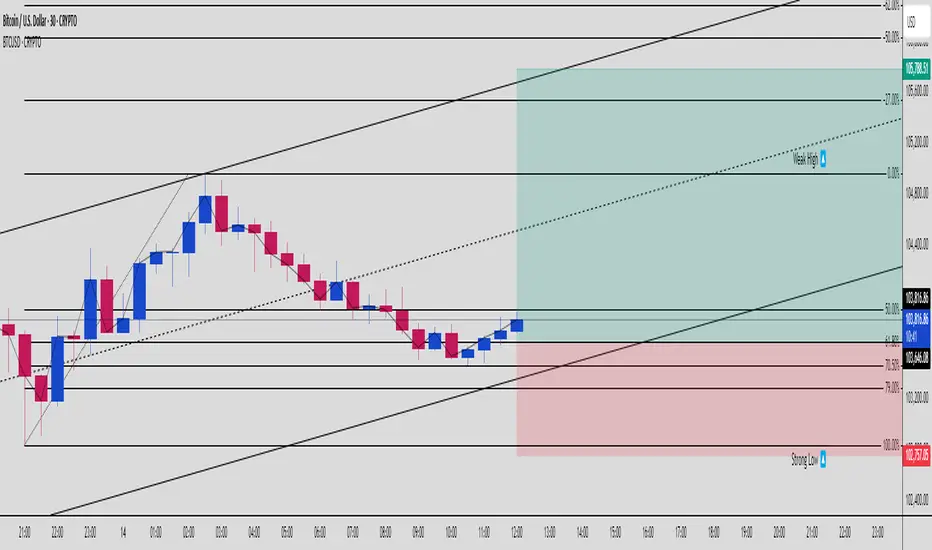
BTCUSD Set to Reclaim This Weak High,Watch This Smart Money Zone📊 BTCUSD 30-Min Smart Money Concept Setup
Let’s dissect this high-probability Smart Money setup on BTCUSD, which just tapped into a premium-to-discount range retracement and looks ready to reverse from demand.
🔻 1. Market Context
We saw a strong impulsive move up earlier today, followed by a corrective move pulling back into the 61.8–79% fib zone, lining up with internal liquidity and support zones.
Price just respected that 61.8% level with multiple bullish rejection wicks, indicating a potential bounce.
🧱 2. Key Zones Identified
Strong Low: 102,757.05 — protected for now
Entry Zone: 103,646 – 103,758
Weak High Target: 104,800+
Final TP: 105,788.51 (aligned with -27% fib extension)
The confluence of internal trendline support and fib levels supports the bullish narrative.
📈 3. Trade Setup + RRR
✅ Entry: Around 103,750
❌ Stop Loss: Below 102,800 (beneath strong low)
🎯 Take Profit: 105,780
📊 RRR: ~4:1+
This setup offers a clean low-risk, high-reward opportunity with minimal drawdown.
🔥 4. Why This Is Smart Money Approved
✅ Deep retracement into discount zone
✅ Strong bullish structure + weak high liquidity above
✅ Trendline support confluence
✅ Smart Money targeting liquidity
✅ Higher timeframe bullish bias still intact
💬 Type “⚡️BTC Weak High Raid Loading” if you’re riding this wave too!
🚀 Follow @ChartNinjas88 for more precision Smart Money plays like this.