Impulse or Illusion? Key Level to Watch If you find this information inspiring/helpful, please consider a boost and follow! Any questions or comments, please leave a comment!
Recap
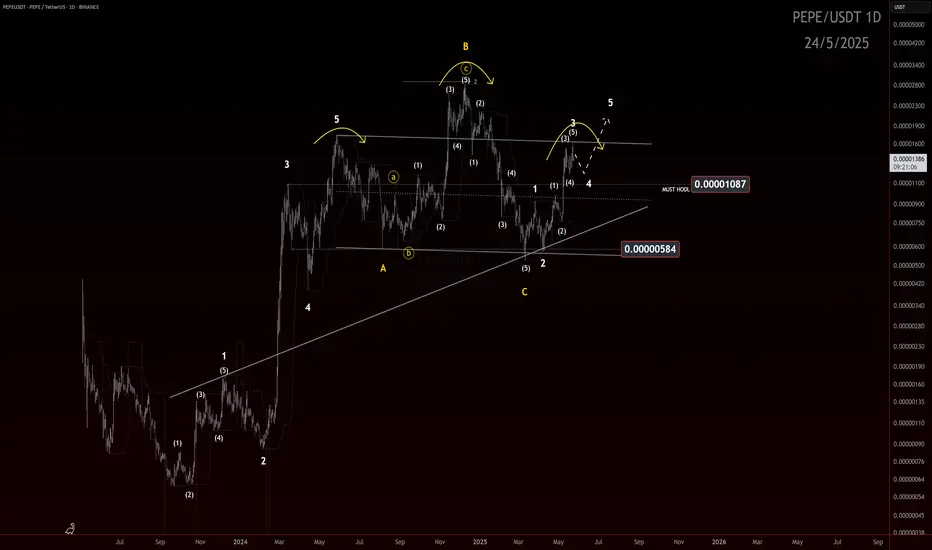
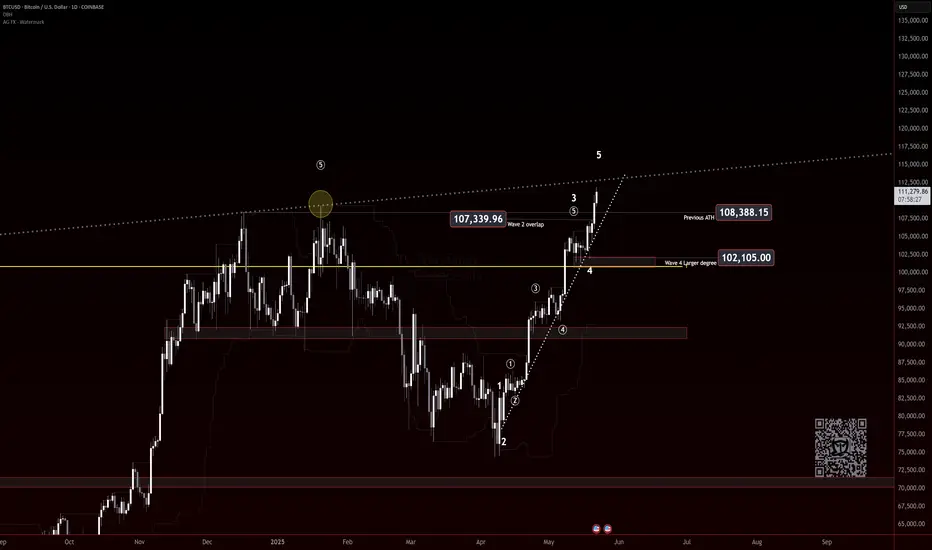
Since the price surge off the March 11 low, structure appears to be developing into a potential 5-wave impulse. However, with only three legs printed so far, it remains premature to confirm the full impulse structure.
Structure Assessment
The move resembles a possible ABC zigzag, but the center leg (possible wave 3) is showing strong impulsive characteristics — momentum, follow-through, and vertical lift. That raises the probability of it being an unfolding wave 3, rather than just a C wave.
What’s missing? A clear wave 4.
Until a fourth wave correction is established, and followed by a decisive wave 5, the bullish impulsive count remains tentative.
Outlook
📌 Key level: 0.00001087
The hold of this level will make the look of the structure ideal.
A break below 0.00001087 would dip into unacceptable territory for a developing wave 4 and opens the door to a bearish reassessment — and if the PA enters the price territory of the wave 1 cause a conclusive invalidation of the potential impulse.
✅ If price holds the level and a shallow wave 4 consolidates, we can then watch for signs of wave 5 to confirm the impulse and unlock bullish continuation potential.
Watch this level. Structure will confirm or collapse soon. More updates to follow.
Trade safe, trade smart, trade clarity.
Cryptotrading
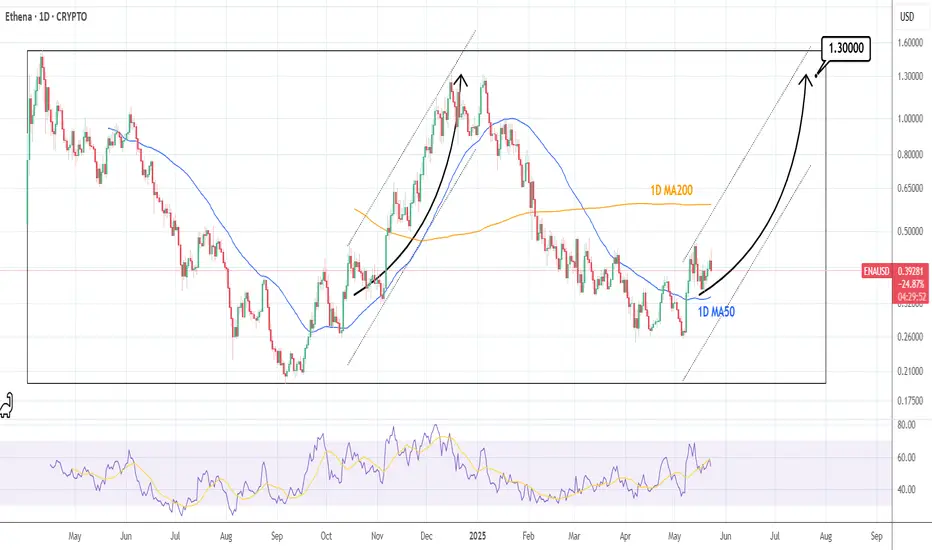
ENAUSD: Strong bullish wave startingEthena is neutral on its 1D technical outlook (RSI = 52.271, MACD = 0.053, ADX = 32.166) as it's trading between the 1D MA200 and 1D MA50. The last time a rebound was supported by the 1D MA50, was in October 2024 and was the start of a Channel Up to the top of the Rectangle. Go long and TP = 1.3000.
## If you like our free content follow our profile to get more daily ideas. ##
## Comments and likes are greatly appreciated. ##
BTCUSD: 1D Golden Cross signals more upside to 155k.Bitcoin dropped below the overbought barrier on its 1D technical outlook (RSI = 69.592, MACD = 4447.700, ADX = 32.855) following today's Trump led pullback. On the long term though, this is nothing but a technical reaction to fundamentals and not enough to invalidate the bullish trend as not only did we make new ATH this week but also just completed a 1D Golden Cross. This is the first such pattern since October 27th 2024, which validated the previous bullish wave that peaked on the 2.0 Fibonacci extension. According to that, Bitcoin should extend the current uptrend with TP = 155,000.
## If you like our free content follow our profile to get more daily ideas. ##
## Comments and likes are greatly appreciated. ##

BTCUSD (Bitcoin) Setting Up for a Trap and Crash📊 BTCUSD Smart Money Breakdown – May 23, 2025
This is a textbook liquidity trap setup — and the roadmap is crystal clear. The market already induced buyers at the top, is now tapping into an Order Block (OB) + 79% zone, and is preparing to nuke.
🔍 Market Narrative:
Strong high established – retail likely placing longs above that.
Clean retracement into Order Block zone (110,322 – 110,850) – where Smart Money is selling into demand.
PA is projected to fake a bullish breakout, reverse, and go for a deeper Fair Value Gap fill near 107,786, eventually targeting the Sell-Side Liquidity zone at 106,188.31.
📍 Key Confluences:
✅ OB + 79% Fibonacci = strong SMC reversal zone
✅ Clear FVG waiting to be filled = imbalance = magnet
✅ Weak low at 107,786.83 = perfect inducement for Smart Money run
✅ Final stop = Sell Side Liquidity sweep below 106,200
📉 Price Path Forecast:
Reject Order Block + Premium zone (110,496 – 110,850)
Retrace → FVG fill (between 108,900 – 107,800 zone)
Minor pullback or fake rally
Final move: liquidity raid under 106,188
Smart Money buys low again, setting up next bullish leg (later)
🎯 Trade Plan (Short Idea):
Entry Zone: Between 110,322 – 110,850 (OB)
SL: Above 111,000 (above inducement)
TP1: 107,786 (Weak Low)
TP2: 106,188 (Sell-Side Liquidity Pool)
RRR: Approx. 1:4 to 1:5 🔥
🧠 Institutional Logic:
Retail sees sideways structure = buys top resistance
SM sees that = sells into premium zone
This is accumulation → manipulation → distribution at its finest.
💬 Think BTC’s about to drop hard? Type “DUMP” or 🔻 in the comments! Let’s see who’s trading with the big boys.

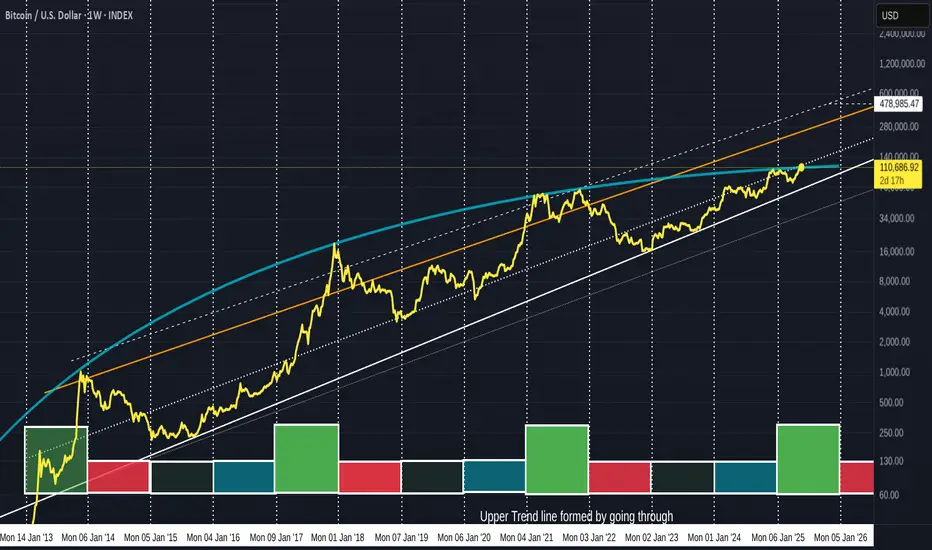
BITCOIN 5 lines and 3 indicators to watch now we in new ground
I will be presenting a number of charts here and each has a different story to tell right now.
The 5 lines are All valid trend lines.
The Vertical lines are January year markers
The white line at the bottom is th e long term support line from 2013
The Dotted line is a threshold line
The Blue Arc is a line that has rejected EVERY ATH since 2013
The orange line is a marker that, once crossed has Always led to a New cycle ATH
The upper dashed line is the line of rejection of all ATH since 2017
The Weekly Bitcoin PA chart
Here we can clearly see how that Blue Arc has rejected PA previously. We can see how PA has reached a point of intersection and once it crosses that blue Arc, there is a line of rejection just above.
This Blue line needs to be crossed and held as support.
The Daily version of this chart shows ua how we have just crossed that blue Arc.
It also shows us how FRAGILE this is right now. PA is currently testing that Blue line as support
This needs to Hold. If we manage to hold this line and bounce, Stiff resistance is found around 120K
The following charts are showing the following indicators
The 3 indicators used are
RSI - Relative Strength Index. used to measure the speed and change of price movements
TSI - True Strength Index, used to indicate trend direction and overbought/oversold conditions.
ADX - The Average Directional Index (ADX) is used to measure the strength of a trend, not its direction
The 4 hour chart - short term expectations for the weekend
Bitcoin PA the Yellow line at the Top, the indicators are in the order listed above,
First thing to see here is how BTC PA is retesting that Blue Arc - this really needs to hold
RSI (blue) - OVER BOUGHT, It has fallen below its own MA ( average) and could easily drop further today. Looking back along this, we can see how the 4 hour RSI likes to range along the Neutral line, so we may see it drop back to that level today, tomorrow
TSI is also OVER BOUGHT. We can see when TSI is up here, PA ranges while it cools off. But there is room for one little push here if required
ADX ( yellow ) is high showing trend could be getting near exhausted, The orange line is the DI+. This shows positive prince direction, the Red one is DI- and shows that negative price direction is climbing slightly.
In the short term, we need to see PA hold above the Blue line but the likelihood is to possibly back below. There is support below.
The WEEKLY shows us that PA has the ability to continue for a while longer but we are getting near a point where PA needs to recover
Here we can see how the RSI and TSI are both up high, on the edge of OVER BOUGHT but with the ability to rise further.
What is VERY important to take note of here is that ADX.
It is Low, this is indicating that the weekly Trend has lost strength now. It could continue lower.
Remember, ADX DOES NOT SHOW TREND DIRECTION, JUST STRENGTH
So, the thing to see here is that we are in an area where we could see a New Trend begin. This trend could be either Bullish or bearish
On a weekly chart, this change can take a long time to appear in PA
And for the Longer Term, The Monthly Chart gives us hope for a fuhrer push higher for the rest of the year but one little warning bell
WE See Both RSI and TSI up high again, where they have been since 2024. But neither of them are up in OVER BOUGHT as much as they have been in previous cucle Tops.... So we can assume room to move higher.
But what does ring a bell is that ADX again. It is once again, in a place of Change and on this chart, showing that the current trend can start becoming weaker. However, DI+ has plenty of room to move higher
So, in conclusion, we see that BITCOIN has the ability to continue higher but in the short term, we may see a pause and possinle Volatility
Trends are about to change, This could take Weeks and PA can continue higher while a trend weakens.
For me. we are in the last few months of this cycle and at a point of Decision.
PA MUST get over that Blue Arc that has rejected Every ATH since 2013.
If PA fails this, we go back to sub 90K but this is unlikely,
There are numerous projections that see BTC PA in price discovery reaching the 120K before serious resistance.
On this chart, if PA follows pattern and trends, we could see 378K by year end
Getting over that irange line is KEY
Stay safe everyone.
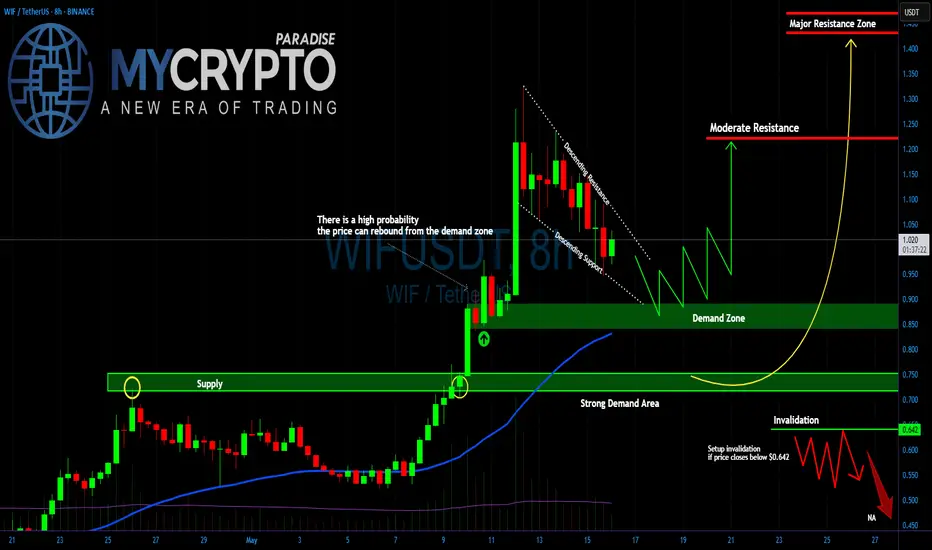
WIF/USDT About to Explode or Collapse?Yello Paradisers, have you prepared yourself for what’s about to unfold on SEED_WANDERIN_JIMZIP900:WIF ? Because this setup is screaming opportunity but only for those who are ready to act with precision and patience.The current price structure is forming a classic descending wedge, a pattern that historically resolves with explosive moves. But here’s where it gets really interesting.
💎#WIFUSDT is now grinding toward a key demand zone between 0.82 and 0.87, where there is a high probability of a strong rebound. This zone aligns perfectly with the 50 EMA, further reinforcing the potential for a bullish reversal.
💎If the demand holds, we could easily see price break out from this compression pattern and push toward the moderate resistance near 1.22. Above that, the major resistance zone around 1.42 to 1.45 remains the next magnet a zone where large players are likely to take profit or even reverse positions.
💎However, we’re not ignoring the bear case either. If this demand fails to hold, and the price we are expecting for a bullish rebound from the lower demand at $0.719 closes below 0.642, the setup becomes invalidated, and the door opens for a deeper correction—possibly driving price toward or even below the 0.50 level. That would flush out overleveraged positions and trap breakout traders on the wrong side once again.
Patience and precision will be your edge in this volatility. Be a pro. Trade smart. Stay disciplined.
MyCryptoParadise
iFeel the success🌴
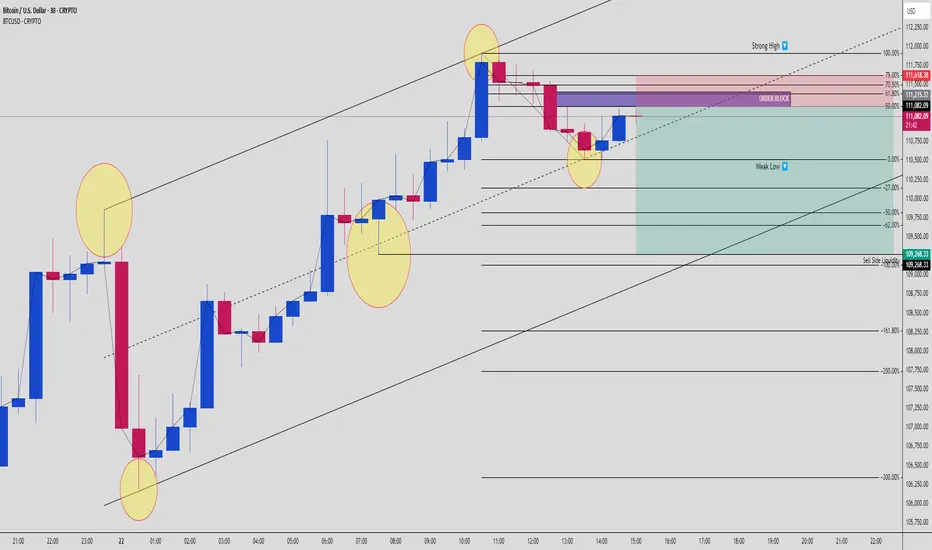
BTCUSD Double Tap Into OB Before Massive Sell-Off! 2,000+ PipsHere’s why this could be one of the cleanest bearish setups of the week based on institutional flow and price action:
🚨 Step 1: Liquidity Engineering in Full Effect
We’ve got multiple areas where price was engineered to grab liquidity — clearly visible with those highlighted zones. Bitcoin pumped into a Strong High, tagging liquidity above a key trendline while respecting an internal parallel channel.
This move was not random. It was a textbook liquidity sweep.
🔁 Step 2: Order Block + 70.5% Fib Confluence
After the sweep, price retraced precisely into a bearish Order Block that overlaps perfectly with the 70.5% Fibonacci level — a hidden gem Smart Money loves to use for optimal entries. It’s the sniper zone.
This is where the first rejection came in, marking the start of bearish intent.
⚠️ Step 3: Break of Structure + Weak Low Exposed
As price dropped, it broke back under a weak low, confirming shift in market structure. This is your Change of Character (ChoCh) — the moment sellers regain control.
We’re now seeing retracement candles struggling to push above the OB/Fib zone. Rejection here confirms the setup.
🎯 Target Zones Breakdown:
✅ TP1 - Weak low around 110,200
✅ TP2 - -27% Extension (~109,500)
✅ TP3 - -62% Fib extension (109,268)
🚀 Extended Target - Possible sweep of Sell Side Liquidity all the way to 108,000–107,500
This is a potential 2000+ pip move if the full extension plays out.
🧠 Market Psychology in Play:
Institutions love to trap traders long after major breakouts. That last pump into the high? It wasn’t retail demand — it was liquidity generation. Now that they’ve swept the highs, they're driving price down to rebalance and mitigate.
Every highlighted zone on this chart? It’s a Smart Money footprint.
📌 Entry Game Plan:
Watch how price behaves around the current OB zone (111,250–111,618).
If price rejects and flips back under the midpoint (111,116), that’s your trigger.
Enter with tight SL above 111,750 and aim for TP1, TP2, and trail the rest to TP3 or lower.
📈 Risk Management Reminder:
Set your SL above structure.
Don’t overleverage — this is a clean setup, but patience is 🔑.
Let price come to you, not the other way around.
✍️ Final Thoughts:
This BTCUSD setup screams Smart Money — we’ve got:
Liquidity grabs ✅
Clean OB + Fib confluence ✅
ChoCh + structural rejection ✅
Strong R:R with multiple targets ✅
This might be the move to catch before the weekend liquidity sweep.
💬 Comment "BTC MOVE" if you’re watching this with me!
🔁 Tag your trading fam who needs to see this breakdown!
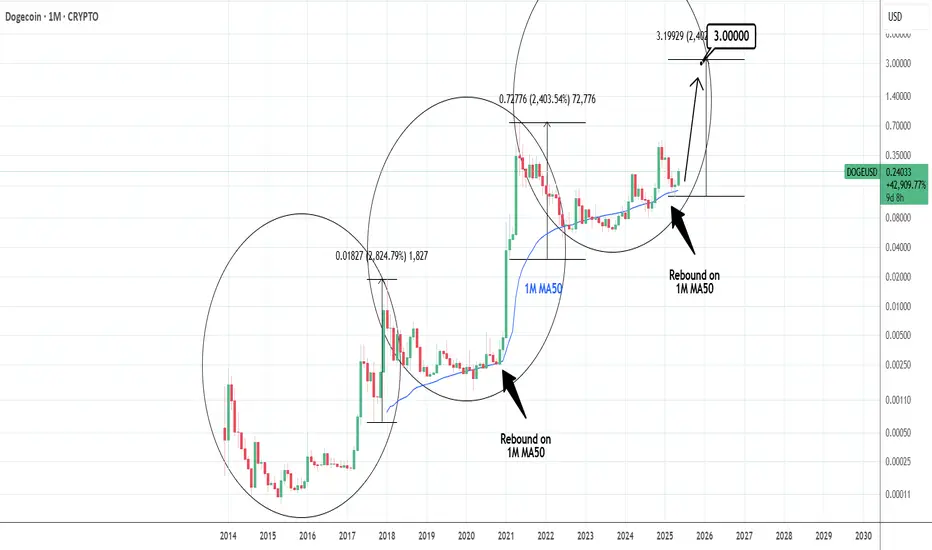
DOGEUSD: Hasn't said its last word. $3 within reach.DOGE is bullish on its 1D technical outlook (RSI = 64.264, MACD = 0.014, ADX = 32.304) fueling a larger move on the 1M candle which last month rebounded exactly on the 1M MA50. This suggests that long term, Doge is on the very same spot as it was on both prior Cycles in February 2021 and September 2017. Both were the last lows before the end Cycle rally, which was on average +2600%. If it's repeated, Dogecoin can very well reach $3.00 by the end of the year.
See how our prior idea has worked out:
## If you like our free content follow our profile to get more daily ideas. ##
## Comments and likes are greatly appreciated. ##
BTC is high! Any Weakness?If you find this information inspiring/helpful, please consider a boost and follow! Any questions or comments, please leave a comment!
Bitcoin Breaks to All-Time Highs — What’s Next for Price Structure?
Bitcoin has officially pushed into new all-time highs, and while the move wasn’t entirely unexpected, it still packs a punch. We discussed this possibility in recent videos, though I wasn’t fully convinced at the time. That’s the nature of trading—uncertainty is the cost of admission, and conviction builds as structure confirms.
As always, I was watching the price action closely. BTC started providing the clues needed to lean into the more bullish interpretation. The levels held. The flips were clean. Momentum lined up.
That said, I did take some speculative shorts at lower degrees—not to fight the trend, but to respect possible overextensions within the count. For those following the Elliott Wave roadmap, these intraday reactions were worth probing, but nothing confirmed a larger reversal yet.
The key now is structure.
We’re currently navigating uncharted territory, and in these zones, understanding wave context and market behavior around prior resistance becomes even more critical. There’s no overhead supply—only psychology, fib projections and profit-taking to watch for.
Here’s what I’m focused on:
Clear labeling of the motive sequence—is this the end of a Wave 3 or just a smaller subdivision?
Volume behavior and momentum divergence—looking for any signals that we’re near exhaustion.
Pullback zones—marking areas where Wave 4 or consolidation might emerge, if it’s due.
This is a time to stay sharp, not euphoric.
Trade safe, trade smart, trade clarity.
Is MANA About to Break Out?Are You Ready for It?Yello Paradisers, can you feel the calm before the storm? MANAUSDT is quietly setting up for what could become a major breakout move and most traders won’t see it coming until it’s already too late. That’s exactly the kind of opportunity we love to prepare for in advance.
💎#MANAUSDT has been consolidating inside a clearly defined descending channel, marked by consistent lower highs and lower lows since its liquidity sweep above $0.39. This cooling-off phase has allowed the market to reset after that aggressive move, but now, the structure is starting to shift.
💎What’s important here is the price action around the horizontal resistance-turned-support level near $0.33. Price is currently hovering just above this zone, and early signs of a breakout are beginning to show. A clean candle close above the descending resistance of the channel will be the confirmation signal that many smart traders are waiting for and it could set off a wave of FOMO driven momentum.
💎Below the structure, we see a well-defined major demand zone between $0.2950 and $0.3100. This is where buyers stepped in aggressively after the channel lows were tested. As long as price stays above this zone, the bullish setup remains valid. However, if we get a confirmed candle close below that demand zone, the entire structure becomes invalidated, and further downside becomes likely.
It’s not about catching every move it’s about catching the right ones with proper validation and risk control. Trade smart, Paradisers.
MyCryptoParadise
iFeel the success🌴

Caught the pivots up, now what?If you find this information inspiring/helpful, please consider a boost and follow! Any questions or comments, please leave a comment!
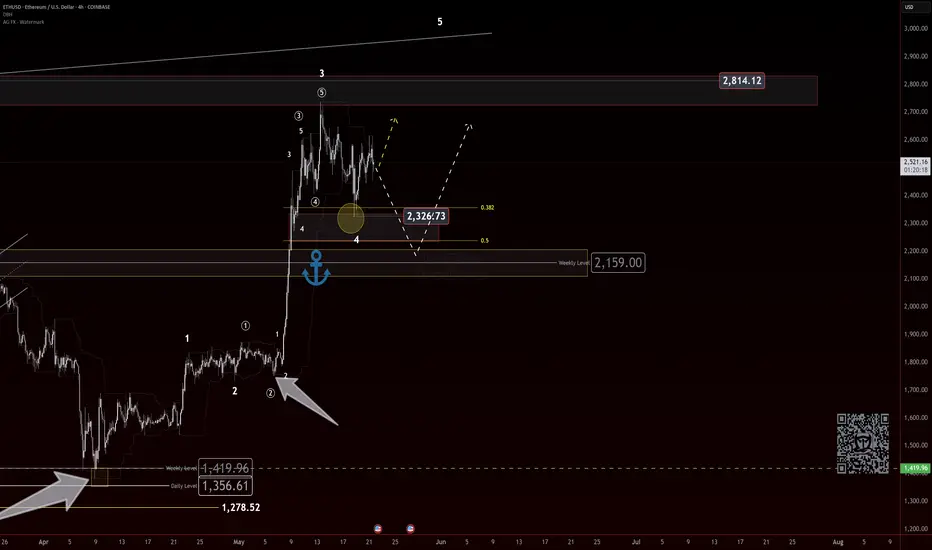
After catching the directional turn and key pivot level ahead of the recent move, Ethereum delivered the reaction we were anticipating. But what comes next?
The current W2 corrective structure isn’t textbook, so what do we do?
At this stage, we’re anchoring our analysis off the Wave 3 price action, which likely completed before the latest correction. That sets us up to track a potential Wave 4 development.
Here’s what’s still on the table:
We have a sideways style W2
For a wave 4, based off of alternation, we should be looking for a:
A sharp zigzag
Or a contracting triangle coiling up for the next breakout
Key Level to Watch:
👉 A clean break below 2159 would invalidate the more bullish interpretations and open the door to deeper corrective action. ⚠️
Until then, staying patient and letting the structure develop will be key.
Trade safe, trade smart, trade clarity.
Technical Levels Respected – BTC Reaches $108K Target what next?📍 BTC Target Hit with Precision!
✅ As predicted in the previous analysis, Bitcoin has successfully tapped the $108K resistance zone — clean and technical execution!
📊 My chart spoke in advance... and the market listened.
🎯 Why miss out on these accurate forecasts?
📉 My strategies are not just random lines — they’re built on solid market structure, EMAs, and key price action zones.
📢 Let’s stay connected!
🧠 I’m committed to sharing educational content and professional trading insights to help you grow as a trader.
💡 Whether you're a beginner or seasoned trader, there’s always something new to learn with me.
📚 Join the journey — learn, trade, and win!
📩 DM or follow to get consistent updates and chart breakdowns.
🚀 Let’s trade smart, not hard!

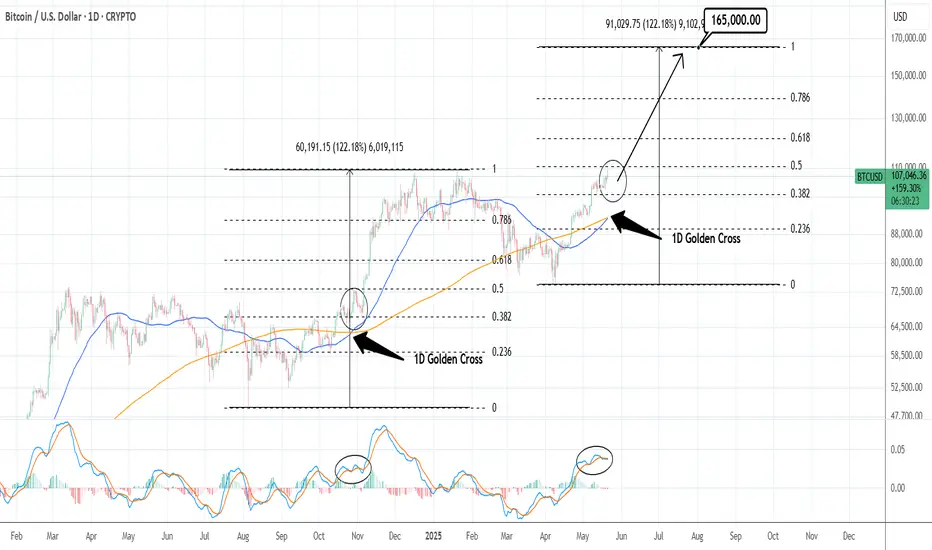
BTCUSD: Made new ATH on Genius Bill vote. 1D Golden Cross formedBitcoin just made new ATH today pas 109,500 as the U.S. Senate officially advanced the GENIUS BILL for consideration. This has turned the 1D technical outlook overbought (RSI = 75.442, MACD = 4135.600, ADX = 30.728) but as mentioned before, Bitcoin tends to thrive on such a state. On top of the very bullish fundamental news, the market just formed a 1D Golden Cross the first since the U.S. elections one (October 27th 2024). That signaled the extension of the bullish trend to +122.18%. If we apply that on the current bullish wave along with the Fibonacci retracement level, we can see that the price is insde the 0.382 - 0.5 Fib range, exactly where it was on the 2024 Golden Cross. If this plays out exactly this way, expect $165k by late July.
## If you like our free content follow our profile to get more daily ideas. ##
## Comments and likes are greatly appreciated. ##
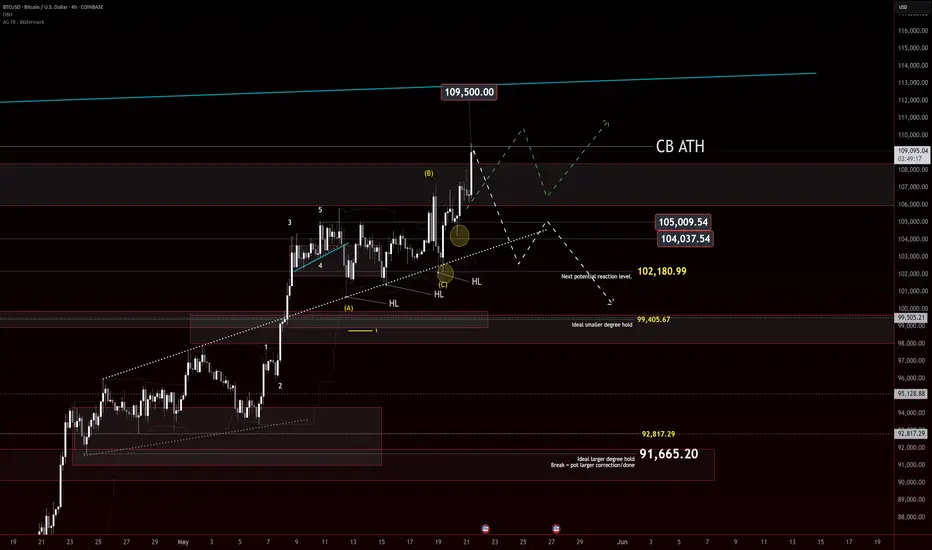
At ATH, blast continuation or tap and turn?If you find this information inspiring/helpful, please consider a boost and follow! Any questions or comments, please leave a comment!
🚀 Tap & Turn… or Blast?
Bitcoin is reacting well to mapped levels, maintaining structure and respecting key zones. Price action continues to print HLs and HH keeping the bulls confident, atm.
💥 Levels Still Respecting
Recent price action has shown solid reactions at prior resistance and support zones. Nothing overly aggressive, but clean enough to keep structure traders engaged.
🐂 Bulls Still in Control (for Now)
Higher lows remain intact, keeping the bullish structure alive. I did take a lower-degree short, but without a clean break of those HLs, there's no reason to call a shift yet. A break of that pattern would be the first real sign of momentum fading.
🚧 Key Watch Zone: 106K–104K
This is where things get more critical. A clean break below that zone could tilt the balance.
Trade safe, trade smart, trade clarity.
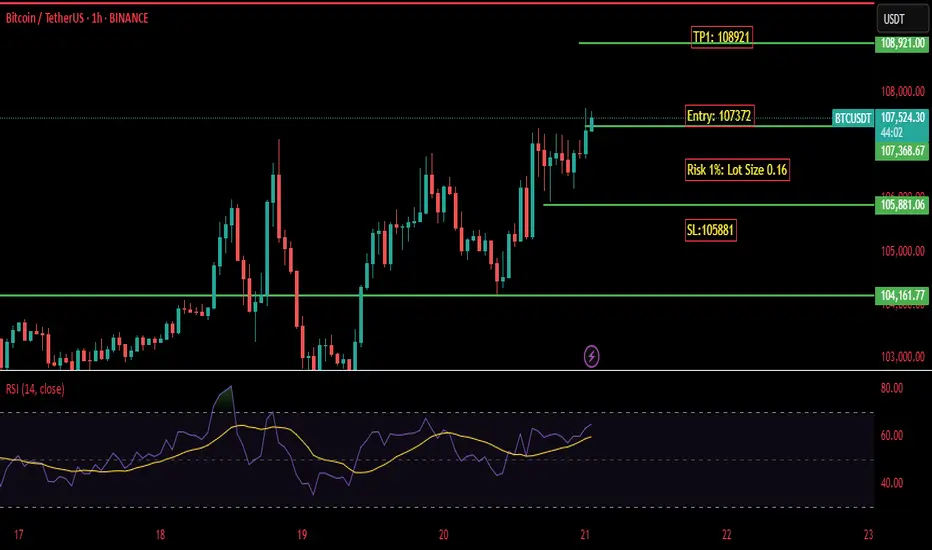
BTCUSD Buy CallBuy BTC on current price it can retest it all time high,
Risk reward is also mentioned act accordingly.
ETHUSD: Consolidation before the Megaphone targets 4,100Ethereum is on a strong bullish 1D technical outlook (RSI = 63.675, MACD = 190.470, ADX = 31.885) despite the current technical pullback which is happening due to the rejection on the 1D MA200. Once crossed, we expect a test of the Megaphone's top (TP = 4,100).
## If you like our free content follow our profile to get more daily ideas. ##
## Comments and likes are greatly appreciated. ##

BTCUSD: Going for the decisive breakout that opens path to 155,0Bitcoin is almost overbought on its 1D technical outlook (RSI = 69.391, MACD = 3884.400, ADX = 20.801), which during rallies is the starting condition that fuels bullish breakouts and continuations. Such a breakout is about to take place right now as the price is on the LH trendline coming from the ATH. As this chart shows, once Bitcoin breaks over a LH trendline on this Cycle, it has always delivered (much) more upside. Assuming we are currently on the 0.5 Fibonacci level of that breakout, the pattern gives a TP = 155,000.
## If you like our free content follow our profile to get more daily ideas. ##
## Comments and likes are greatly appreciated. ##

Bitcoin - All time highs will come next!Bitcoin - CRYPTO:BTCUSD - prepares a significant move:
(click chart above to see the in depth analysis👆🏻)
Over the past couple of months, we basically only saw sideways price action on Bitcoin. However, this does not mean, that Bitcoin is now slowing down; actually the opposite is true and Bitcoin is setting up for a major move higher. New all time highs will come very soon.
Levels to watch: $100.000
Keep your long term vision!
Philip (BasicTrading)

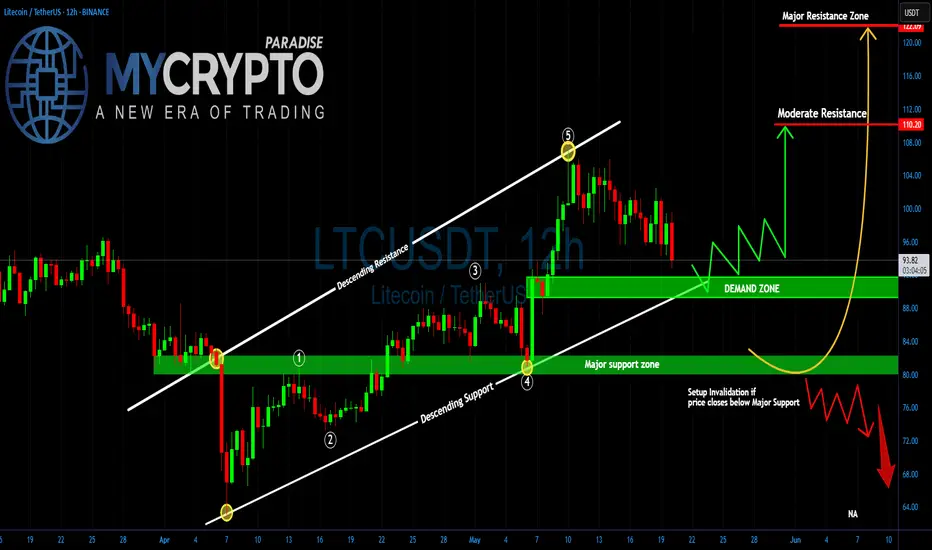
LTC will this Demand Zone Trigger a Reversal or a Full Crash?Yello,Paradisers! Is this the calm before a major bounce, or the final warning before Litecoin breaks down completely? This current zone is absolutely critical ignore it, and you risk missing the next big move.
💎#LTCUSDT has completed a strong 5-wave impulsive move within an ascending channel. The recent correction has now brought the price back down into a very important demand zone near $90. This level isn’t just a random number it’s sitting right on top of a previous major support zone that held back in early April, just before the entire leg up began.
💎Price is now also testing the lower boundary of the ascending channel. As long as #Litecoin holds this demand zone between $90 and $93, the bullish structure remains intact. This could be the perfect reload zone for bigger players preparing for the next leg up. If the price begins to form higher lows from here and reclaims the $96–98 region with strength, it could open the path toward the moderate resistance at $110. And if that level breaks with momentum, we’re likely looking at a full extension into the major resistance above $115.
💎However, if #LTC closes a candle below major support at $80 with volume and structure confirming the breakdown, the setup will be invalidated. In that case, we’re potentially heading for a much deeper flush into the $72–75 range, which aligns with the next HTF liquidity pool and potential weekly support.
Stay sharp, Paradisers. The market will soon decide and if you're ready, you'll be on the right side of the move.
MyCryptoParadise
iFeel the success🌴
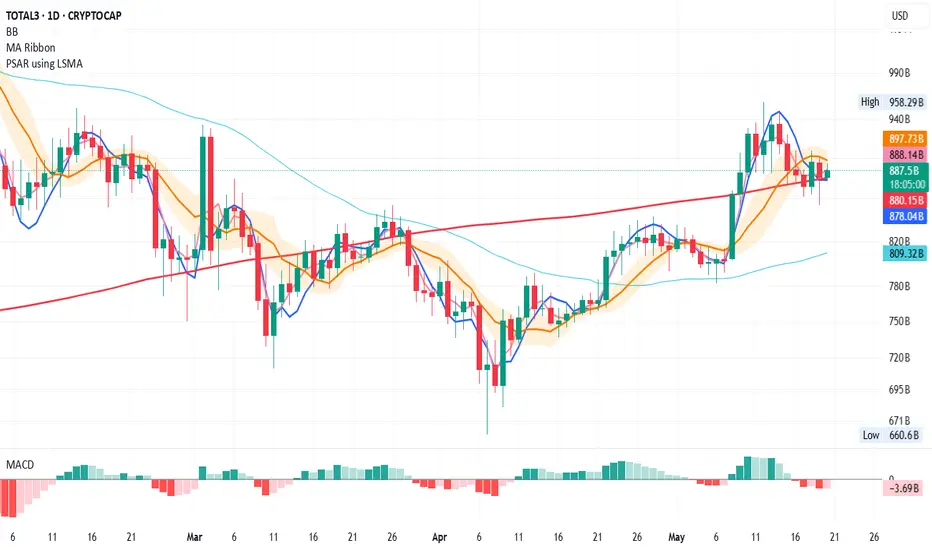
TOTAL3 Update: Potential Recovery on the Daily ChartLooking at TOTAL3 on the daily:
Yesterday, we saw a wick below the 200MA, but the price managed to close above it by the end of the day—a good sign for recovery. 🔄
Although the MLR < SMA < BB Center isn't ideal, we continue to monitor price action in relation to the 200MA. If we close above it again today, things might start to turn positive. 🌱
⚠️ Keep an eye on macro news and hope for no more downgrades from agencies like Moody’s.
Thanks for reading! Stay safe and manage your risk. 📊
BITCOIN Daily Bullish / Bearish days ahaed with Big push after
Even though I have mentioned that we maybe in for some RED days this week, this chart shows how, ultimately, we are in a Bullish momentum still.
The CUP pattern that we have printed ( adjusted since I last posted this) , Goes from ATH line back to the ATH line.
We also see how there is this APEX that PA has fallen into that has its peak at the end of this month.
PA always reacts before the APEX
But before this, we may range across or drop down onto the CUP. This has Strong support and could possibly propel PA above thaT ATH line.
We do need to also understand, there is a 618 Fib circle at this intersection and that may not be easy to break through.
But PA has often searched out intersections of resistance to break through and so I am looking to this as the way forward.
The 2.618 Fib Ext on this chart may also offer support at around 98K if we loose support higher.
The RSI is already dropping from OverBought and so will probably continue to do so till we reach Neutral / Over Sold again.
And the Daily MACD, is also turning Bearish, But as mentioned before, this is possibly repeating what happened in Nv 2024
See the Arrow on the left...The Histogram is the one to take note of. Two Green peaks and then a red Dip
We have just begun the Red bit after the two Green peaks.
The scale is larger here and so we may have to wait longer till we return out of the green.
In 10 dayts, we will be near end of month
So, for me, this week will be possibly Red but towards the end of the month, things will begin to move higher.
All depends on PA following expected patterns and that does not always happen
We can only look, plan and react.

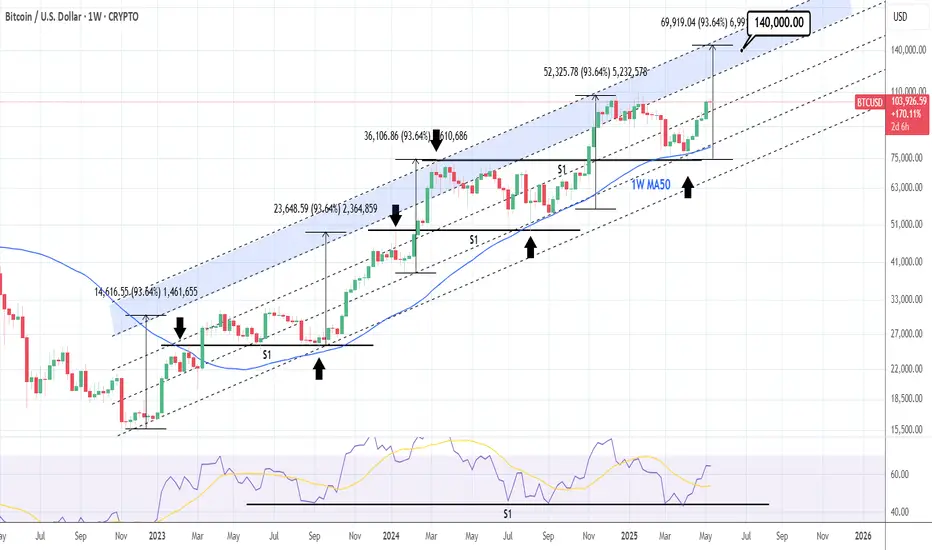
BTCUSD: is far away from its Sell Zone.Bitcoin remains overbought on its 1D technical outlook (RSI = 70.017, MACD = 4154.600, ADX = 16.535) but still in the middle of the Cycle's Channel Up. After a 1W MA50 rebound (April 7th) on the bottom quarter, it is aiming for the blue Sell Zone of the top quarter of the Channel Up where the last two tops were priced. A +93.64% rise has been the most common inside this pattern. Based on that the minimum TP for this run is 140,000.
## If you like our free content follow our profile to get more daily ideas. ##
## Comments and likes are greatly appreciated. ##
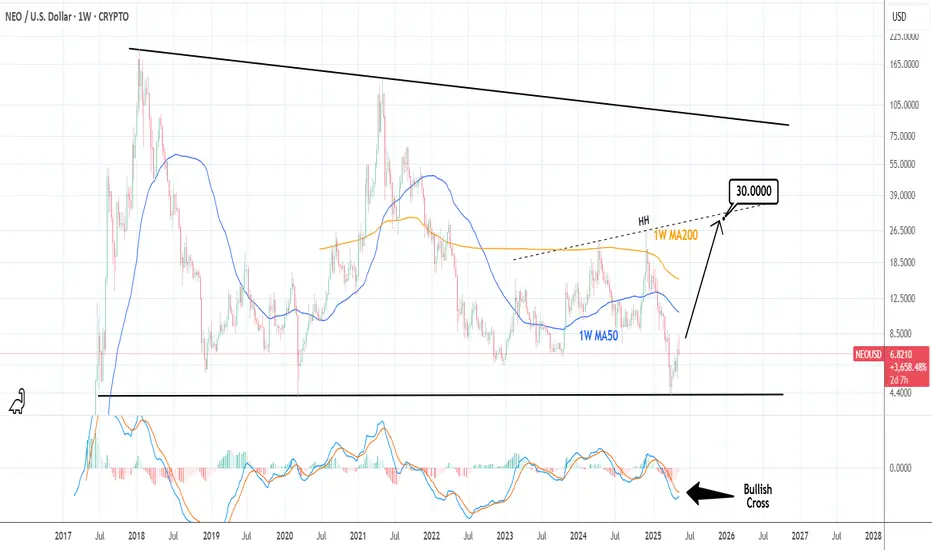
NEOUSD: Minimum target for the end of this Cycle $30.Neo turned marginally bullish on its 1D technical outlook (RSI = 56.743, MACD = 0.356, ADX = 25.407) as it has validated the start of the new bullish wave, rebounding on the same level as it did on March 9th 2020. This is the least aggressive Bull Cycle for new but the presence of a HH trendline implies that a Cycle high can be minimum made on it. With the 1W MACD about to form a Bullish Cross, we expect the HH to get hit by the end of the year (TP = 30.000).
## If you like our free content follow our profile to get more daily ideas. ##
## Comments and likes are greatly appreciated. ##