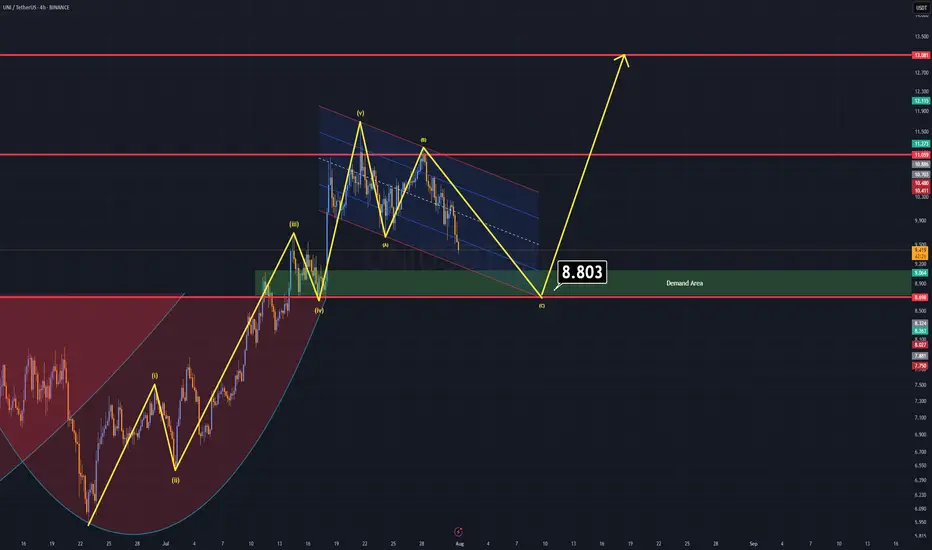
UNI Analysis (4H)UNI – Correction Might Bring Opportunity
Currently, UNI is forming an A–B–C corrective pattern, and based on technical structure, this correction may complete around the $8.8 level.
Key Zone to Watch: $9.0 – $8.5
There's a strong demand zone just below $9, supported by historical price action.
On the daily time frame, a broken cup & handle formation aligns perfectly with this area — the old neckline may now act as support, increasing the confluence.
This overlap of structure and demand makes the $9–$8.5 zone a favorable entry for a long position.
Once price reaches this area, expect a significant upward correction as part of the next move in the cycle.
Good Luck.
Cup And Handle
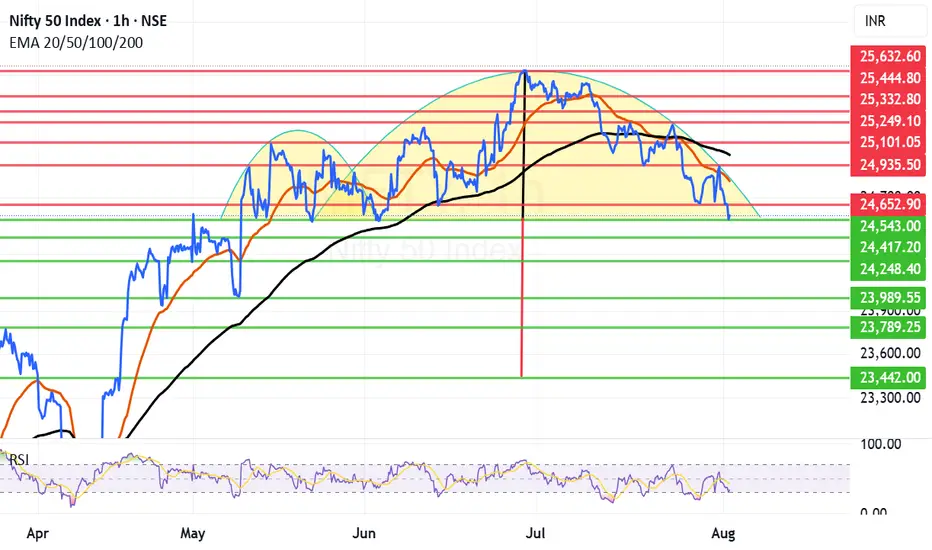
Reverse cup and Handle kind of structure formed in NiftyIn the short term time frame Nifty is seen to be forming reverse cup and handle kind of structure this is considered very bearish structure. However for this bear fest to manifest Nifty needs to close below 24543 or 24417. These 2 levels can save Nifty if not we will see it going into the bear grip.
Thus the most important supports for Nifty remain at 24543 and 24417. Below this level the supports for Nifty will be at 24248, 23989, 23789 and finally major support are is near 23442.
Important resistance areas for Nifty remain at 24652, 24821 (Mother Line Resistance), 24935, 25011 (Father Line Resistance), 25101 and finally 25249. Above 25249 Bulls can become very active.
Till the trade deal chess board and Tariffs do not relent or there is some other very important positive news Nifty will remain under pressure. Let us hope that 24253 or 24417 save us. Long term outlook on Nifty still remains positive. Long term investors should look at the tariff related event as a news that will slowly subside and give way to the Bullish outlook which has been prevailing in the market for decades all together.
Disclaimer: The above information is provided for educational purpose, analysis and paper trading only. Please don't treat this as a buy or sell recommendation for the stock or index. The Techno-Funda analysis is based on data that is more than 3 months old. Supports and Resistances are determined by historic past peaks and Valley in the chart. Many other indicators and patterns like EMA, RSI, MACD, Volumes, Fibonacci, parallel channel etc. use historic data which is 3 months or older cyclical points. There is no guarantee they will work in future as markets are highly volatile and swings in prices are also due to macro and micro factors based on actions taken by the company as well as region and global events. Equity investment is subject to risks. I or my clients or family members might have positions in the stocks that we mention in our educational posts. We will not be responsible for any Profit or loss that may occur due to any financial decision taken based on any data provided in this message. Do consult your investment advisor before taking any financial decisions. Stop losses should be an important part of any investment in equity.
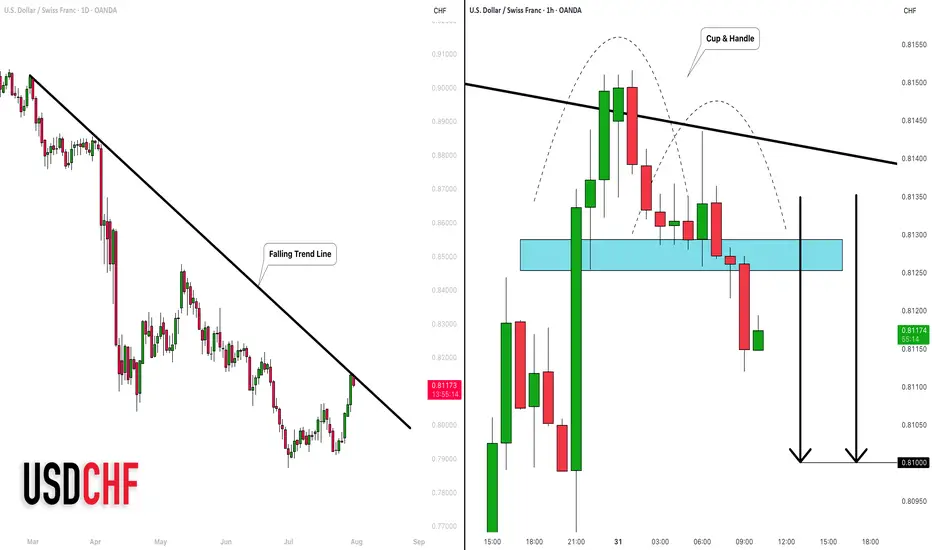
USDCHF: Correction Ahead! 🇺🇸🇨🇭
I think that USDCHF is going to retrace after a test
of a major falling trend line on a daily.
As a confirmation, I found an inverted cup & handle pattern
on an hourly time frame.
Closest support - 0.81
❤️Please, support my work with like, thank you!❤️
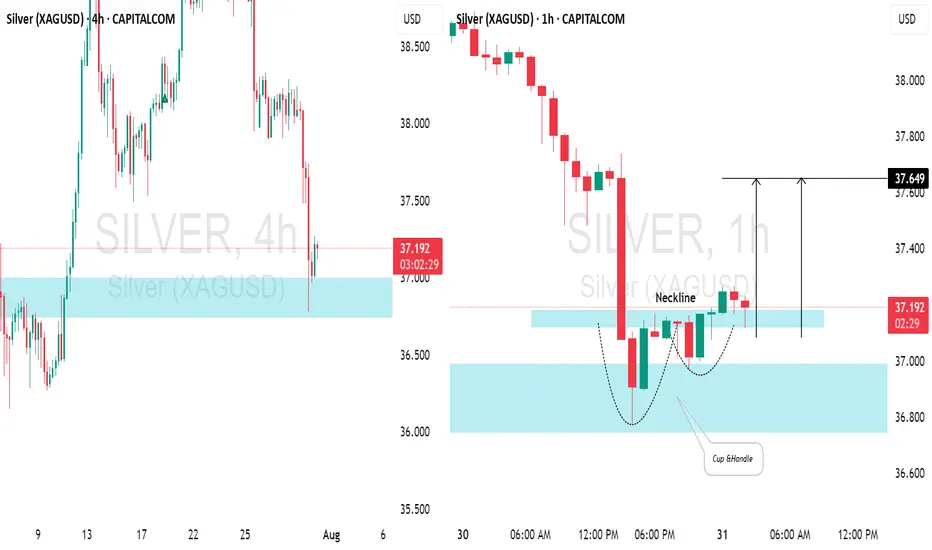
SILVER (XAGUSD): Time for Pullback📈SILVER appears to be oversold following yesterday's decline.
After testing a significant daily / intraday support level, there's a noticeable bullish reversal.
The price formed a cup & handle pattern on the hourly chart and has broken above its neckline. We can expect a pullback to at least 37.64.
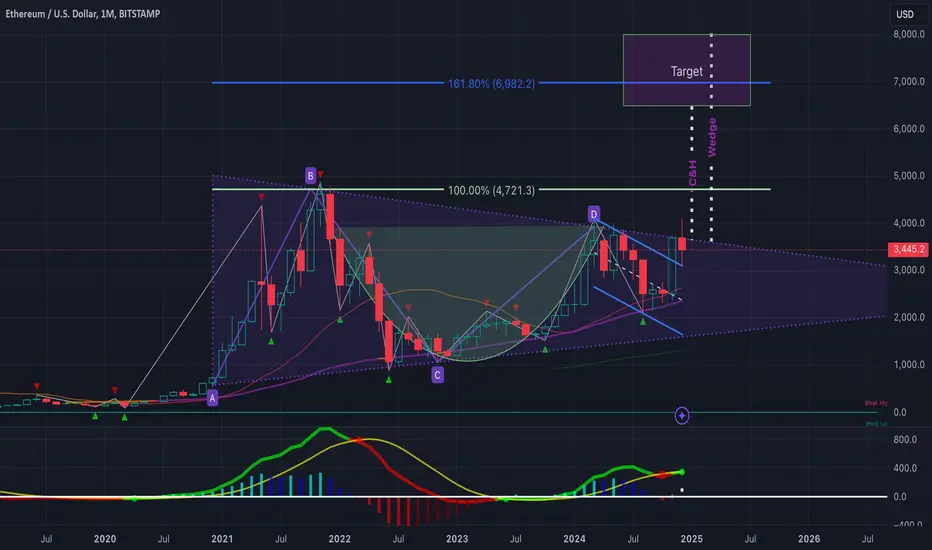
$ETH to $6.45k USD - 2024's Crescendo CRYPTOCAP:ETH is showing strong signs of an impending breakout to the $6.4k–$8k range, backed by two key technical indicators:
Cup & Handle Formation: ETH has recently broken out of a textbook cup and handle pattern, confirming the breakout with a solid retest over this past week of VOL. This is a classic bullish signal pointing to higher targets.
Bull Pennant: Since the 2021 rally, ETH has been consolidating within a massive bull pennant. This long-term structure suggests Ethereum is coiled and ready for a significant move upward.
1.618 Fib: Also layering in a Fibonacci retrace, if ETH is indeed heading for ATHs and price discovery, the 1.618 FIB is a common level that traders are very familiar with. It just so happens to be right in the middle of our target box at ~$7k!
Momentum is building— we will need to keep an eye on volume and follow-through for confirmation.
To boot, bearish sentiment for ETH is near all time highs. I think it might be time for a most-hated rally. I have a short term allocation in AMEX:ETHT to ride this momentum, NFA DYOR
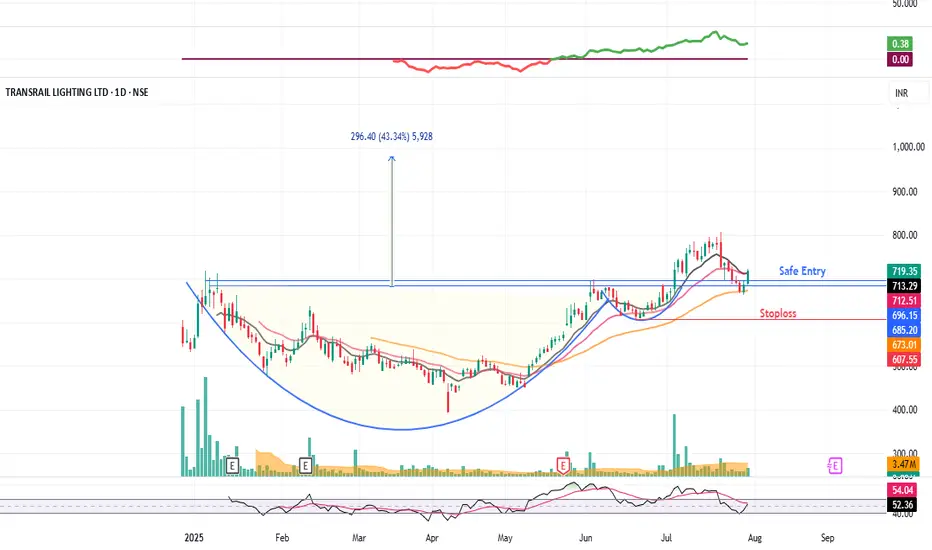
TRANSRAILL : Swing Trading (1-3 Months)#TRANSRAILL #patterntrading #cupandhandlepattern #breakoutstock #chartpatterntrading #IPOstock
TRANSRAILL : Swing Trading
>> Cup & Handle pattern
>> Breakout + Retest done
>> Trending stock Setup
>> Good Strength & Volumes picking up
Swing Traders can lock profit at 10% and keep trailing
Pls Boost, comment & Follow for more Analysis
Disc : Charts Shared are for Learning Purpose & not a Trade recommendation. Pls consult a SEBI Registered Advisor before taking position in it
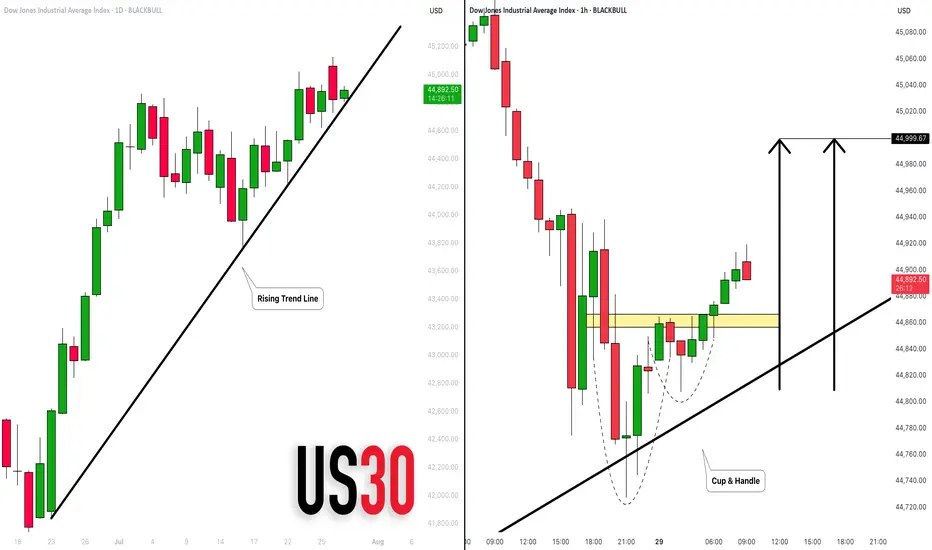
DOW JONES INDEX (US30): Bullish Move From Trend Line
There is a high probability that US30 will continue rising today,
following a test of a solid rising trend line on a daily.
As a confirmation, I see a cup & handle on that after its test
on an hourly time frame.
Goal - 45000
❤️Please, support my work with like, thank you!❤️
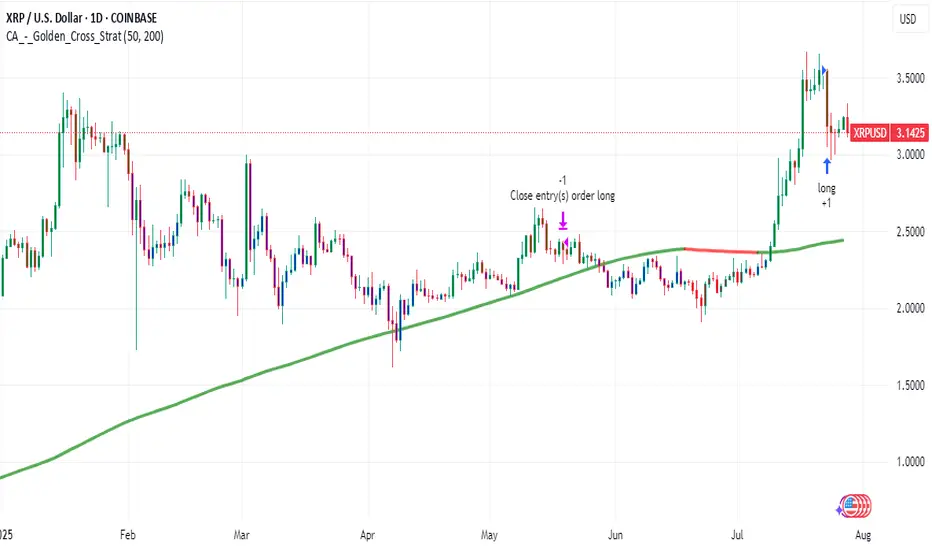
Bullish Signals Mount for XRP as Price Holds Weekend GainsXRP at a Crossroads: Technical Strength Meets Fundamental Catalysts in a High-Stakes Market
July 28, 2025 – In the volatile and ever-evolving world of digital assets, few tokens command as much attention, debate, and fervent community support as XRP. The digital asset, intrinsically linked with the fintech company Ripple, is currently navigating a period of intense market focus. After a period of consolidation, XRP is demonstrating renewed strength, holding onto recent gains and pressing against critical technical resistance levels. This price action is not occurring in a vacuum; it is the culmination of powerful undercurrents, including bullish chart patterns, significant accumulation by large holders, and a shifting landscape of regulatory clarity and institutional interest that could define its trajectory for years to come.
As of Monday morning, XRP has shown stability, trading around the $3.16 to $3.24 range. This follows a period where the token has been building momentum, with analysts closely watching key resistance zones between $3.30 and $3.40. A decisive break above these levels could signal the start of a new upward trend, while the ability to hold support, particularly around $3.15 to $3.20, is seen as crucial for maintaining the current bullish structure. This delicate balance has traders and long-term investors alike on high alert, as a confluence of technical indicators and fundamental developments suggests that XRP may be poised for its next significant move.
________________________________________
Chapter 1: Decoding the Charts: Bullish Patterns Emerge
For technical analysts, the recent XRP charts are a compelling study in bullish potential. Several classic patterns and indicators have emerged, suggesting that the path of least resistance may be upwards. These signals, watched closely by traders globally, are fueling a narrative of an imminent breakout.
One of the most discussed formations is the "Cup and Handle" pattern. This is a bullish continuation pattern that resembles a teacup on a chart. The "cup" is a U-shaped or rounded bottom that forms after a price run-up, indicating a period of consolidation and accumulation. This is followed by the "handle," a shorter and shallower downward drift in price, representing a final shakeout before a potential major upward move. Analysts have identified a large cup formation developing on XRP's long-term charts, with some pointing to a breakout zone around $3.64. A confirmed move above the handle's resistance could, according to technical theory, trigger an explosive rally, with some analysts projecting targets as high as $5.18, $7, or even a staggering $30 based on the pattern's depth.
Adding to this bullish thesis is the appearance of a "Golden Cross." This occurs when a shorter-term moving average (like the 50-day) crosses above a longer-term moving average (like the 200-day) on a price chart. It is widely regarded as a signal of a potential long-term uptrend. A golden cross was recently confirmed on XRP's daily chart around July 23, 2025, an event that historically has preceded significant price runs. The last major golden cross in late 2024 was followed by a rally of over 460% in two months. While past performance is not indicative of future results, the reappearance of such a powerful signal has undoubtedly bolstered investor confidence.
Furthermore, a rare golden cross has also been observed on the XRP/BTC trading pair, where XRP's price is measured against Bitcoin. This specific event, where the 23-day moving average crossed the 200-day, previously preceded a 158% surge in the pair's value in just two weeks. The near-identical structure of the current pattern has led analysts to suggest that XRP may be poised to outperform Bitcoin in the near term, especially as Bitcoin's price has been consolidating, shifting investor focus toward promising altcoins.
These technical signals—from the broad Cup and Handle to the precise Golden Cross—are painting a picture of a market coiling for a significant move. They suggest that underlying buying pressure is quietly building, setting the stage for a potential breakout if the market's fundamental drivers align.
________________________________________
Chapter 2: The Whale Effect: Following the Smart Money
Beyond the lines on a chart, the actions of the market's largest players—colloquially known as "whales"—provide another critical layer of insight. These are individuals or entities holding vast amounts of a cryptocurrency, and their trading activity can significantly influence market trends and sentiment. Recently, on-chain data has revealed a clear and compelling trend: XRP whales are accumulating.
In a remarkable show of force, wallets holding between 10 million and 100 million XRP have been steadily increasing their holdings, adding over 130 million XRP in a single day recently. These large-scale investors now control approximately 14% of the circulating supply, a historic high for this cohort. This accumulation is significant because it suggests that sophisticated, well-capitalized market participants are confident in XRP's future prospects and are positioning themselves for a potential price increase.
Simultaneously, the flow of XRP from whale wallets to exchanges has plummeted by over 93% since early July. This is a crucial indicator, as large transfers to exchanges often signal an intention to sell. The sharp decline suggests that whales are not only buying more XRP but are also holding onto their existing assets, reducing the available supply on the market and removing significant sell-side pressure. This behavior, often described as a "supply shock," can create a powerful tailwind for the price if demand continues to rise.
This intense accumulation has not gone unnoticed. In one instance, two identical transactions moved a combined 306.4 million XRP, worth nearly $1 billion, from an exchange to a private wallet within 60 seconds. Such large, coordinated movements are often interpreted as strategic positioning ahead of anticipated positive news or a market-wide rally. This activity, combined with reports of over 2,700 wallets now holding at least 1 million XRP each, paints a picture of broad-based accumulation among the asset's most significant backers. This "smart money" activity often provides a psychological boost to retail investors, reinforcing the belief that a major move could be on the horizon.
________________________________________
Chapter 3: The Fundamental Pillars: Regulation, ETFs, and Utility
While technicals and whale movements drive short-to-medium-term sentiment, the long-term value of any digital asset rests on its fundamental pillars. For XRP, these pillars are its evolving regulatory status, the tantalizing prospect of a spot Exchange-Traded Fund (ETF), and its core utility within Ripple's global payments network.
Regulatory Clarity on the Horizon:
The most significant overhang on XRP for years has been the lawsuit filed by the U.S. Securities and Exchange Commission (SEC) in December 2020, which alleged that Ripple conducted an unregistered securities offering. This legal battle has been a focal point for the entire crypto industry. However, recent developments have shifted sentiment dramatically. Key court rulings, including a partial victory for Ripple where a judge determined that some of its XRP sales did not qualify as securities, have bolstered institutional confidence.
Currently, the case is in a delicate phase, with both Ripple and the SEC having paused their respective appeals. While rumors of a final settlement swirl, legal experts caution that the process is subject to the SEC's internal bureaucratic procedures and a formal vote is still required. Nevertheless, the prevailing belief is that the worst of the legal uncertainty is over. A final resolution, which many hope will come before the end of the year, would remove the primary obstacle to XRP's full-scale adoption in the United States and could pave the way for its relisting on major exchanges and inclusion in institutional products.
The Race for a Spot XRP ETF:
Following the landmark approvals of spot Bitcoin and Ethereum ETFs, the crypto market is buzzing with anticipation for what comes next. XRP is widely considered a prime candidate for its own spot ETF. Asset management giants like Grayscale, Bitwise, Franklin Templeton, and WisdomTree have already filed applications with the SEC.
The approval of a spot XRP ETF would be a watershed moment, providing a regulated, accessible, and insured investment vehicle for both retail and institutional investors in the U.S. to gain exposure to XRP. The launch of XRP futures-based ETFs has been seen as a positive precursor, following the same playbook that led to the spot Bitcoin ETF approvals. Market analysts and prediction markets have placed the odds of a spot XRP ETF approval in 2025 as high as 92-95%, contingent on a favorable resolution of the SEC lawsuit. Such an approval could unlock billions of dollars in institutional inflows, dramatically increasing demand and market legitimacy for the asset.
Core Utility in Global Payments:
At its heart, XRP was designed for utility. It serves as the native digital asset on the XRP Ledger, a decentralized blockchain engineered for speed and efficiency. Its primary use case is powering Ripple's payment solutions, which are now part of the broader Ripple Payments suite.
Ripple's network is designed to challenge the legacy correspondent banking system, exemplified by SWIFT, which can be slow and costly for cross-border payments. By using XRP as a bridge currency, financial institutions can settle international transactions in seconds for a fraction of a cent, without needing to pre-fund accounts in foreign currencies. This utility is not merely theoretical. Ripple has forged partnerships with over 300 financial institutions across more than 45 countries, with a significant portion utilizing XRP for liquidity. In 2024 alone, over $15 billion was transacted via Ripple's liquidity solutions, and the XRP Ledger is now processing over 2 million transactions daily. This growing, real-world adoption provides a fundamental demand for XRP that is independent of market speculation and forms the bedrock of its long-term value proposition.
________________________________________
Chapter 4: The Retirement Dream: Audacious Predictions and Future Outlook
The convergence of bullish technicals, strong fundamentals, and growing market optimism has led to a wave of bold price predictions from analysts. While highly speculative, these forecasts illustrate the immense potential that many see in XRP, fueling a narrative that significant holdings could lead to life-changing wealth.
Price targets for the current cycle vary widely, reflecting different models and timelines. Short-term targets frequently center around the $4 to $7 range, with some analysts suggesting a move to $9 or $15 is possible if momentum continues. One analyst, citing a rare bullish chart pattern, sees a potential 60% rally to around $4.47.
Looking further out, the predictions become even more audacious. Projections based on historical cycles and technical models, such as Elliott Wave theory, have put forth long-term targets of $16, $24, and even $27. Some AI-driven prediction models forecast that XRP could reach the $10-$20 range by the end of 2025, especially if an ETF is approved. Longer-term forecasts extending to 2030 suggest prices could potentially climb to between $19 and $48, depending on the level of global adoption.
These predictions have given rise to the "retire on XRP" dream among its community. For instance, if XRP were to reach one analyst firm's high-end forecast for 2030 of $32.60, an investment of 10,000 XRP could be worth over $326,000. While tantalizing, it is imperative for investors to approach such forecasts with extreme caution. The cryptocurrency market is notoriously volatile, and such high-reward potential is invariably accompanied by high risk. Regulatory setbacks, macroeconomic downturns, or a failure to achieve widespread adoption could all significantly impact XRP's future price.
Conclusion: A Confluence of Forces
XRP currently stands at one of the most fascinating junctures in its history. The digital asset is being propelled by a powerful confluence of forces: bullish technical patterns are signaling a potential breakout, on-chain data shows undeniable accumulation by its largest holders, and its fundamental value proposition is being strengthened by increasing regulatory clarity, the imminent possibility of a spot ETF, and steadily growing real-world utility.
The journey ahead is fraught with both immense opportunity and significant risk. A decisive break above its current resistance could unleash the momentum that analysts and investors have been anticipating for months. However, the market remains sensitive to legal news and broader macroeconomic trends. For now, XRP remains a bellwether asset, its story a microcosm of the broader struggle and promise of the digital asset industry—a high-stakes battle for legitimacy, adoption, and a permanent place in the future of finance
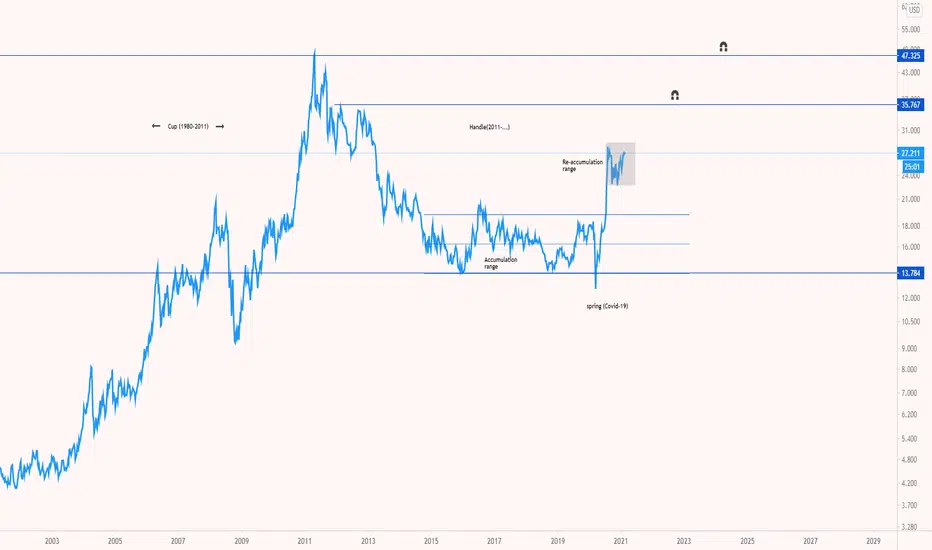
The biggest cup&handle of all times: silver targets $50The data suggests a cup&handle:
Cup was between 1980-2011
Handle is still in progress and probably may finish by 2025 or earlier.
For the short run: a re-test of low re-accumulation range of $23 can be seen.
The next mid-term target will be $25.
Final target will be $50.
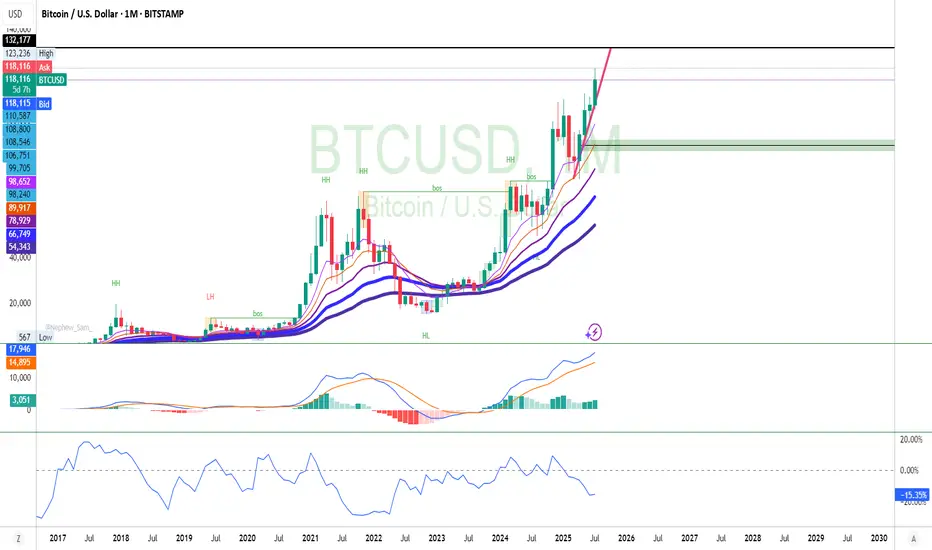
Bitcoin going up because of Cup and Handle!Bitcoin will continue to go up to finish it's measured move from the cup and handle chart pattern playing out. Looks like the text book image of a cup and handle. Lol. Perfection!
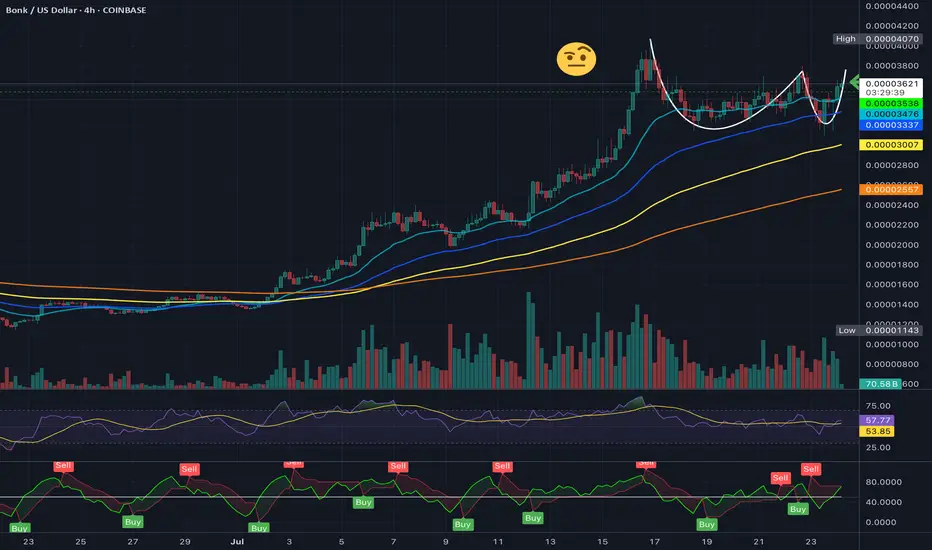
Its an ugly Cup & Handle, But one Nonetheless....$BONKThis isn't the prettiest formation of a Cup & Handle but playing out as one currently. A Pick up in volume should send this shit. LFG!
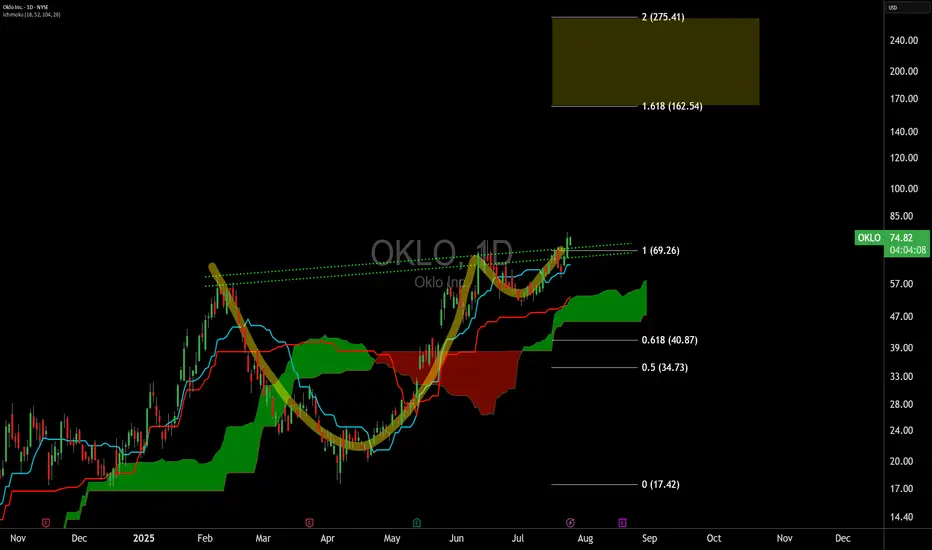
OKLO C&HC&H chart pattern in a hot sector seeing support by the US Government. The intersection of energy, uranium, nuclear, utilities, data centers, the grid, AI, etc.
SL = LL at 58
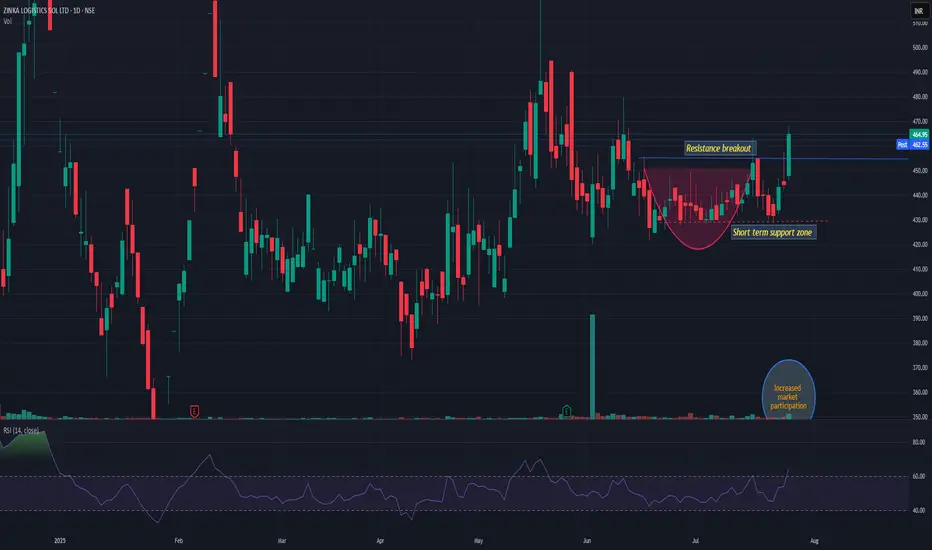
BLACKBUCKBLACKBUCK showing strength and crossed previous resistance zone with decent volume. Support is near 425-8 levels. Resistance is near 510 and above that it may enter into uncharted zone. Keep it on radar.
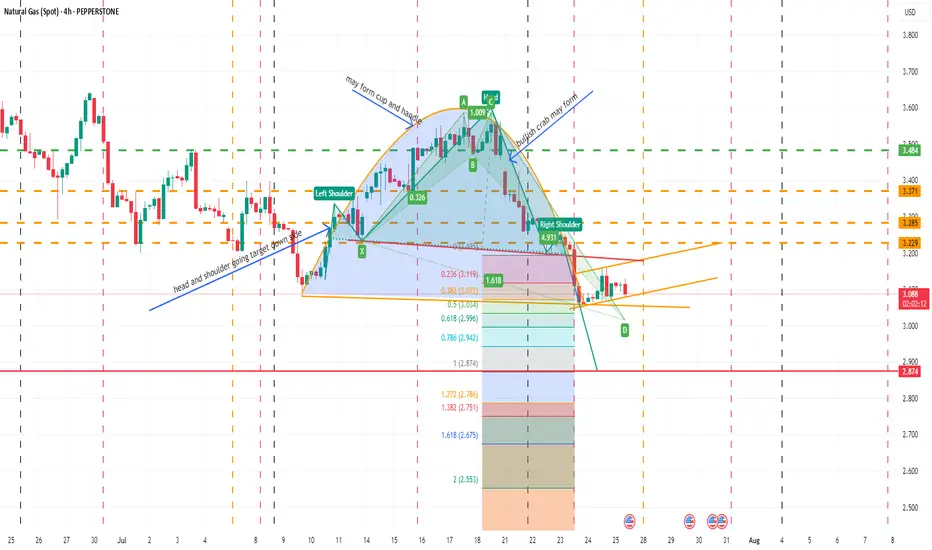
NATURAL GAS SPOTMay form inverse cup and handle, bullish crab also about to form , after completing one head and shoulder pattern already posted earlier new head and shoulder going on. In daily and 4 hr chart below ichimoku cloud. In weekly within cloud. Moving averages showing weakness in daily and weekly, monthly candle also no bearish. May be in such scenario bullish crab pattern may fail but need to be careful as over sold territory. Let see how all works in future though so far all as per analysis. I am not SEBI registered analyst.
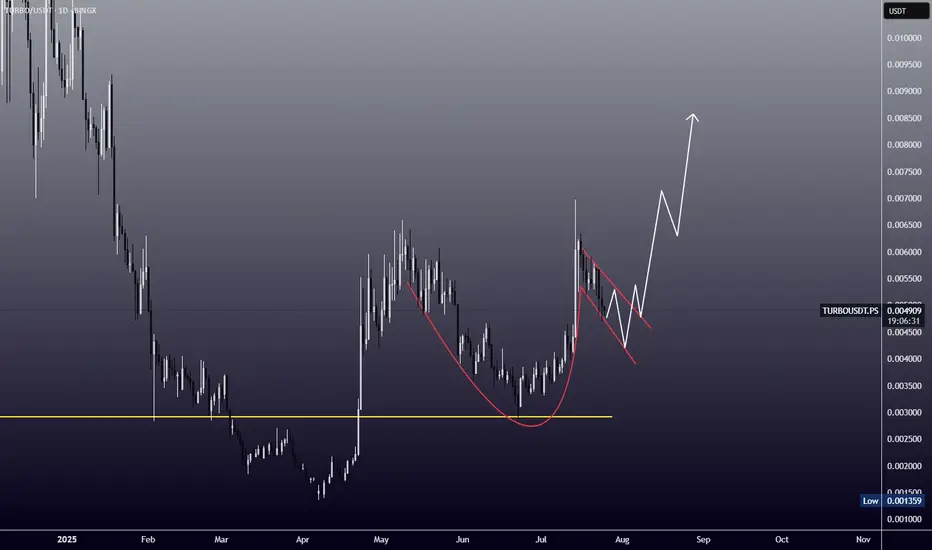
Cup and handle on TOSHIEvery time I look at the TURBO chart I can't help but see this cup and handle formation.
Bullish Cup and Handle setup for Arafura Rare EarthsARU is setting up beautifully with a classic cup and handle formation on the daily chart. This is a well-defined bullish continuation pattern with strong convergence across technical indicators, price action, and volume structure.
Key pattern breakdown :
- Rounded cup base formed over April–June.
- Price rallied into resistance (~0.22-0.23c AUD), forming the right side of the cup.
- Currently in a healthy pullback phase, building the handle.
Watching for support at 0.195–0.200 to hold, which aligns with:
38.2–50% Fibonacci retracement
Mid-Bollinger Band
High-volume node on the visible range volume profile
RSI remains in a bullish uptrend, now cooling off and testing trendline support.

RZLV formed round bottomBusiness Model: AI SaaS for retail—mobile-first, gen‑AI conversational commerce and checkout.
Financials: Very low revenue base, heavily loss-making, but building enterprise footprint and usage.
Balance Sheet: Strengthened via equity conversions, debt facility, and capital raises; dilution risk remains.
Traction: Growing client deployments across major brands; usage and GMV accelerating in 2025.
Leadership: Experienced team, led by a founder-CEO and a seasoned global CTO/product head drawn from tech‑commerce backgrounds.
Despite minimal current revenue, Rezolve AI is betting on rapid scaling through partnerships with Microsoft, Google, and enterprise clients. Execution and monetization in 2025 will be pivotal to its valuation trajectory.

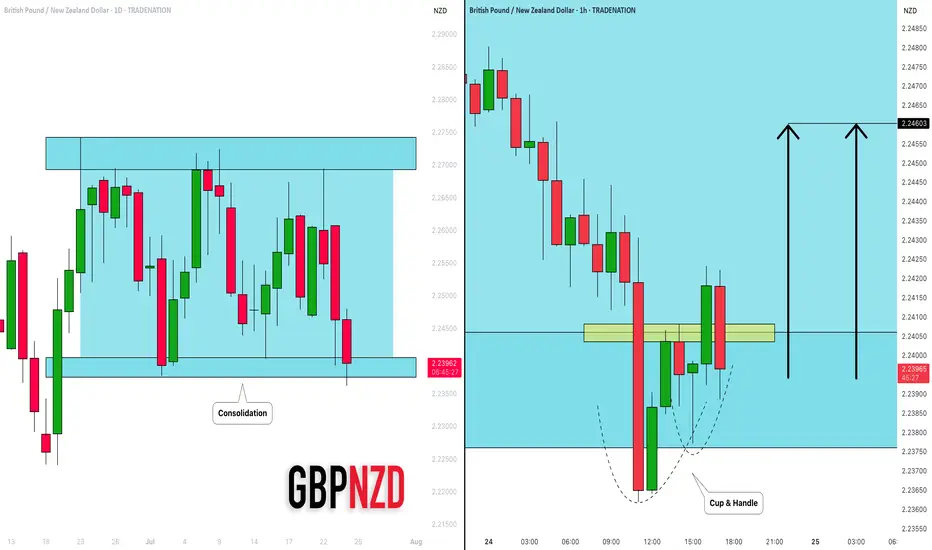
GBPNZD: Bullish Move in a Channel 🇬🇧🇳🇿
I see a horizontal parallel channel on GBPNZD on a daily.
The price is currently testing its support.
On an hourly time frame, a cup & handle pattern was formed on that.
Its neckline was violated with the today's high impact news.
I think that the price may bounce at least to 2.246 level.
❤️Please, support my work with like, thank you!❤️
I am part of Trade Nation's Influencer program and receive a monthly fee for using their TradingView charts in my analysis.
EOY based on yesterday's earnings and the flywheel effect# Alphabet's Accelerating Flywheel: Q2 2025 Earnings Validate the Strategy
technicals grounded in an anchored pitchfork hinged on the pre-covid levels (covid bottom just makes the path too aggressive for EOY) and fib retracements of the 2022 bear market decline. General and simple targets since moving averages aren't providing much clarity. Single stock analysis is even more voodoo than large sector indexes, so I'll focus on fundamentals instead:
## The Flywheel In Action: Q2 2025 Results
Alphabet's blowout Q2 2025 earnings provide concrete evidence that their integrated AI flywheel is already spinning faster. **Revenue grew 14% to $96.4 billion, crushing expectations**, while the company raised its 2025 capital expenditures from $75 billion to **$85 billion**—a bold investment that initially spooked some investors but actually signals the flywheel's acceleration.
### Why the $85 Billion Capex Increase is Strategic Genius
The additional $10 billion isn't just spending—it's **strategic reinvestment in the flywheel's core components**:
**Infrastructure Dominance:** Google Cloud revenue surged 32% to $13.6 billion, now approaching a $50+ billion annual run rate. The capex increase funds the massive data centers and TPU clusters needed to serve exploding AI demand.
**Competitive Validation:** Even OpenAI, Google's biggest AI rival, is now renting Google's TPU chips to power ChatGPT—choosing Google's proprietary hardware over Nvidia GPUs for cost-effective inference. This partnership alone validates the integrated hardware-software advantage.
**Market Leadership:** With AI Overviews reaching 2+ billion users (up from 1.5B last quarter) and Gemini hitting 450+ million users, Google is proving it can deploy AI at unprecedented scale while generating immediate revenue.
## The Core Flywheel System
**The Engine:** World-class AI research (DeepMind, Google AI) creating increasingly capable models that serve as tools for invention, not just products. Gemini's rapid user growth proves the models are competitive.
**The Fuel:** Search and YouTube revenue provides patient capital for long-term moonshots, while diverse data from billions of users continuously improves AI models. Q2's strong advertising performance ($64B+) funds the entire system.
**Custom Hardware Advantage:** Proprietary TPUs optimized for their AI software create faster, more efficient training and inference than competitors using general-purpose chips. OpenAI's adoption proves TPUs offer superior cost-performance.
**The Multiplier:** Quantum computing research that could eventually solve problems impossible for classical computers, creating step-change advantages in materials science and optimization.
## AI Integration Across the Ecosystem: The Ultimate Moat
Alphabet's true competitive advantage lies in **embedding AI across their existing billion-user platforms**, creating compound defensibility:
**Search Dominance:** AI Overviews now appear in 2+ billion monthly searches across 200+ countries, fundamentally changing how users interact with information while maintaining Google's search monopoly. Users increasingly expect AI-powered results, making switching costs even higher.
**Productivity Lock-in:** Gmail's Smart Compose, Google Docs' AI writing assistance, and Sheets' intelligent data analysis create sticky enterprise and consumer habits. Once teams adopt AI-enhanced workflows in Google Workspace, migration becomes exponentially more difficult.
**Developer Ecosystem:** Google's coding tools (Colab, Android Studio) now feature AI pair programming, while languages like Go and Dart benefit from AI-optimized development. This creates a generation of developers trained on Google's AI tools.
**Educational Moat:** Chromebooks in schools now include AI tutoring and personalized learning, creating habits among students who will become tomorrow's decision-makers. Google for Education's AI features make alternative platforms seem primitive.
**Entertainment Integration:** YouTube's AI-powered recommendations, creator tools, and content moderation have become so sophisticated that creators and viewers alike can't imagine the platform without them. This strengthens YouTube's dominance over TikTok and other competitors.
**Mobile and Browser Dominance:** Android and Chrome's AI features (Smart Reply, intelligent autofill, predictive text) create seamless experiences that competitors struggle to match without Google's data advantages.
## Near-Term Flywheel Accelerators
**Physical AI & Robotics:** Moving from digital-only AI to robots that can perceive and manipulate the physical world. Waymo has now driven 100+ million autonomous miles, generating unique physical-world training data.
**AI Biology:** DeepMind's protein folding breakthroughs and Isomorphic Labs' drug discovery pipeline could create massive pharmaceutical revenues while advancing the core AI engine.
**AI Materials Science:** Already discovering thousands of new materials that could dramatically improve batteries, semiconductors, and other hardware across all ventures—feeding back into better TPUs and infrastructure.
## The Compounding Network Effects
**Data Flywheel:** More users → More training data → Better AI models → Better products → More users. AI Overviews now drive 10%+ more queries for the types of searches that show them.
**Revenue Flywheel:** AI success → Higher cloud/advertising revenue → More R&D investment → Better AI → Market expansion. Google Cloud's 32% growth funds continued AI leadership.
**Talent Flywheel:** Best AI infrastructure → Attracts top researchers → Better models → More ambitious projects → Attracts even better talent. The recent $2.4B Windsurf acquisition shows Alphabet winning the talent war.
**Infrastructure Flywheel:** More AI demand → Larger TPU deployments → Better hardware optimization → Lower costs → More competitive offerings → More demand.
**Ecosystem Lock-in:** AI features across Gmail, Docs, YouTube, Search, and Android create switching costs that compound across products. Users don't just leave Google Search—they'd have to abandon their entire digital workflow.
## The Strategic Moat Widens
While competitors excel in individual areas, Alphabet's advantage comes from **deep integration creating compound effects**:
- **Capital Moat:** The $85B capex commitment (13% increase from 2024) exceeds most competitors' total revenues
- **Integration Moat:** OpenAI using Google TPUs despite being competitors proves the hardware-software integration is unmatched
- **Scale Moat:** 2+ billion AI Overview users and $50B+ cloud run rate create network effects competitors can't replicate
- **Ecosystem Moat:** AI embedded across Search, Gmail, YouTube, Android, Chrome, and Workspace creates compounding switching costs
- **Innovation Velocity:** Time from AI research to deployed products at billion-user scale continues compressing
## The Key Insight
The Q2 earnings reveal that Alphabet isn't just building an AI company—**they're building the infrastructure that accelerates invention itself**. Each breakthrough feeds back into the system: new discoveries generate revenue that funds more research, create better tools for the next breakthrough, and attract top talent.
More importantly, they're embedding AI so deeply into users' daily workflows—from Gmail to YouTube to Search—that switching becomes not just inconvenient but practically impossible. When your email, documents, entertainment, and information all work seamlessly together through AI, why would you ever leave?
The $85 billion capex increase signals management's confidence that they're approaching "escape velocity"—where their innovation rate becomes impossible for competitors to match. While others debate AI spending, Alphabet is already demonstrating profitable AI deployment at unprecedented scale while simultaneously investing in the next acceleration phase.
**The Bottom Line:** Alphabet's integrated flywheel of AI research, proprietary hardware, massive data, and patient capital is creating an innovation velocity that competitors are finding increasingly difficult to match. But their true moat is embedding AI so deeply into billions of users' daily habits that the entire Google ecosystem becomes indispensable—and the Q2 results prove this strategy is already working.

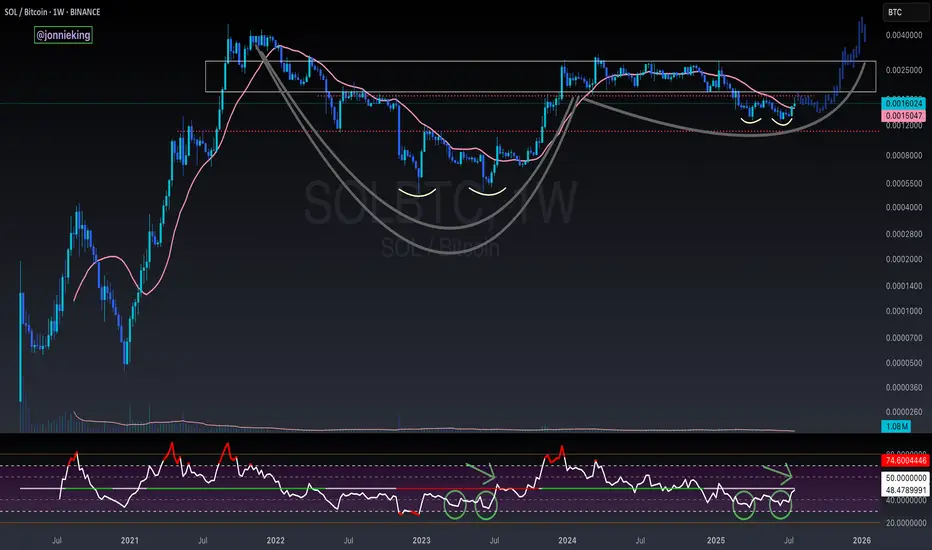
SOL / BTC Cup and Handle Weekly ChartBeautiful cup and handle on the SOL / BTC Weekly chart.
Need to break above the neckline and reclaim the POI.
Double bottom on the RSI matches just before the rip in July 2023.
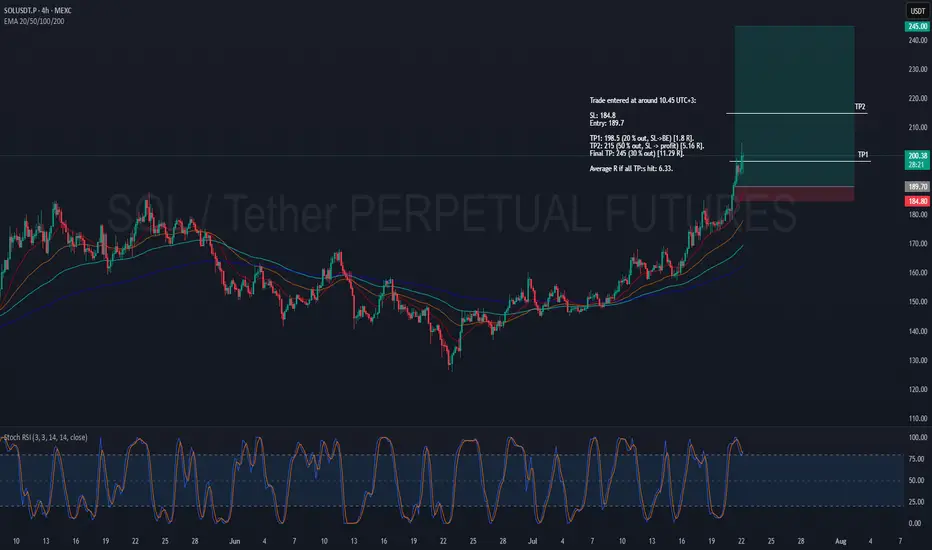
SOL long running - follow up on the Cup & Handle ideaPrice closed above both key levels I mentioned — 181 and the HTF S&R at 188 — with momentum and structure confirmation. That gave me enough conviction to enter a long.
🎯 Final TP aligns closely with the measured move target: 245.
📈 SL is already at breakeven after TP1 hit — risk-free from here.
Let’s see if SOL completes the full handle breakout.
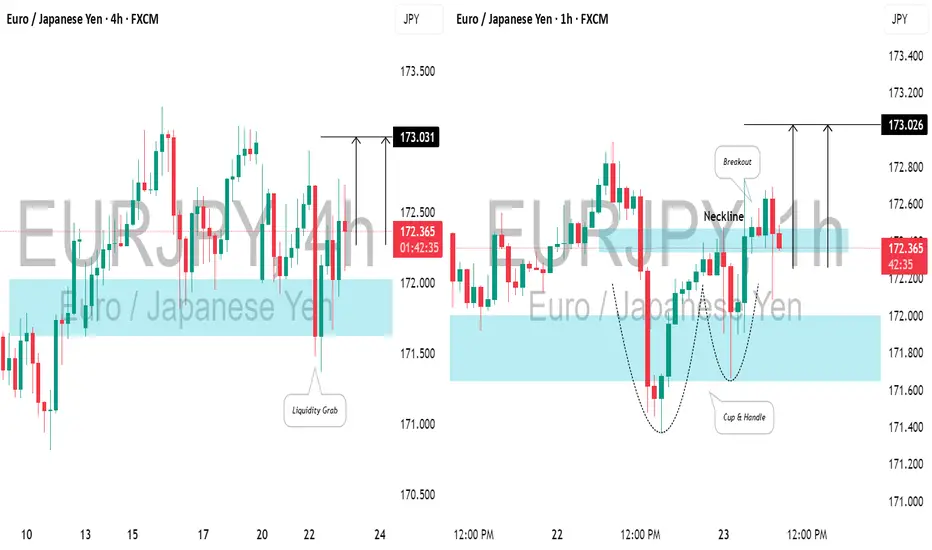
EURJPY: Bullish Move After Liquidity Grab📈EURJPY created a bearish high-range candle beneath a crucial support level in a horizontal trading range on the 4-hour chart.
However, a subsequent recovery and a bullish opening in the Asian session indicate a strong likelihood of an upward movement today, targeting 173.00.