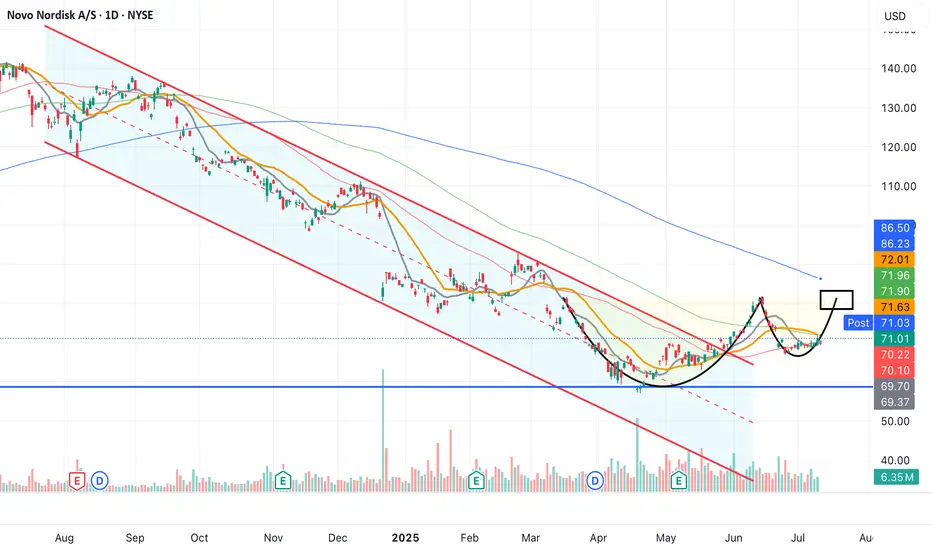
SWIGGY - Breakout Soon (1-3 months)#SWIGGY #breakoutstock #patterntrading #cupandhandle #roundingbottom #trendingstock
SWIGGY : Swing Trade (1-3 Months)
>> Breakout candidate
>> Trending stock
>> Cup and handle pattern
>> Rounding bottom in the long run
>> Good Strength & Volumes Dried up
Swing Traders can lock profit at 10% and keep trailing
Pls Boost, Comment & Follow for more analysis
Disc : Charts shared are for Learning purpose not a Trade Recommendation, Take postions only after consulting your Financial Advisor or a SEBI Registered Advisor.
Cup And Handle

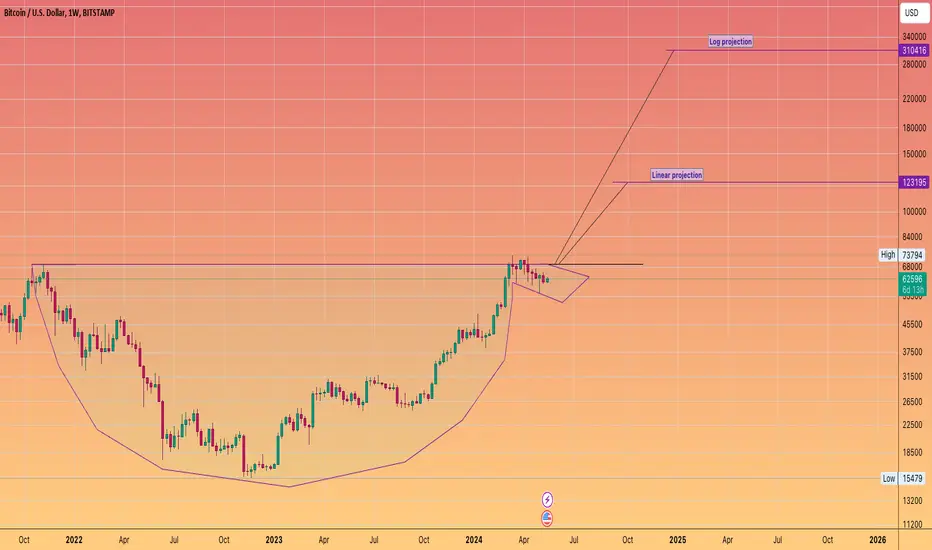
Balla is still Bullish on BITCOIN. Cup & Handle pattern. The trend is still our friend.
I still see bullish developments in the price action.
We must have patience.
Dips still must be bought.
The plan hasn't changed.
We still aiming for that time period of 9 -15 months post #BTC Halving.
We are only one month down :)
BTC CUP and HANDLE?BTC made triple top not it is making cup and handle pattern. If it successfully brakes the handle it might reach to 120-122K

Silver to Make $41 before the leaves change colorVery old cup and handle .. but will dance on $41 before passing thru 50

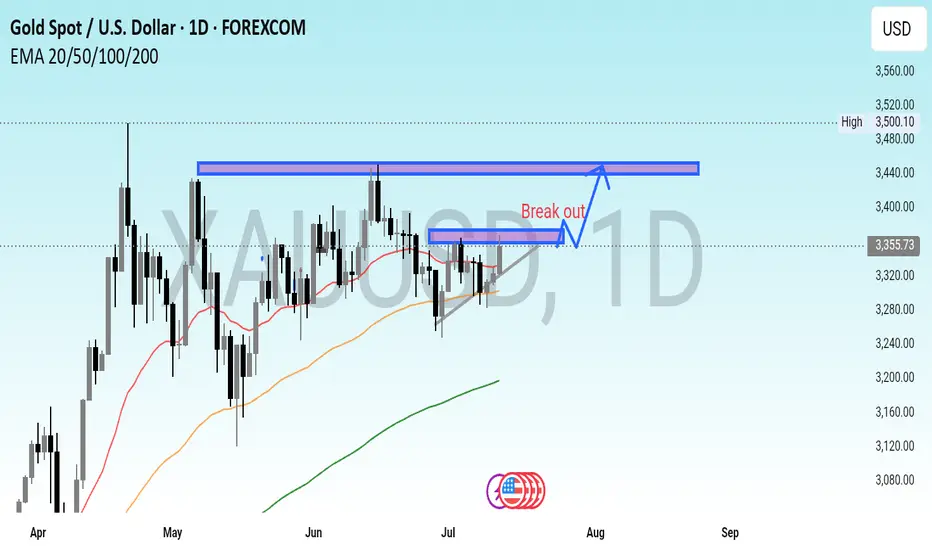
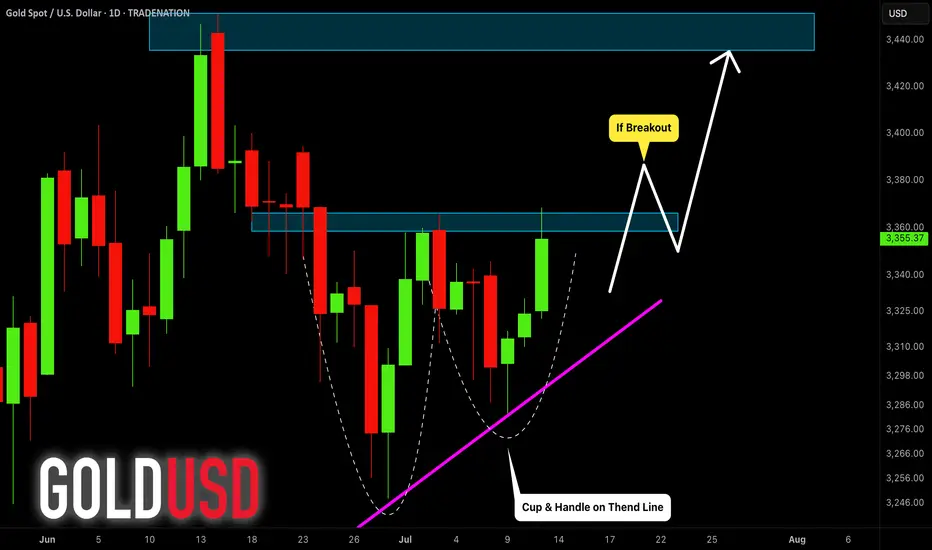
XAUUSD Approaching Breakout Zone – Watch for Confirmation GOLD (#XAUUSD) – High-Probability Bullish Continuation Setup
Gold is maintaining its strong bullish structure on the daily timeframe, having recently respected a rising trendline, confirming ongoing buyer interest and market confidence.
Currently, price action is forming a well-defined Cup & Handle pattern, which is considered a high-probability bullish continuation formation. The market closed last week near the neckline resistance around the 3367 level, showing signs of pressure building for a breakout.
Key Technical Insight:
A daily candle close above 3367 will confirm a breakout of the neckline and validate the bullish setup. However, for entry confirmation, a clean breakout and daily close above 3380 will provide a stronger technical signal and reduce the likelihood of a false breakout.
Technical Summary:
Chart Pattern: Cup & Handle
Trend Structure: Rising Trendline (Confirmed)
Neckline Resistance: 3367
Breakout Entry Level: 3380+
Bias: Bullish
Timeframe: Daily
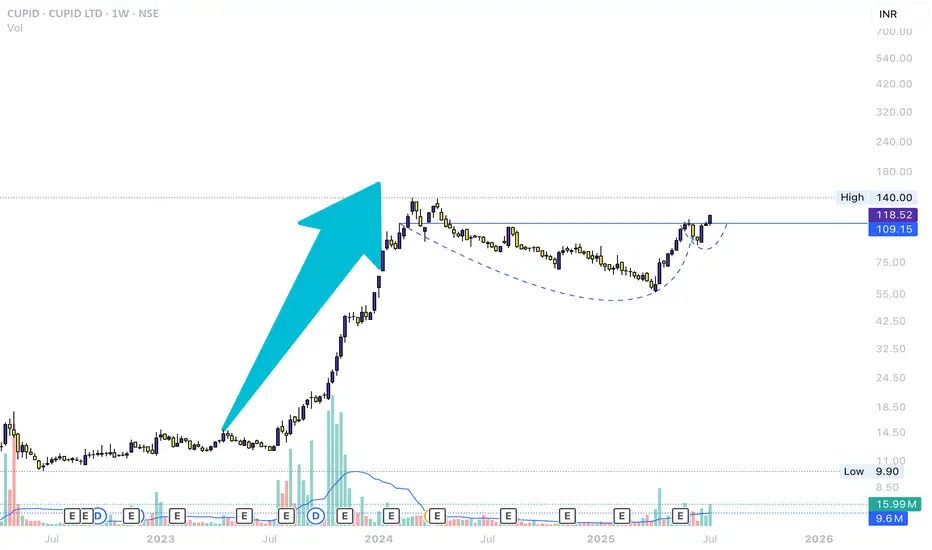
NSE.CUPID LONG IDEASuck a beatiful chart patter, Clear Uptrend and Consolidation
Forming Cup & Handle continuation patter and breakout.
Stock can be considered for long term. Keeping SL just below the breakout candle
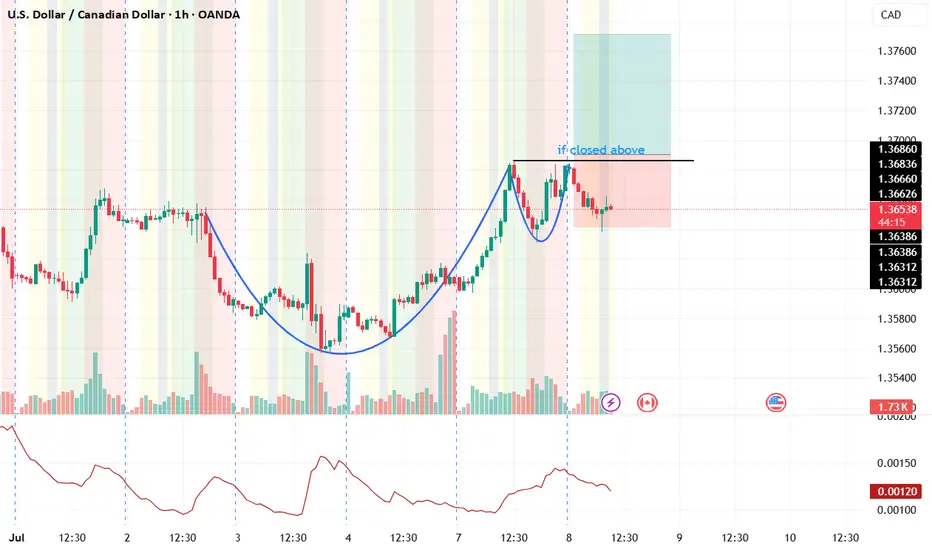
usd cad cup and handleit seems the handle is broken and if you touch the body you may burn your hand, for archiving the matter im doing this idea feel free to comment and share your ideas
cup and handle emerging exprimentalthese are just experimental ideas. help me with what you think. and hope you profit today ...
GOLD (XAUUSD): Another Bullish Pattern
Gold perfectly respected a rising trend line on a daily and
bounce from that, as I predicted earlier.
I see a strong bullish pattern on that now.
The price formed a cup & handle pattern and closed
on Friday, testing its neckline.
The next bullish confirmation that you should look for is its breakout.
Daily candle close above 3367 level will provide a breakout validation.
A bullish continuation will be expected then.
❤️Please, support my work with like, thank you!❤️
I am part of Trade Nation's Influencer program and receive a monthly fee for using their TradingView charts in my analysis.
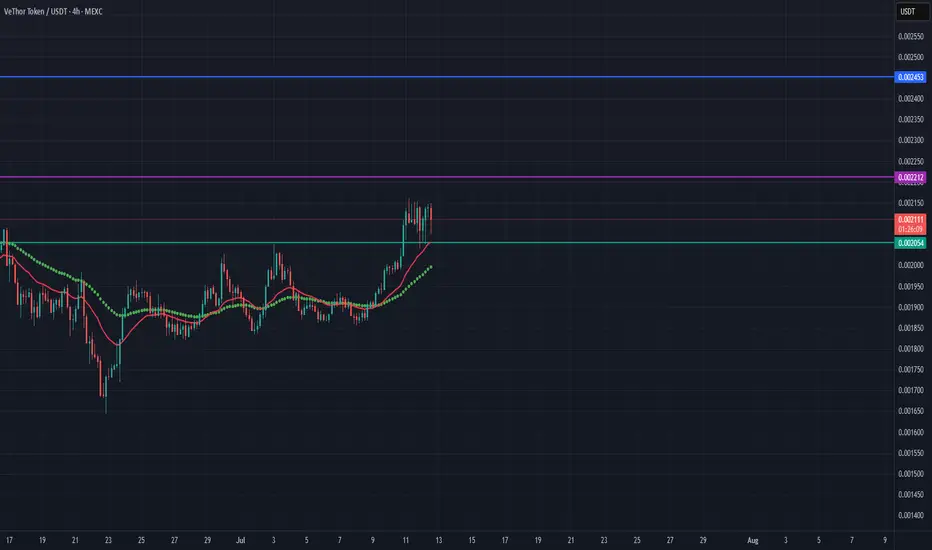
VTHOUSDT // As long as we stay on the green line, the direction is up. The first target is Fibo 1.414, which is 0.002212, the main target is 0.002453. Cut losses when closing below the green line.
Invert Head and shoulder + cup with handle + 2x Double bottomOkay so I tried naming this pattern but gave up halfway because:
There’s a clean Inverted Head & Shoulders
A perfectly awkward Cup with Handle
And not one but two Double Bottoms, stacked like technical lasagna
All that drama right under the same resistance zone
👹 The red rectangle? It’s been tested five times already. FIVE.
If this level breaks, it won’t just be a breakout — it’ll be a ritual summoning. A support level forged in volume, trauma, and the unholy power of pattern layering.
If it flips, this zone is gonna be support backed by every TA demon in the book.

Cup & Handle to 81$ (and much more)Breakout successful from the red descending channel where we had left it in the previous idea.
The price is now completing the 'handle' of the pattern in question.
Resistance is around $81.5, and a close above it, accompanied by strong volume, could push the price back toward $100
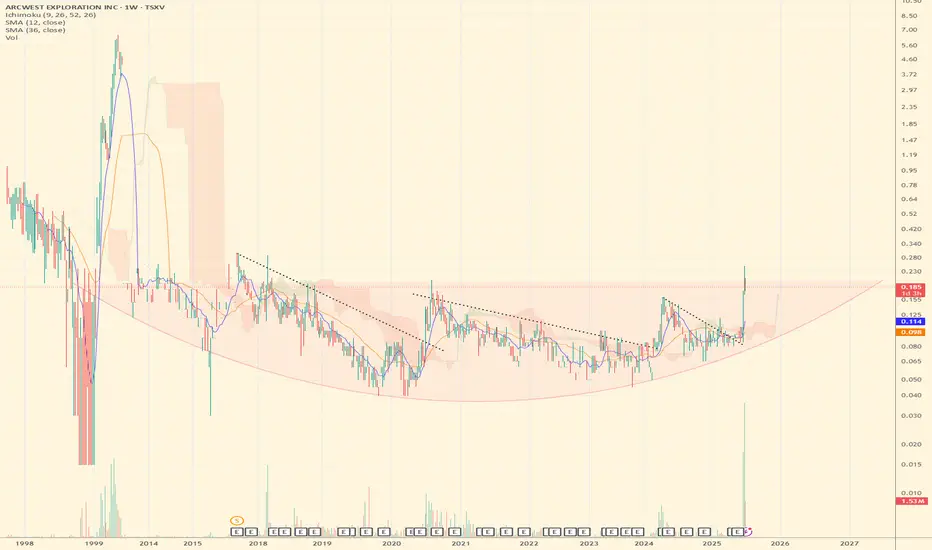
AWX - Breakout from Multi-Year Cup & Handle + JV Deal with FCXArcWest Exploration (TSXV: AWX) just broke out of a 7-year cup & handle formation, hitting C$0.21 with record weekly volume (1.53M).
📉 Long-term downtrend decisively broken
📊 12W SMA (0.114) > 36W SMA (0.098)
☁️ Weekly Ichimoku turns bullish
🔻 Pullback to C$0.185 (-7.5%) may offer entry
🔎 Next resistance zone: C$0.30+
Fundamental trigger:
ArcWest Exploration is a project generator focused on porphyry copper-gold systems in British Columbia, operating under a JV-based model. The company currently has eight 100%-owned projects, several of which are already partnered with major producers.
The recent breakout follows the announcement of a joint venture agreement with Freeport-McMoRan on the Eagle project, where Freeport can earn up to 80% interest by spending C$35M over 10 years, including staged cash payments and a commitment to fund exploration.
This deal marks ArcWest's second major JV partnership, alongside Teck Resources (on the Oxide Peak project), further validating the quality of its portfolio. Both Freeport and Teck are known for targeting large, long-life copper assets, which adds strong institutional backing and long-term exploration potential.
The alignment of technical breakout + institutional interest signals a possible structural re-rating as the market begins to price in multi-asset optionality and tier-1 partnerships.
The chart and fundamentals now align, suggesting multi-year upside potential.
📌 Do your own research before investing!
XAGUSD ~750 USD!?Hello. SILVER is approaching the cap of a multi-decade 'cup and handle' pattern. The measured move from that pattern reaches ~750USD/oz. GOLD has already reached the capping line of the 'cup and handle' and has continued up. Silver is known to lag Gold and outperform in the end. Position wisely my brothers and sisters.

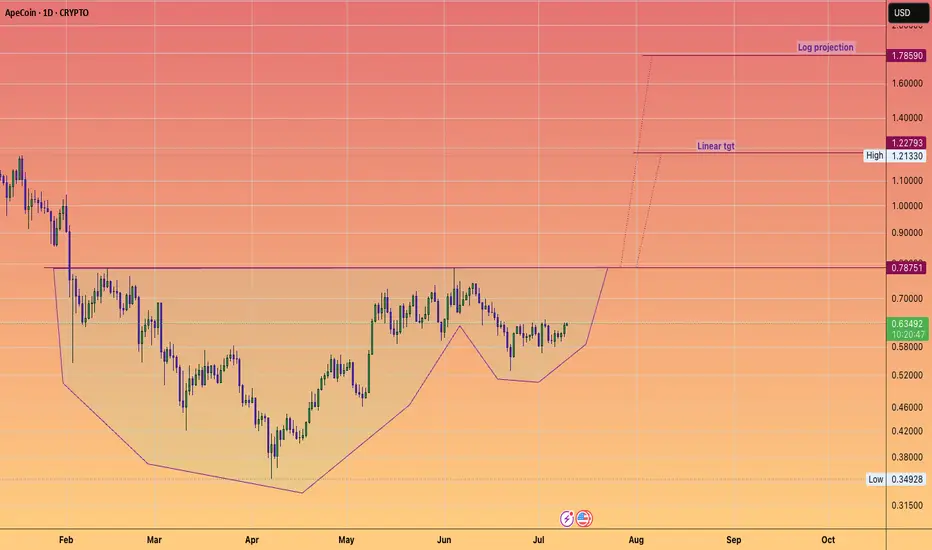
APE coin cup & Handle. This chart shows good potential as the #Alts start to take back center stage form #BTC
neckline around 79c
could be a triple if Alts can sustain an uptrend.
it's been a while
but the time is now
if it is to be the case.
CHFJPY (W) CUP AND HANDLE PATTERN CHFJPY has formed a C&H pattern on its weekly chart.
The price is trading above the Breakout: 149.799.
ST: 143.377
Targets:
62%: 179.736
79%: 87.879
100%: 197.640

ACRE on the verge of H&S breakoutACRE has consolidated into a cup and handle formation over many weeks
Target 6.5
Stoploss at 4.7

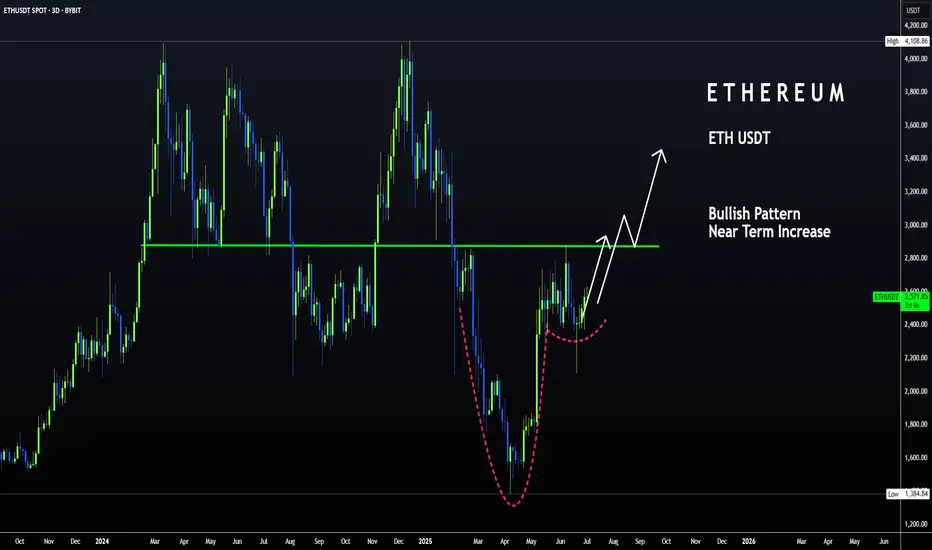
ETH | Bullish Pattern - Cup and Handle +15%A Bullish pattern is appearing on the Ethereum chart.
From a Cup and Handle pattern, we can easily expect atleast a 15% increase. This is true for the near term. A +15% would put us here:
Just under $3K we may see heavy resistance. This is also the neckline resistance, as it was the previous support for the breakout that ultimately led to a new ETH ATH.
_______________________________
BYBIT:ETHUSDT
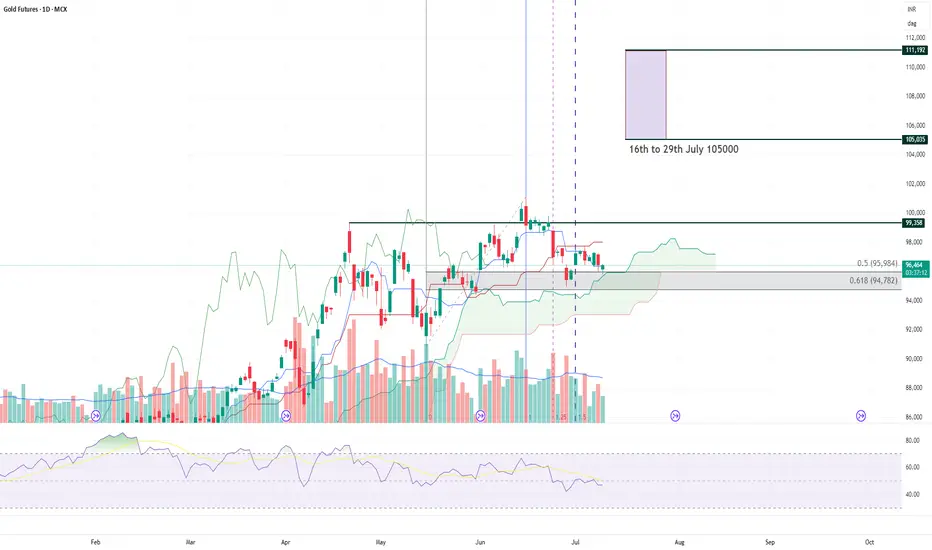
Gold MCX Bullish MoveGold as long as it is staying above the ichimoku cloud it can show a bullish move from here within a few days.. this month we can expect some movement on the upside clearing highs.
Stop loss can be kept near 94700-95300 levels with target of 102000 - 105000 with this month.
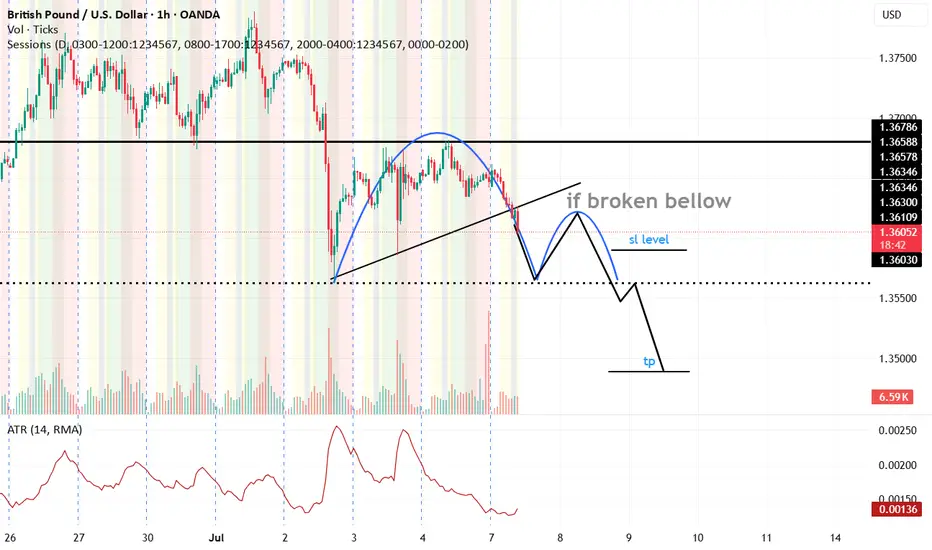
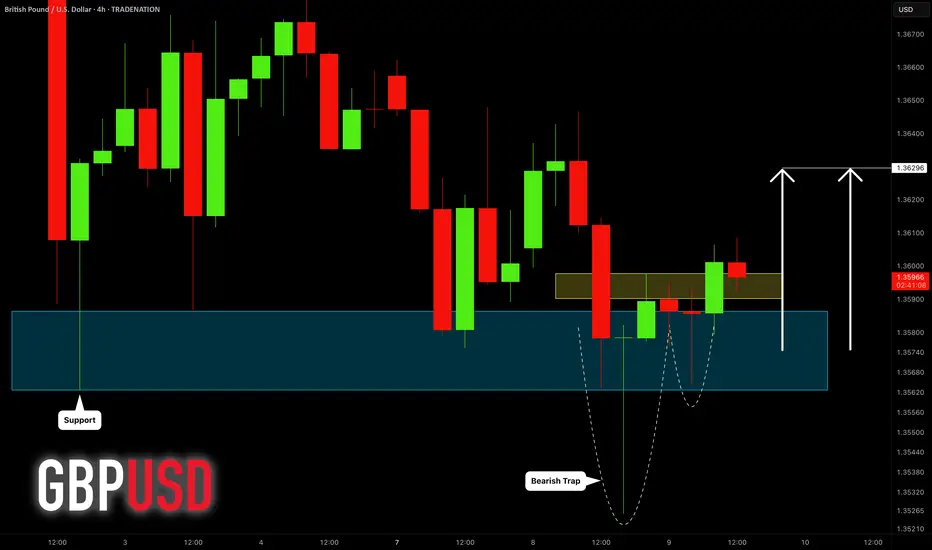
GBPUSD: Bullish Move After Liquidity Grab 🇬🇧🇺🇸
GBPUSD formed a bullish high range candle with a long lower wick going
below a key horizontal demand zone on a 4H.
A consequent recovery and a bullish London session opening suggest
a highly probable rise today.
Goal - 1.363
❤️Please, support my work with like, thank you!❤️
I am part of Trade Nation's Influencer program and receive a monthly fee for using their TradingView charts in my analysis.
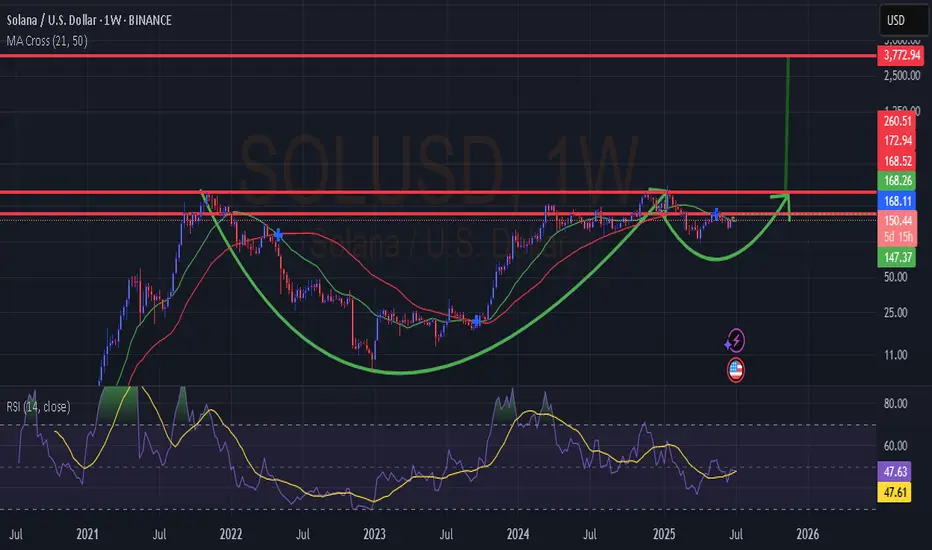
SULUSD Cup & HandleHi All, SOLUSD in a textbook cup & handle pattern. It might break sooner than indicated. Current price is a steal imo. Keep an eye for a strong breakout. Not financial advice. If you enjoyed the content of this analysis, please do leave a like for future updates. Lets crush this market. Be safe.
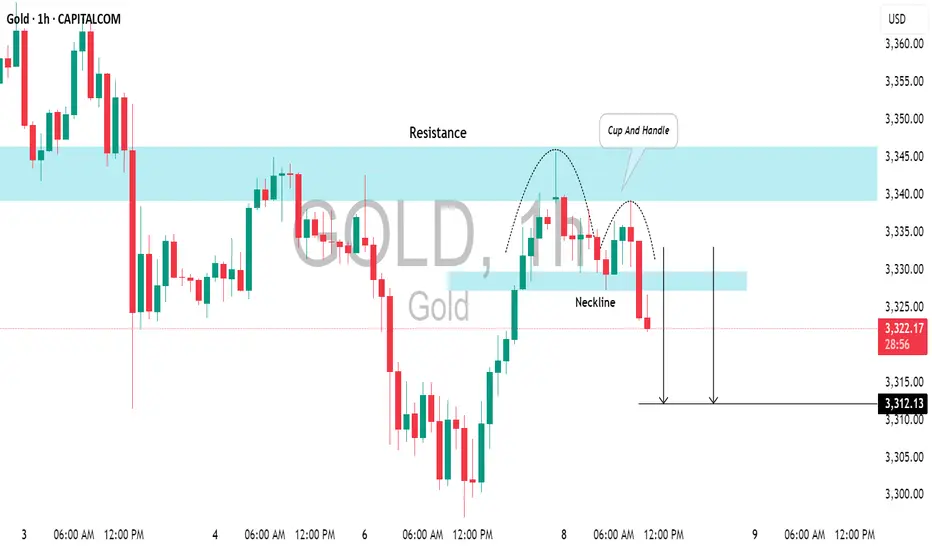
GOLD (XAUUSD): Pullback From ResistanceI believe that 📉Gold price may continue to decline from the identified resistance level.
This outlook is supported by the formation of a cup and handle pattern on an hourly time frame.
My target for this retracement is set at 3312.
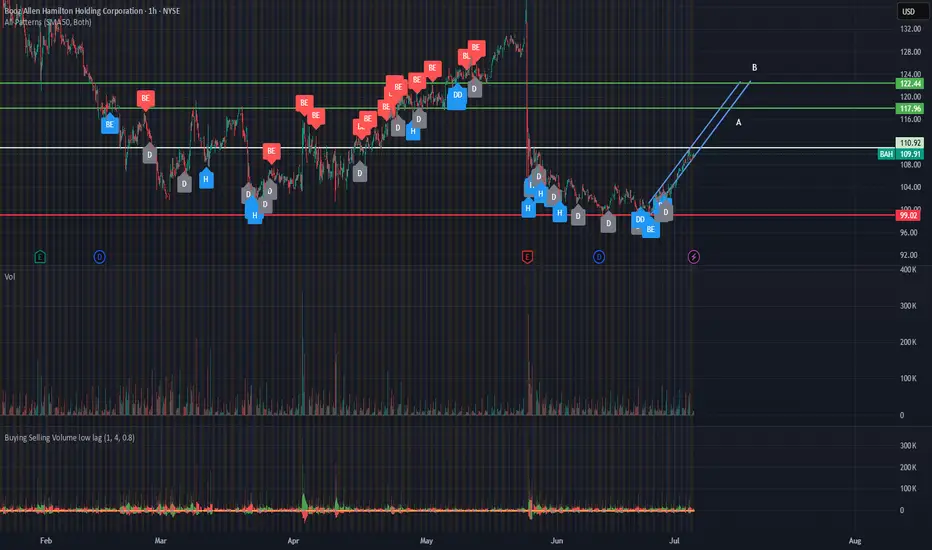
BAH Gaining Momentum With New DOD ContractsBAH recently fell after missing earning expectations, though the results were quite decent. It is currently sitting at 57% of 52 Weeks high. Seems oversold. Its AI products are going to contribute significantly to future revenues. Recently on June 16th, it won a DoD contract worth $96.07 million. Plus, the SMA (10) is finally crossing above SMA (50).
First target (A) seems to be $115 ish. If it breaks that resistance, 2nd target (B) seems to be about $122+.
NFA, just sharing my learning. :)