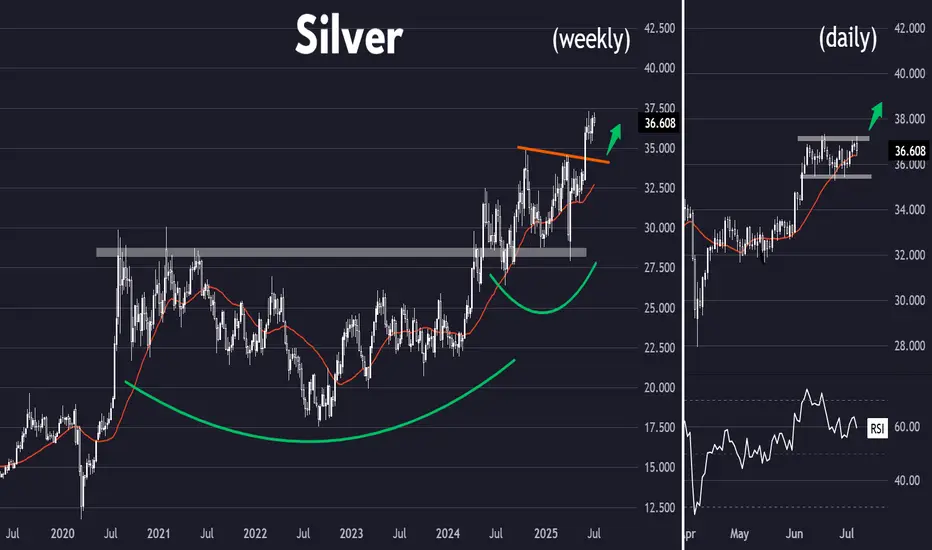
Cheap jewellery (Silver XAG/USD)Setup
Silver is sitting just under multi-decade highs having broken above $34 resistance last month. The long term cup and handle pattern is still in place.
Signal
The price has been consolidating in what could be a bull flag pattern between 35 and 37. A breakout could trigger the next leg of the uptrend, whereas a drop below the bottom of the flag would imply a retest of 34.
Cup And Handle
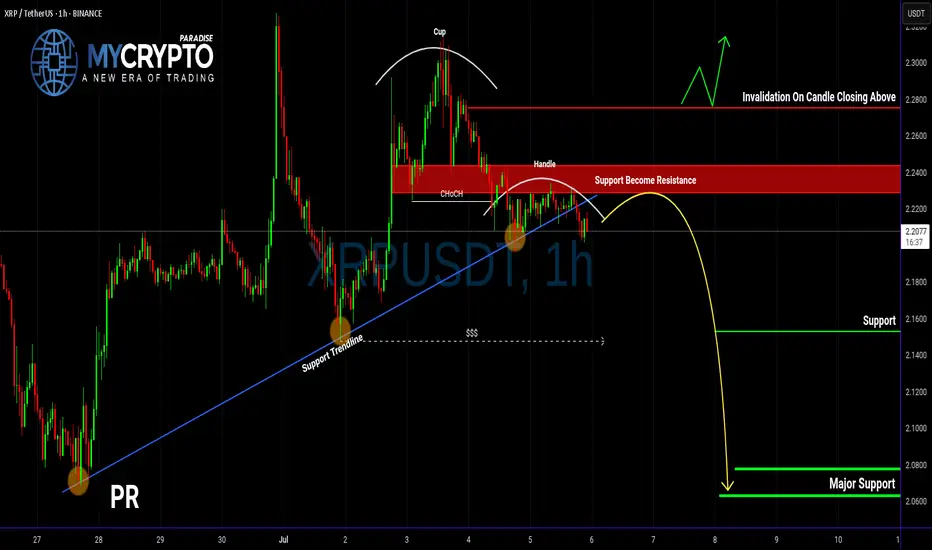
XRP Breakdown Ahead? Don’t Get Caught LongYello, Paradisers! Are you about to fall into a classic trap on XRP? The signs are stacking up, and if you're not careful, this move could catch a lot of traders on the wrong side of the market.
💎XRPUSDT is showing clear signs of weakness. A bearish CHoCH (Change of Character) has formed, and an inverse Cup & Handle pattern is currently playing out. On top of that, price action has decisively broken below the key support trendline. These signals together significantly increase the probability of a deeper bearish move in the coming days.
💎From the current price level, XRP is offering a 1:1 risk-to-reward setup. While this may attract more aggressive or short-term traders, the safer and more strategic approach is to wait for a proper pullback before entering. That would allow for a more favorable risk-to-reward and confirmation of the trend direction, reducing the likelihood of being caught in short-term noise.
💎It’s also crucial to watch the invalidation level. If XRP manages to break back above that zone and close a candle above it, this would invalidate the current bearish idea entirely. In such a case, it's better to stay patient and wait for clearer price action before making any decisions.
🎖Strive for consistency, not quick profits. Treat the market as a businessman, not as a gambler.
MyCryptoParadise
iFeel the success🌴
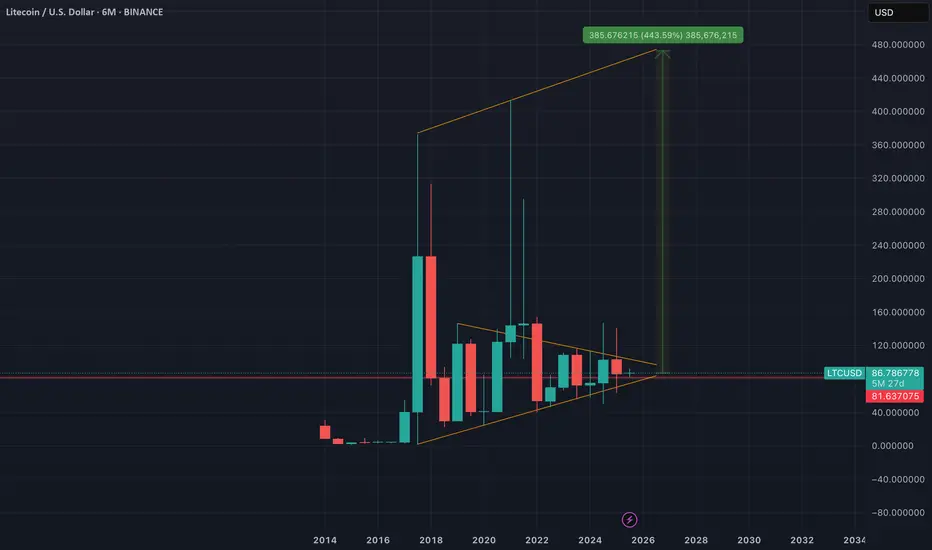
LITECOIN (LTC) - On The Verge Of Exploding - ETF Catalyst?Litecoin: A Decentralized Network with a Differentiated Risk Profile
Litecoin (LTC), launched in 2011 by former Google engineer Charlie Lee, is one of the oldest and most active Layer-1 blockchain networks in the cryptocurrency space. Often referred to as the “digital silver” to Bitcoin’s “digital gold,” Litecoin was designed to offer faster transactions, lower fees, and broader accessibility while maintaining a similar monetary policy and codebase.
This post aims to provide an overview of Litecoin’s technical structure, usage, risk profile, and current developments—without speculative bias—so readers can form their own assessments.
1. Transparent Origins and Founder Dynamics
One key difference between Litecoin and Bitcoin lies in the identity of their respective creators. Bitcoin was developed by Satoshi Nakamoto, a pseudonymous and still-unknown individual or group, who is estimated to hold 750,000 to 1.1 million BTC—a significant portion of the total supply that has never moved. The dormant status of these holdings has occasionally raised concerns about future market impact if they were ever activated.
In contrast, Litecoin was founded by Charlie Lee, a known and public figure who was active in the community before, during, and after the launch. In 2017, Lee announced he had sold or donated nearly all his LTC holdings to avoid any potential conflict of interest. Today, no founder or insider is known to hold a disproportionate share of the Litecoin supply. This level of transparency and decentralization has been interpreted by some as a factor that lowers long-term governance and concentration risk.
2. Structural Simplicity and Leverage Exposure
Another distinction between Litecoin and Bitcoin lies in market structure and exposure to leverage.
Bitcoin is widely used as collateral in crypto lending markets and institutional derivatives, including perpetual futures and structured products. This has introduced significant systemic risk during periods of market stress, as high leverage has historically led to cascading liquidations across centralized and decentralized platforms.
Litecoin, in contrast, has relatively limited exposure to leveraged products and collateralized lending. It is not commonly used as collateral in CeFi or DeFi protocols, and institutional futures markets for LTC are smaller and less active. As a result:
Litecoin is less likely to trigger or be affected by mass liquidations
It has reduced systemic risk due to lower market entanglement
Its price tends to reflect more organic supply/demand dynamics
It is less involved in cross-collateralized or rehypothecated loan systems
This simpler structure may appeal to risk-aware investors looking for cleaner exposure without the reflexivity effects common in heavily leveraged markets.
3. Scarcity and Monetary Policy
Litecoin shares a similar deflationary model with Bitcoin, with a hard cap of 84 million LTC and scheduled halving events every four years. The most recent halving occurred in August 2023, reducing the block reward from 12.5 to 6.25 LTC per block.
With over 75 million LTC already mined, fewer than 9 million remain in future issuance. The protocol’s monetary policy is deterministic and cannot be altered unilaterally, which may appeal to those who prioritize predictable supply and inflation resistance.
While Litecoin’s cap is four times higher than Bitcoin’s, the relative issuance schedule and halving dynamics mirror Bitcoin’s design. Some investors view this as a hedge against fiat currency debasement, although the asset's volatility and adoption context should be taken into account.
4. Network Fundamentals and Real-World Use
Litecoin has maintained near 100% uptime since inception, and its transaction throughput and fee structure are generally favorable compared to many competing networks.
In 2024, Litecoin became the most used crypto for payments via BitPay, surpassing Bitcoin in transaction volume, driven by its fast 2.5-minute block times and low transaction fees. It is supported by major platforms including PayPal, and accepted by thousands of online and retail merchants.
From a security perspective, Litecoin’s hashrate reached all-time highs in 2025, partly due to merge-mining with Dogecoin, which has helped strengthen its proof-of-work infrastructure. Network upgrades like MWEB (MimbleWimble Extension Blocks) have added optional privacy layers to Litecoin’s UTXO model, while Lightning Network integration supports instant payments.
These developments suggest that Litecoin continues to evolve, with emphasis on efficiency, user privacy, and practical usability.
5. Institutional Presence and ETF Outlook
Litecoin has seen modest but growing institutional involvement. Products such as the Grayscale Litecoin Trust (LTCN) have existed for several years, and Coinbase introduced Litecoin futures trading in 2024. Fidelity also offers LTC trading and custody to institutional clients.
More notably, a Spot Litecoin ETF application is currently under review by the U.S. Securities and Exchange Commission (SEC), with analysts from Bloomberg estimating a 95% probability of approval before the end of 2025. If approved, this would make Litecoin one of the first proof-of-work assets outside of Bitcoin to gain direct exposure through a regulated ETF vehicle.
Should that happen, it may increase access, liquidity, and legitimacy among traditional investors. However, as always, regulatory decisions remain uncertain and subject to broader political and market conditions.
6. Technical Structure and Long-Term Price Action
From a macro-technical perspective, Litecoin has historically followed a pattern of higher lows and higher highs across each market cycle. This structure remains intact as of 2025, with a strong support at 81 USD on a 6 months timeframe.
Summary
Litecoin presents a combination of characteristics that differentiate it from other crypto assets, including:
✅ A public, transparent founder and no major insider dominance
✅ Limited exposure to leveraged lending, reducing systemic risk
✅ Deterministic monetary policy with a fixed supply and halving schedule
✅ Real-world usage in payments and retail adoption
✅ Strong network security and development activity
✅ Potential ETF approval that may broaden accessibility
These features do not necessarily imply outperformance, but they form the basis for an asset with a relatively clean structure, historical resilience, and a distinct position in the crypto ecosystem.
🔎 Disclaimer:
The information presented here is for educational and informational purposes only and should not be interpreted as financial advice.
Always conduct your own research, assess your individual risk profile, and make investment decisions based on your own analysis and objectives.
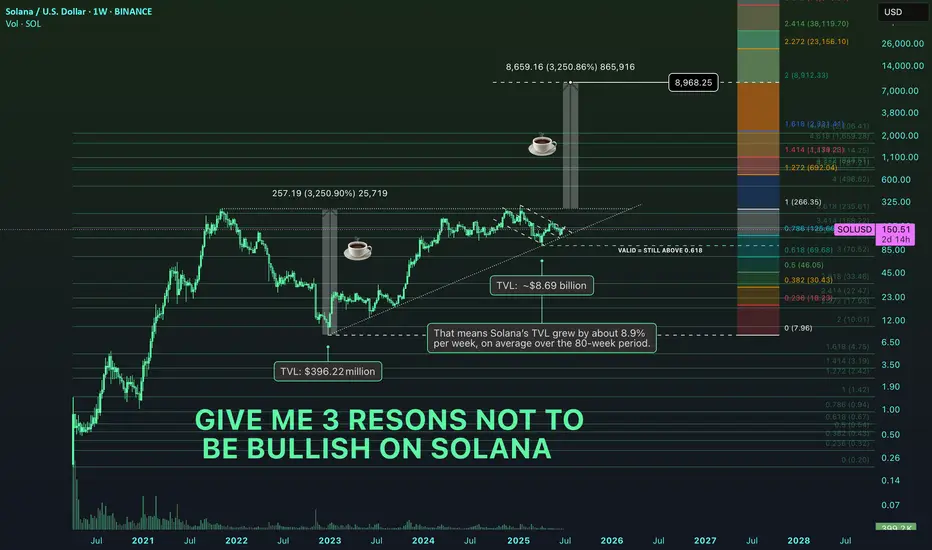
Give me 3 reasons not to be bullish on SolanaSolana’s Total Value Locked (TVL) expanded from $396M on Dec 26, 2022 to $8.69B by July 4, 2025, a 2,094% increase (~22x growth) across 80 weeks . This translates to a weekly geometric growth multiplier of ~1.089, or an 8.9% compound weekly rate .
This rapid TVL expansion reflects capital inflows, increased DeFi participation, and regained trust in Solana’s infrastructure following the FTX collapse.
————————————————
LST Ecosystem Expansion :
Liquid staking derivatives (JitoSOL, mSOL) accounted for a significant share of inflows, as yield-seeking capital returned with Ethereum-style primitives on Solana.
MEV Monetization & Compression Tech :
Validator-side MEV solutions and data compression (via Firedancer and ZK-state) improved scalability and trust in Solana’s low-latency environment.
Resurgence of DeFi-NFT Hybrids :
Protocols like Tensor and HadeSwap blurred lines between DeFi and NFTs, generating sticky liquidity and reinforcing Solana’s unique narrative.
Restored Institutional Confidence :
Post-FTX reforms and a more diversified validator ecosystem helped re-attract institutional capital, supported by enhanced wallet infra (e.g., Backpack, Phantom) and custodianship.
This pattern, paired with the geometric growth trend, suggests Solana’s DeFi ecosystem is entering a new structural bull phase, underpinned by both technical confirmation and fundamental evolution.
Anyways, let me know in the comments 3 reasons not to be bullish on Solana as we speak.
(PS: QC-resistant issues don’t apply only for Solana but for all major crypto assets!)
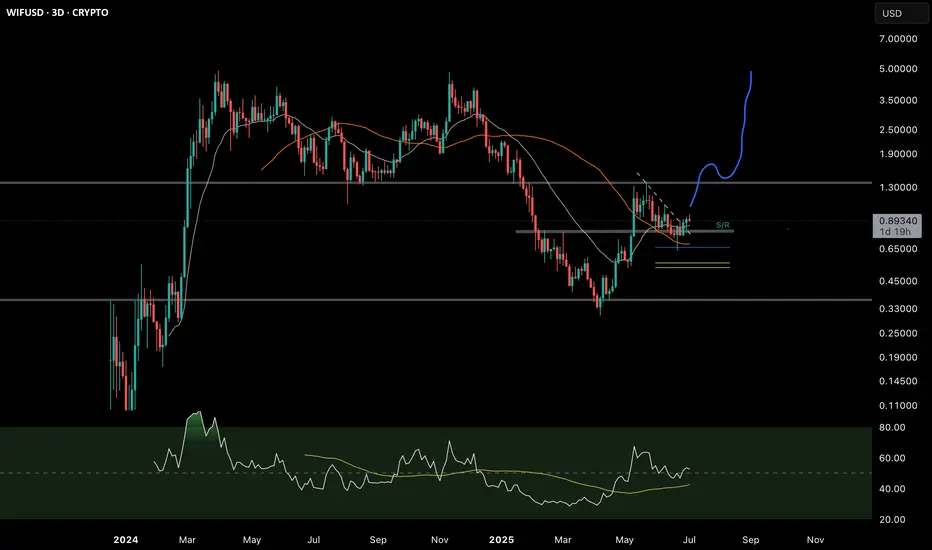
Is the hat back on?Bullish scenerio for BINANCE:WIFUSDT
Recently we can see:
1. Bouncing off GP (0.5)
2. Retested local TL
3. Retested local support (S/R)
4. Broke 50 RSI
Reaching 1.37 resistance would print a cup and handle pattern…
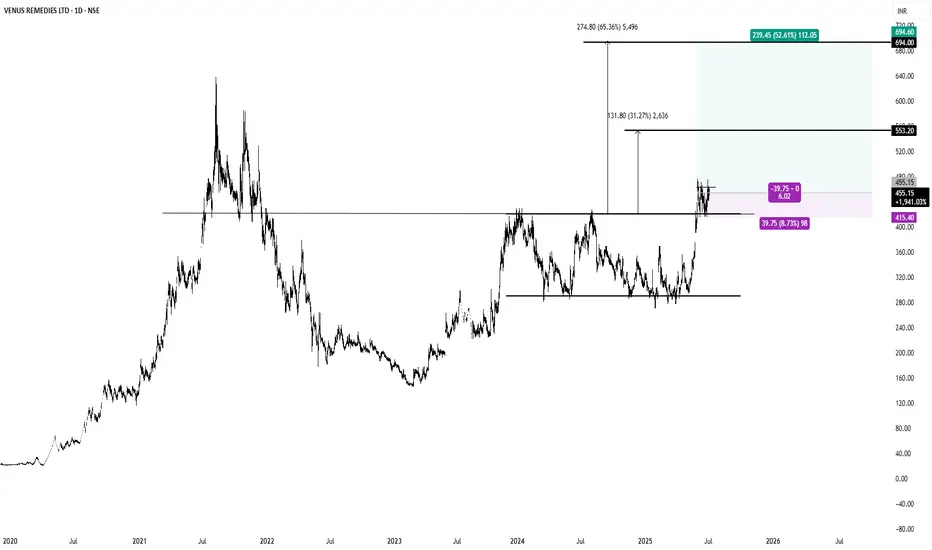
$VENUSREM #INDIA #NSE1. Cup and Handle Break Out.
2. Parallel Channel Break Out.
3.R:R >6 , Tight Stop Loss.
THELEELATHELEELA is giving resistance + cup and handle breakout above 414 level. Market participation has also increased in recent sessions. So if it sustains and closes above 414 then it looks very attractive and may start new momentum rally. 398 seems very good support. On upper side we may see momentum of 10-12%. Make sure that it sustain and closes above 414!

Spotting the Cup: A Technical Dive into Modon Holdings PSCThis chart illustrates a potentially valid Cup with Handle pattern on Modon Holdings PSC's daily chart. The cup formation appears well-rounded, with a reasonable depth that aligns with standard pattern criteria. The handle is correctly positioned following the cup and slopes slightly downward, which is acceptable and typical.
However, for a more reliable confirmation, it's important to assess two key factors:
1. Volume Dynamics: Ideally, volume should contract during the handle formation and expand significantly on the breakout. This confirmation is not visible from the chart provided and should be verified.
2. Pattern Duration: The pattern seems to have developed over a relatively short period. The Cup with Handle is generally more reliable when it forms over several weeks to a few months on a daily chart.
Overall, the drawing is structurally accurate, but traders should confirm volume behavior and ensure sufficient pattern maturity before acting on this setup. Constructive feedback is welcomed if others spot additional nuances.

CHOLAFIN – Cup & Handle Breakout | Target ₹2120 (28% Upside)CHOLAMANDALAM FIN has confirmed a classic Cup and Handle breakout after 9 months of base formation. The neckline at ₹1645.85 has been cleanly crossed with strong follow-through and high volume.
Pattern Structure:
Cup Base: Formed between Sep–Dec 2024, bottomed near ₹1170
Handle: Shallow, corrective structure in May 2025 — ideal proportion
Breakout Zone: ₹1645.85 (horizontal resistance since Sep 2023)
Breakout Candle: Strong close at ₹1654.10 with high conviction volume (5.84M vs 2.3M avg)
Trade Setup:
Entry: Confirmed on breakout close above ₹1645
Target: ₹1645.85 + ₹472.85 = ₹2120
Stop Loss: ₹1545 (below handle low)
Risk-Reward: ~1:2.5 for positional traders
Indicators:
Volume: Significant spike, validating breakout
RSI: 60.2 and rising — bullish, not overbought
Moving Averages: Price well above 20 SMA, momentum aligned
Bias & Strategy:
Structure favours long-only positioning. Ideal for trend followers. Breakout is supported by volume and proper consolidation. Short-term pullbacks toward ₹1645–₹1620 can offer re-entry. Avoid shorting — this is the start of a fresh leg higher.
Disclaimer:
This analysis is shared strictly for educational and informational purposes. It does not constitute investment advice, nor is it a recommendation to buy, sell, or hold any securities. You are advised to perform their own due diligence, assess risk tolerance, and consult a registered financial advisor before making any investment decisions.

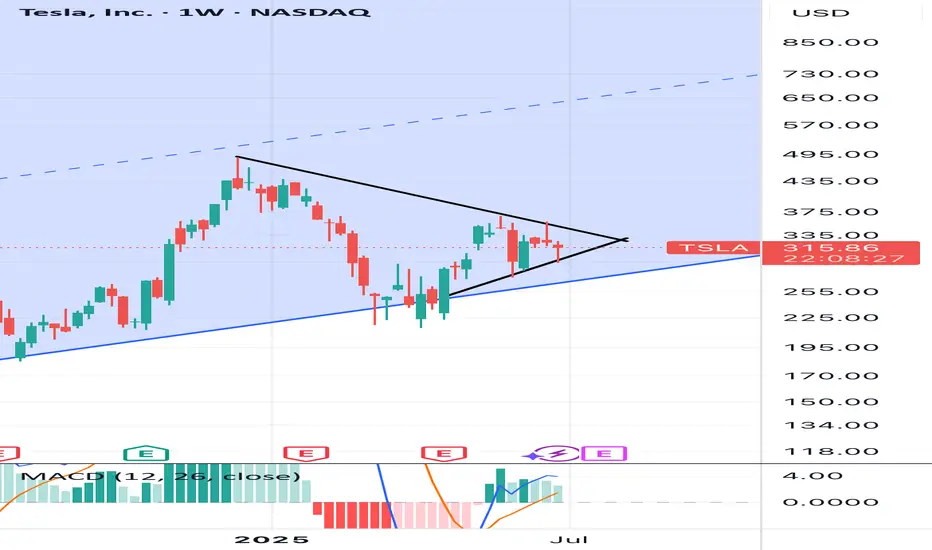
Big fat cup & handle on the weekly My instinct tells me today was the last dip buying opportunity before parabolic move. The daily chart is showing wedge consolidation and big institutions are buying. Elon just needs to focus
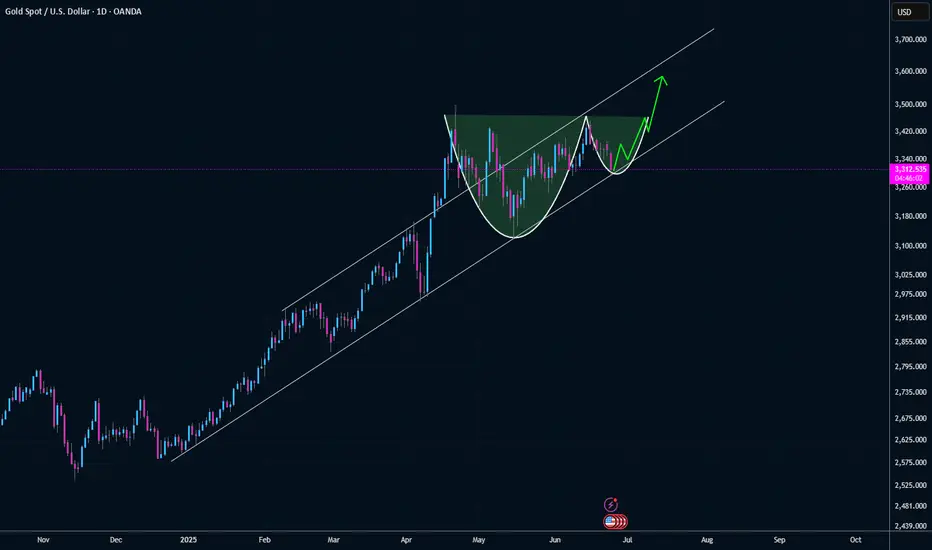
Gold going down Gold just made cup pattern I believe it’s clear sign for short and deep short let’s see
PVSLStrong upmove expected from CMP. Breakout of Cup and Handle pattern in daily timeframe, crossed trendline in daily and weekly timeframe.

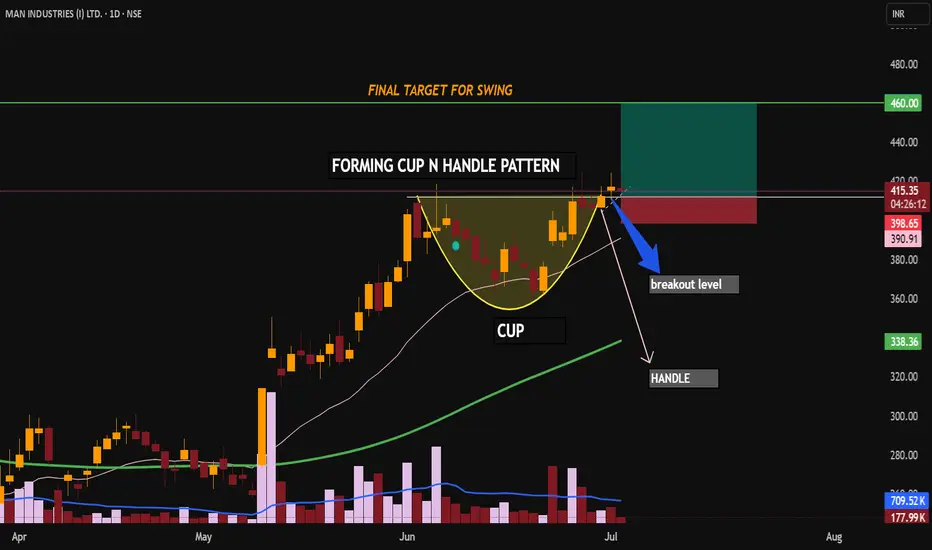
Swing Trade Plan: MAN Industries (NSE: MANINDS)
A classic Cup & Handle Pattern bullish continuation pattern showing accumulation and a breakout from resistance. Indicates renewed buying interest.
Breakout supported by rising volume, confirming buyer strength.
Price holding above 20 and 50 EMA, indicating bullish trend continuation.
Company has consistent order inflows and is part of infra/pipe supply chain, aligning with current government spending themes.
This is my personal swing trade plan based on price action and fundamental analysis. Please do your own research before taking any investment decision.
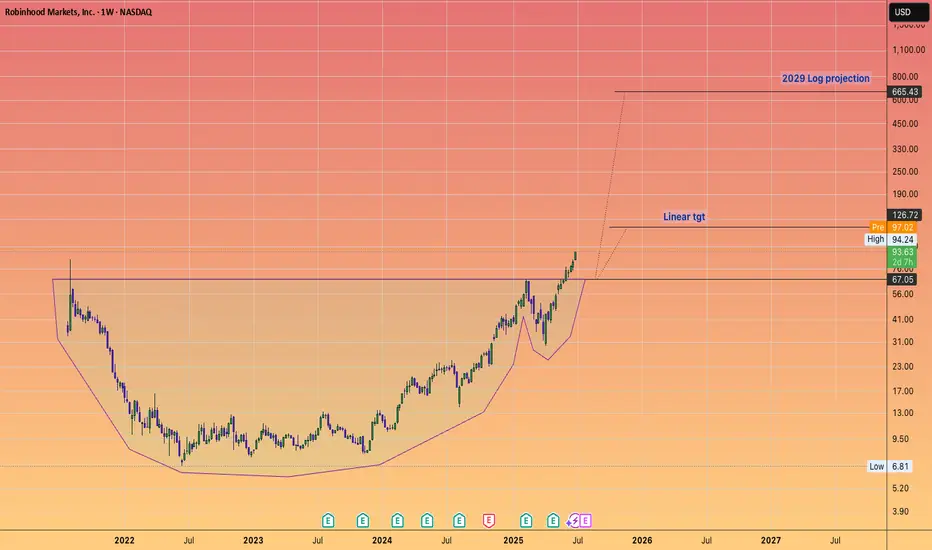
VLAD impaling WALL ST!I believe Robinhood will achieve over One Trillion dollars in assets in very short order.
Giant Cup and Handle is your technical setup.
(I have covered hood at the low)
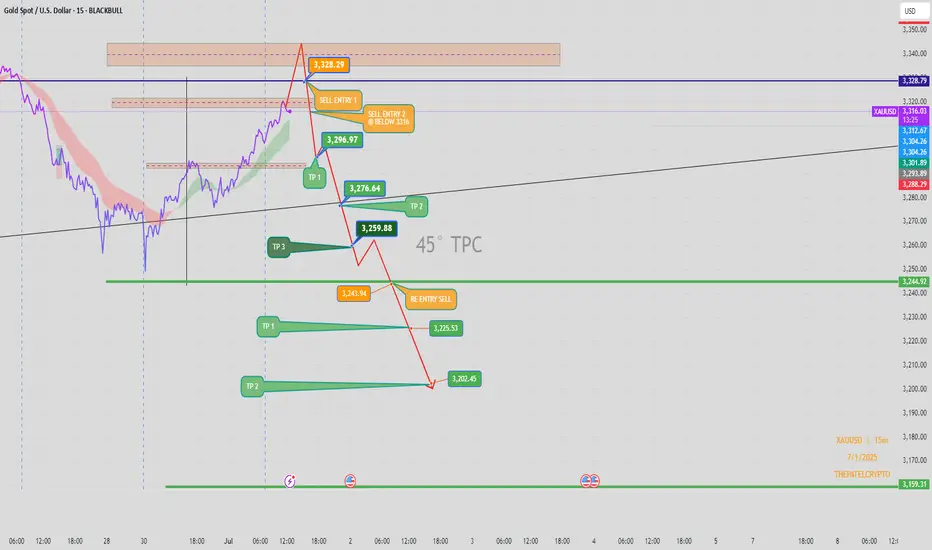
XAUUSD 15min – Bearish Setup | Short Trade Plan Below 3328Price action on Gold (XAUUSD) is showing signs of exhaustion near the 3,328 resistance zone, where we anticipate potential bearish rejection. A short opportunity may unfold once confirmation occurs below the key structural level of 3316.
Sell Trade Setup:
🔹 Primary Entry (Sell Entry 1):
📍 Zone: Around 3,328.29
📌 Reaction expected near major supply & resistance zone.
🔹 Confirmation Entry (Sell Entry 2):
📍 Below 3,316
📌 Break below structure may trigger bearish momentum.
Targets:
🎯 TP 1: 3,296.97 (Initial reaction zone)
🎯 TP 2: 3,276.64 (Mid support/EMA cross zone)
🎯 TP 3: 3,259.88 (Key structural support)
🎯 Extended TP:
3,243.94 (Re-entry confirmation level)
3,225.53 (Prior base structure)
3,202.45 (Final target if strong momentum follows)
3,159.31 (Ultimate low if sellers dominate trend)
Re-Entry Plan:
🔄 If price retraces after TP 3, watch for rejection at 3,243.94 to re-enter short toward the next levels.
Confluence Factors:
✔ 45° TPC angle supports bearish path
✔ Structure break expected below 3316
✔ EMA resistance and trendline rejection from upper zone
✔ Volatility cluster observed near 3,328 – ideal for trap setup
Bias:
Bearish below 3,316 – Expecting a downward continuation if structure confirms breakdown.
Author:
📅 1 July 2025
📊 Chart: XAUUSD – 15min
🧠 Shared by: @THEPATELCRYPTO
wareerti stock Cup and handle Wareerti formed a cup and handle pattern and also broke out; now it’s retesting. At this price, an entry can be made with a small stop loss — check it out and do your own analysis at your own risk. My analysis is mostly wrong anyway."
Entry kab avoid karein:
Agar retest zone par repeatedly price sustain nahi kar raha.
Retest par bhi selling pressure high ho raha hai (volume high).
Market sentiment overall bearish ho.
cup and handle breakout retest entry
Retest price: Retest ideally breakout level ke aas-paas ya thoda upar hota hai. Agar retest bahut deep chala gaya (cup ki midpoint ya handle ke bottom tak), toh setup weak ho jata hai.
Volume confirmation: Breakout par volume high hona chahiye, aur retest par volume kam hona chahiye.
Price action: Retest par bullish candle, hammer, bullish engulfing ya koi bhi strong reversal candle milti hai toh aur confirmation milta hai.
Stop-loss: Retest low ke thoda niche ya handle ke low ke niche (as per risk appetite).

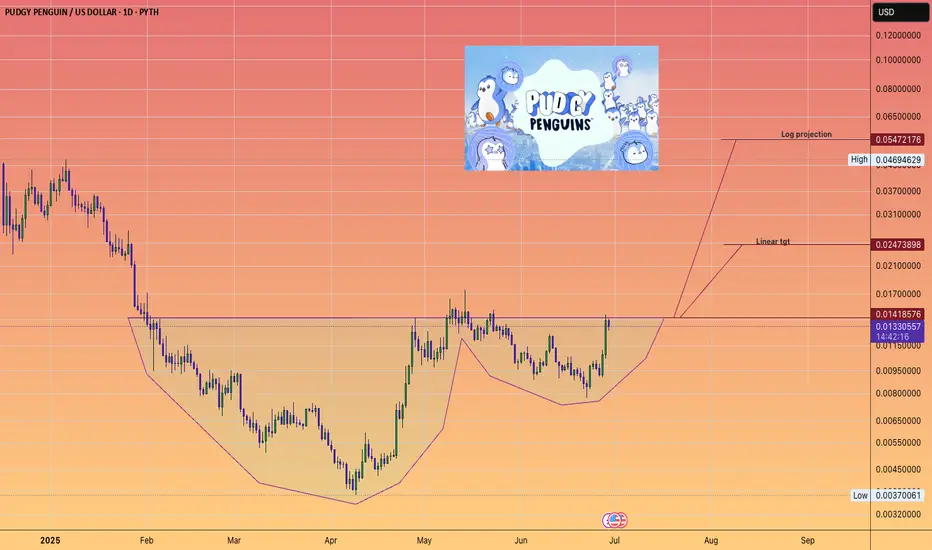
Can Penguins Fly?Pudgy Penguins #Pengu is up nicely already 3.6X from it's april low.
And is sitting nicely outside the top 100 CMC list and is the 8th biggest Memecoin by marketcap.
It appears it is on the cusp of a cup and handle breakout and projects to a very high flying 5 cent log projection.
(#Crypto's are highly speculative and can go down -99%)
ICICI LOMBARDOn the verge of giving breakout of cup and handle pattern. If volume supports the breakout, it will shoot up in no time.

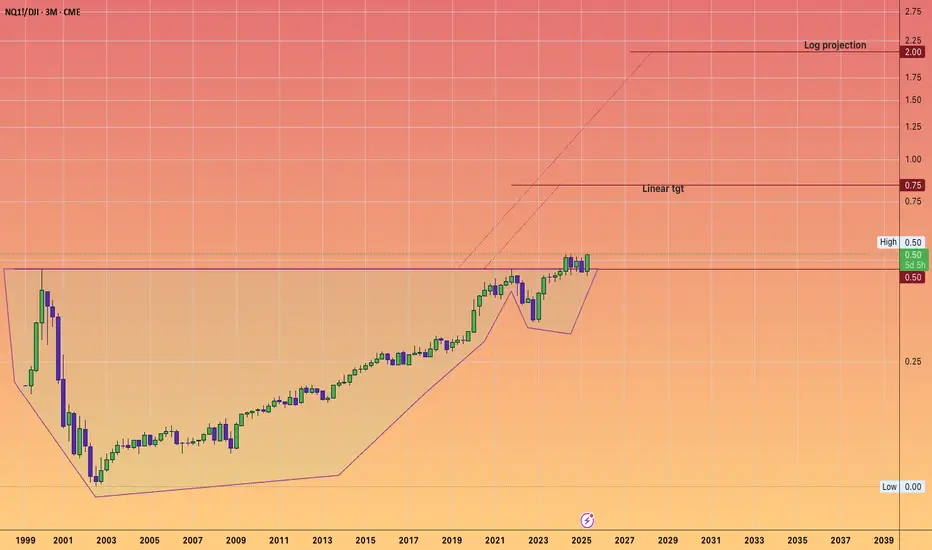
In the 2030's The Nasdaq 100 to 2X the Dow Jones.#CupandHandle don't fight the trend.
Technology vs Industrials.
AI
Robotics
Space Economy
Biotech
Artificial Super Intelligence to power GDP to insane levels.
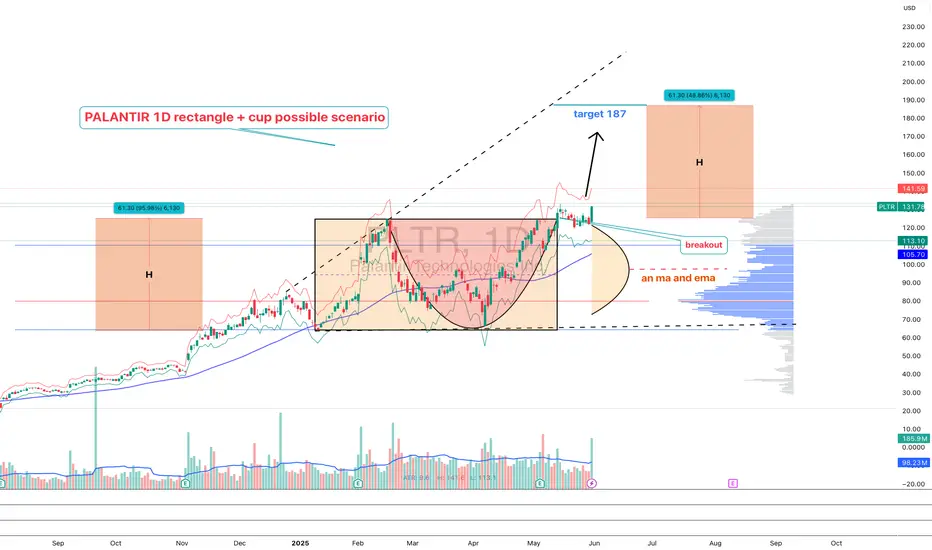
PLTR 1D — When the tea is brewed and the handle’s in placePalantir’s daily chart is shaping up a textbook cup with handle pattern — one of the most reliable continuation setups in technical analysis. The cup base was formed over several months and transitioned into a consolidation phase, building a rectangle structure where smart money likely accumulated positions before a breakout.
Now here’s the key: price has not only broken out — it’s settled above all major moving averages, including EMA 20/50/100/200 and MA 50/200. The breakout candle was supported by surging volume, signaling strong participation from institutional buyers. When all the averages start bending upwards, it's usually not by accident.
The breakout above the $121 resistance zone unlocked a pathway toward a target at $187 , derived by projecting the height of the cup upward from the breakout level. This kind of structure, once confirmed, often fuels aggressive continuation — and this one’s got the setup locked in.
From a fundamental perspective, Palantir is holding solid ground: strong earnings reports, expanding government and commercial contracts, and aggressive development in AI services. Institutional interest is rising steadily, and that momentum is visibly reflected in price action.
To sum it up: price has launched cleanly out of the consolidation zone, pierced all critical MAs and EMAs, and continues to gain momentum. While the market sips its tea, this cup is boiling hot. Just don’t forget your stop loss — this is a trading desk, not a tea party.
If you enjoy posts like this, drop a like, share it around, and let’s hear your thoughts below. It keeps ideas moving and the content flowing — free, sharp, and relevant.
EURCAD Forms Cup FormationThe EURCAD rally, driven by a strong euro and a weak Canadian dollar, has created an impressive chart setup. A cup formation has developed just below the 1.5960 resistance level. Whether this pattern will be completed with a handle remains unclear at this stage.
If a handle forms, the 78.6% retracement level could serve as a reasonable downside target. In the short term, the 50-hour EMA is supporting the trend and can be watched as key support.
If EURCAD breaks above 1.5960 and confirms the cup formation, the medium-term target for the pattern could reach as high as 1.6440.

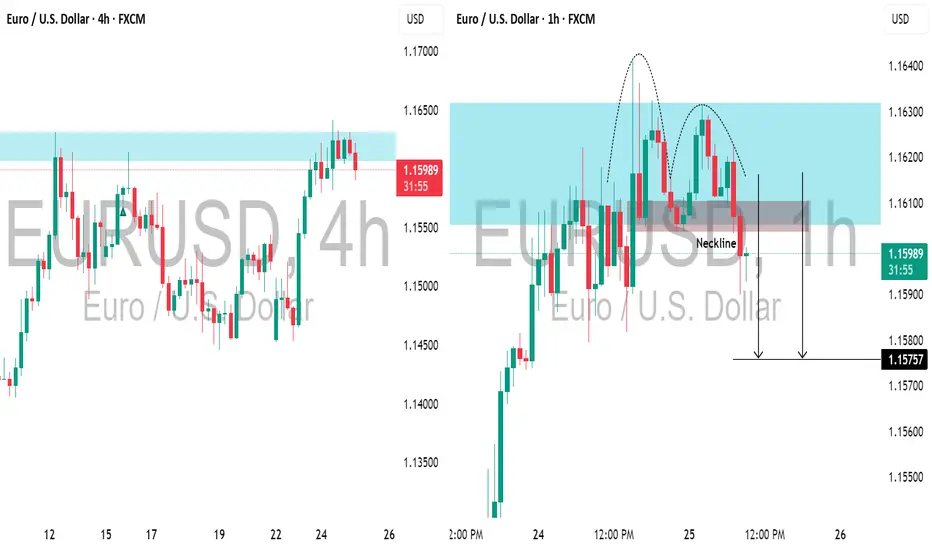
EURUSD: Pullback From Resistance Confirmed📉 The EURUSD could retreat from the highlighted resistance today.
I've identified a cup and handle pattern following a test of significant intraday resistance and a breach of its neckline, accompanied by strong bearish momentum.
Target - 1.1575.
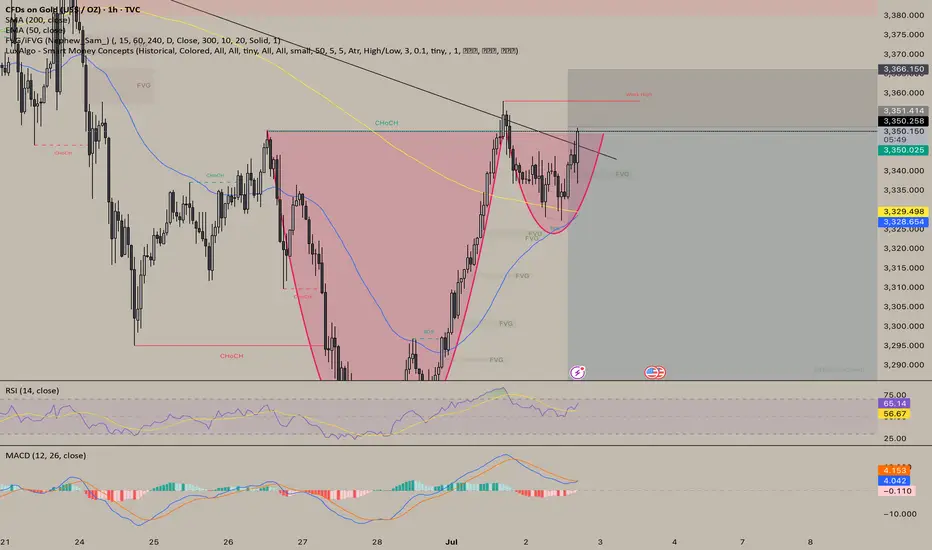
Gold Trend Still In TactPotential cup and handle formation as it the trend works into the bottom of the handle. Still think this comes back into play as the "big beautiful bill" comes back into focus and national debt is a topic of concern.