Cup And Handle

Time to pour coffee in the cupBreakout of cup and handle pattern with huge green candles and great volume on monthly timeframe. Breakout in monthly timeframe assures the sustainability post breakout.
Cup & handle Breakout - RPOWERCurrent Price: ₹71
Technical Analysis:
Cup & Handle Breakout Pattern: The provided chart for RPOWER shows a pattern that resembles a Cup & Handle, and it appears to be currently breaking out or is near a breakout point.
Waiting for Confirmation: Your statement "Waiting for confirmation" is crucial. A confirmed breakout typically involves the price sustaining above the resistance level with strong trading volume.
Immediate Target: Multibagger stock. This is an ambitious long-term target, implying a significant increase from the current price.
Time Frame: 3 to 6 Years. This suggests a long-term investment horizon.
Fundamental Analysis :
Sales (Revenue from Operations): Sales have been volatile over the years. They peaked at ₹10,396 Cr. in Mar 2017, declined to ₹7,562 Cr in Mar 2020, and then recovered to ₹7,583 Cr in Mar 2025.
Operating Profit: Fluctuating, reaching a high of ₹4,506 Cr in Mar 2017 and a low of -₹2,823 Cr in Mar 2020. It has recovered to ₹2,108 Cr in Mar 2025.
Net Profit: The company reported significant losses from Mar 2020 (-₹2,952 Cr) to Mar 2023 (-₹4,068 Cr). Crucially, Reliance Power has reported a positive Net Profit of ₹2,948 Cr in Mar 2025. This marks a significant turnaround from previous years' losses.
EPS in Rs.: Corresponding to the net profit, EPS was negative from Mar 2020 to Mar 2023, but turned positive at ₹9.34 in Mar 2025.
Compounded Sales Growth: TTM: -4%. 3 Years: 0%. 5 Years: -7%. 10 Years: 1%. This indicates recent flat to declining sales growth, despite the recent profit recovery.
Compounded Profit Growth: TTM: 91%. 3 Years: 22%. 5 Years: 7%. 10 Years: %. The TTM and 3-year profit growth figures are very strong, largely due to the turnaround from losses to profit.
Return on Equity (ROE): Last Year: 0%. 3 Years: -10%. 5 Years: -7%. 10 Years: -1%. Despite the recent net profit, the compounded ROE remains negative, which suggests that the company is still grappling with past accumulated losses impacting equity.
Key Fundamental Observations:
Turnaround in Profitability: The most significant fundamental development is the sharp turnaround from consistent losses to a substantial positive Net Profit of ₹2,948 Cr and a positive EPS of ₹9.34 in March 2025.
Valuation: Based on the current price of ₹71 and the FY25 EPS of ₹9.34, the trailing P/E ratio would be approximately 7.6. This is a very low P/E if the profit is sustainable and represents a significant re-rating opportunity if the turnaround holds.
Debt: While not explicitly detailed in the provided images, Reliance Power has historically carried a high debt load. The recent profit might be linked to debt restructuring or asset sales, which could significantly improve its financial health.
Sales Growth: Despite the strong profit recovery, the compounded sales growth figures for the last 1, 3, and 5 years are negative or flat, indicating that the profit recovery might be driven more by cost efficiencies, debt reduction, or non-operating income rather than core revenue expansion.
Corporate Actions & Latest News:
News related to RPOWER would predominantly focus on its financial restructuring efforts, debt resolution, asset sales, and the operational performance of its power plants. The recent positive financial results would be a major highlight. Any new power projects or significant Power Purchase Agreements (PPAs) would also be key news.
Order Book: For a power generation company, the "order book" primarily refers to its Power Purchase Agreements (PPAs). The stability and duration of these agreements are crucial for revenue visibility.
Overall Assessment & Viability of Target:
The technical Cup & Handle breakout pattern is generally bullish, and the recent shift to profitability is a major positive fundamental development for Reliance Power. The low P/E ratio, based on the latest EPS, could indicate that the market has not yet fully priced in the turnaround.
However, the "Multibagger" target within 3-6 years is still highly aggressive and depends on several critical factors:
Sustainability of Profitability: The company must demonstrate consistent and growing profits over multiple quarters and years, proving that the Mar 2025 profit is not a one-off event.
Debt Management: Continued success in reducing and managing its historical debt burden is crucial.
Core Business Growth: Improving sales growth in addition to profit growth will be vital for a sustained upward trajectory.
Market Re-rating: The market needs to be convinced of the long-term viability and growth prospects to assign a higher valuation multiple.
While the current technical and recent fundamental data show promise, the "Multibagger" target requires an exceptional and sustained turnaround in all aspects of the business.
Disclaimer: This analysis is for informational purposes only and does not constitute investment advice. Investing in turnaround stories and highly volatile stocks carries significant risks, and considerable capital loss is possible. Always conduct your own exhaustive research, assess the company's current and future financial viability, understand all associated risks, and consult with a qualified financial advisor before making any investment decisions.
Good to go longPlease do your own analysis and maintain your risk reward ratio.
This is only for the educational purposes
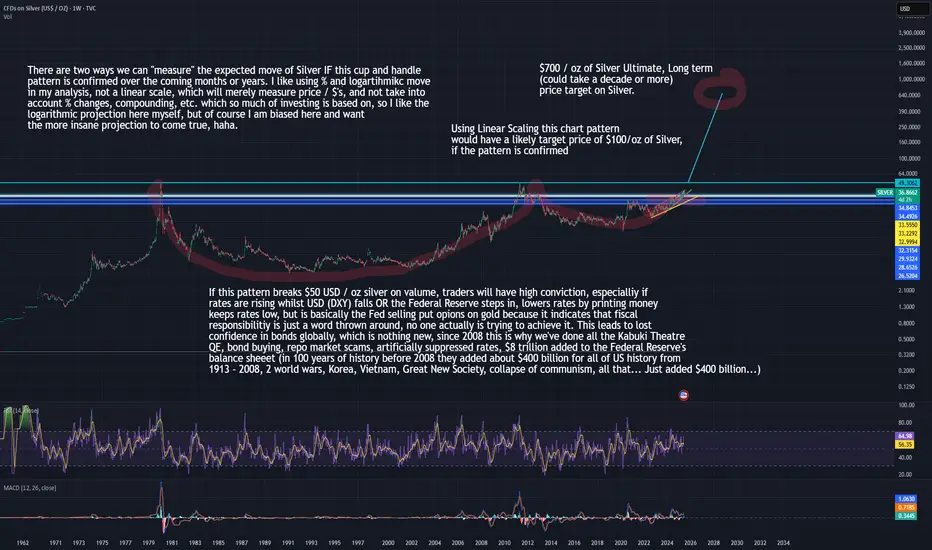
A Logarithmic Projection of Silver's LONG TERM Cup and HandleSilver is perhaps one of the most under-valued assets of our time, with bubbles ragining in almost all asset classes, poor lowly silver is sitting well below historical fair value, when priced in gold. But The Gold Silver Ratio being at such extremes does not mean Silver will rise, it is indeed possible for Gold to collapse and for Silver to merely hold steady-ish, and the gold silver ratio would be back in-sync.
What makes this particular time of such undervaluations in Silver so interesting, is that on long term time frames we see some extrenely powerful chart patterns that have been shaping up for 50 years or so. It is a Bullish Cup and Handle Pattern and we're currently drawing in what could be the last few months of the handle and if we confirm this pattern, chartists would give price targets between $90 on the low end and $700 on the high end. I've show the reasons for both extremes below. Reality, likely, will wind up being somewhere between both camps (if we do confirm the pattern) and someone will get cheeky with some Fibs and say they saw the top coming all along, or something, lol.
Historically Silver has pulled back HARSHLY after these moves, as much as 80-90%, however that was when the USD still had a very high likelihood of remaining the world resere currency still moving forward. If this happens, this time that won't look so certain, but I would still expect major volatility once a top is found and a pretty wide trading range to form.
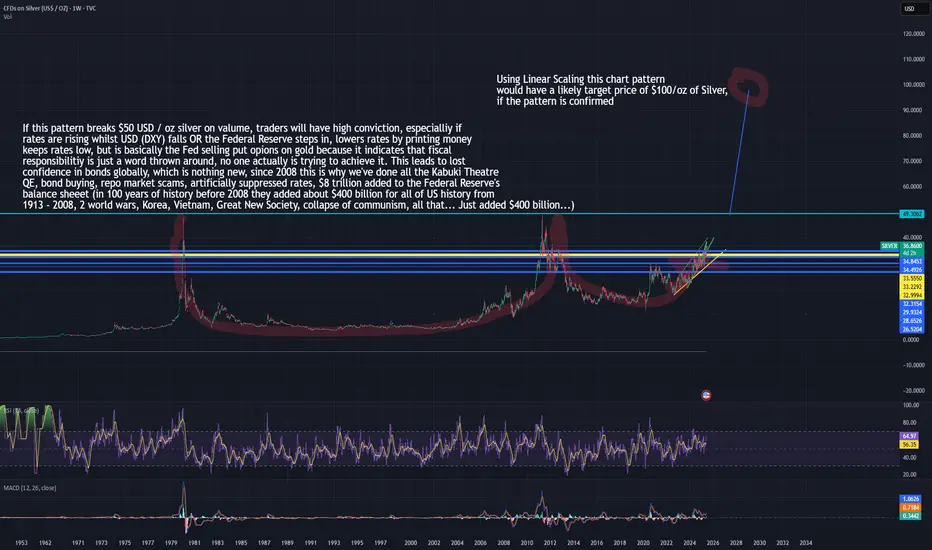
Linear Projection for Silver LONG TERM Cup and Handle Pattern.Silver is perhaps one of the most under-valued assets of our time, with bubbles ragining in almost all asset classes, poor lowly silver is sitting well below historical fair value, when priced in gold. But The Gold Silver Ratio being at such extremes does not mean Silver will rise, it is indeed possible for Gold to collapse and for Silver to merely hold steady-ish, and the gold silver ratio would be back in-sync.
What makes this particular time of such undervaluations in Silver so interesting, is that on long term time frames we see some extrenely powerful chart patterns that have been shaping up for 50 years or so. It is a Bullish Cup and Handle Pattern and we're currently drawing in what could be the last few months of the handle and if we confirm this pattern, chartists would give price targets between $90 on the low end and $700 on the high end. I've show the reasons for both extremes below. Reality, likely, will wind up being somewhere between both camps (if we do confirm the pattern) and someone will get cheeky with some Fibs and say they saw the top coming all along, or something, lol.
Historically Silver has pulled back HARSHLY after these moves, as much as 80-90%, however that was when the USD still had a very high likelihood of remaining the world resere currency still moving forward. If this happens, this time that won't look so certain, but I would still expect major volatility once a top is found and a pretty wide trading range to form.
We expect governments to continue to devalue their currencies, deficit spend, take part in QE programs and other monetary tricks to inflate away the debate. They won't actually inflate it away, of course, it'll just become a more enormous monster, but that's another administration/generation's issue to deal with!
Bullish ideaFormed cup and handle at all time high sign can make profits. Make sure to check one more bullish pattern for double confirmation and. Check volume at breakout time. This is only for the educational purposes.
Bitcoin to 168K Cup&HandleI'm seeing a cup and handle formation.
From 109K January 2025 to 111K May 2025.
The handle is healthy correcting to around 33% of the cup depth to 100K.
If this is correct I would expect Bitcoin to reach around 169K within the next 6 months.

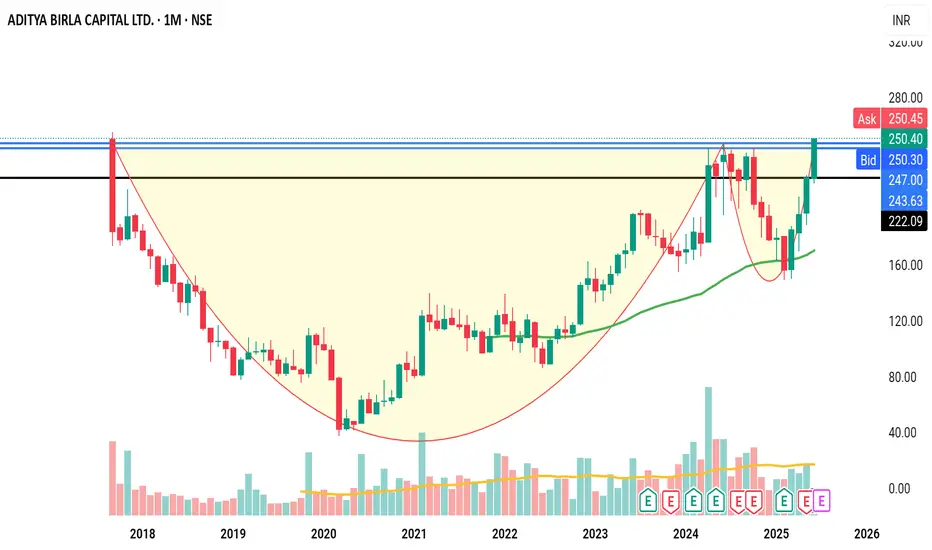
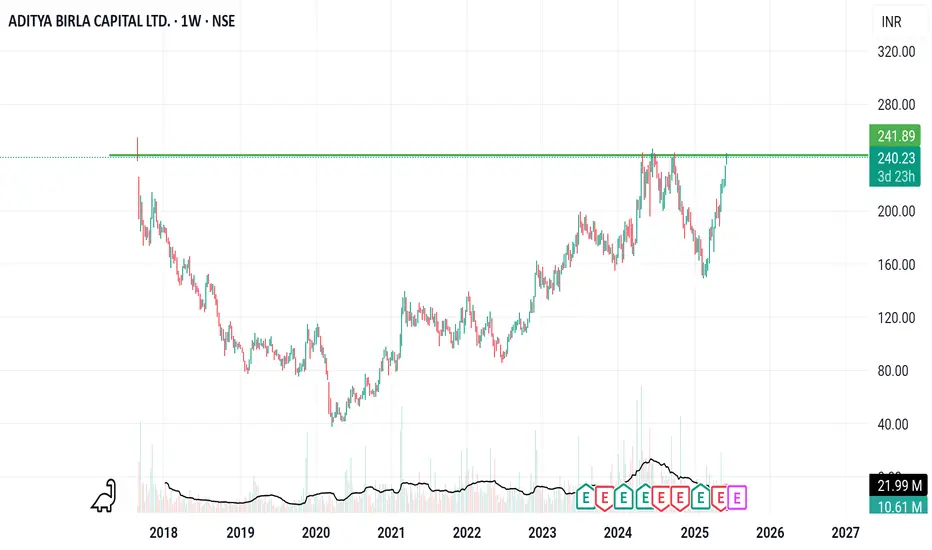
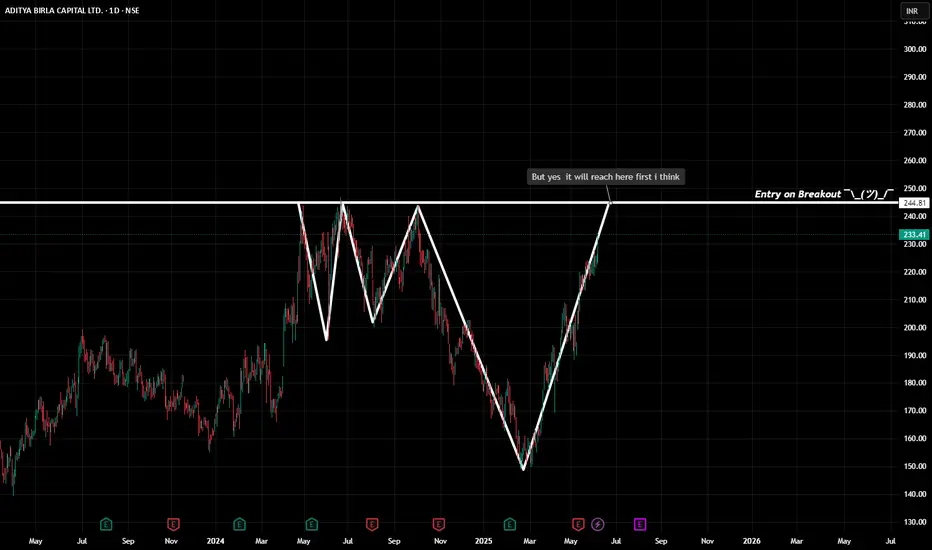
Cup with handle forming or an inverse head and shoulder formingAB Capital has formed either a cup with handle (almost :|) or is trying to make an inverse head shoulder with two shoulders.
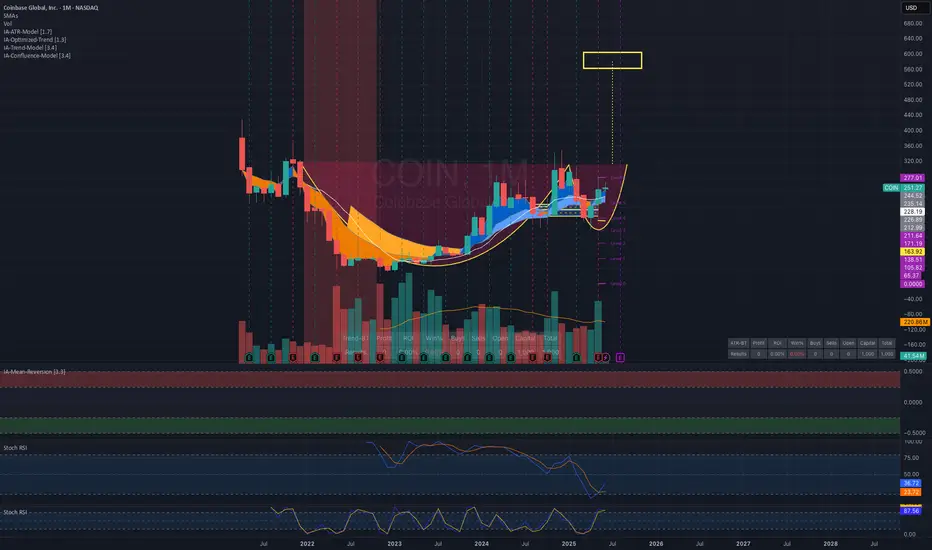
Cup and handle on COIN 500+ targetAs most companies after IPO, we got the drop and now the bouce, forming a cup and handle, if it keeps to break it we should see COIN above the $500+ in coming months. This aligns with Bitcoin expected rally.
Not financial advice, just a hobby.
ETH Bullish | Inverse H&S | Cup and Handle PatternEthereum is still dragging its feet towards a new ATH, or at least, towards a high. But there are some positive signs showing up on the chart.
Make sure to check out yesterday's update on Bitcoin:
____________________________
BINANCE:ETHUSDT

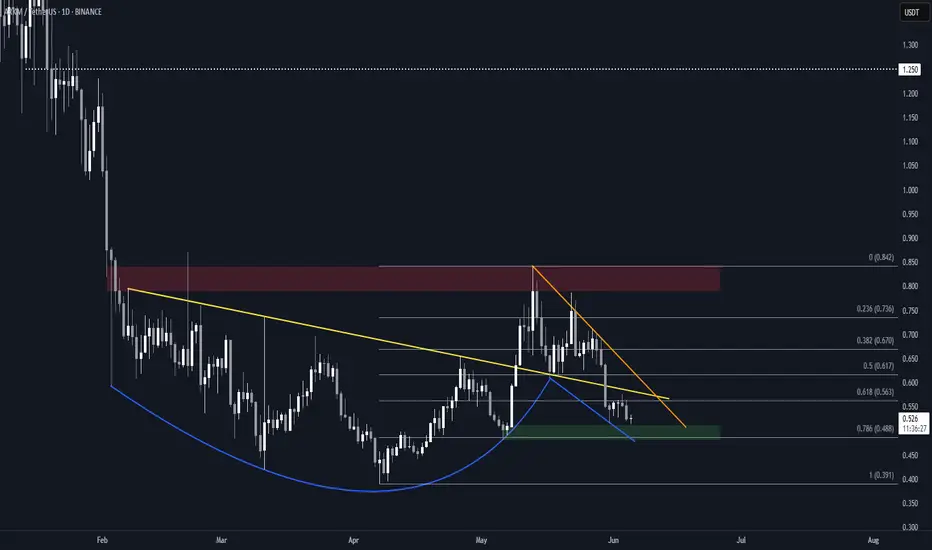
Arkham (ARKM) Structure Analysis (1D)Interesting chart for BINANCE:ARKMUSDT
Apologies for the trendlines mess, but they're all potentially relevant.
Watch for
• Bounce at ~$0.49 (0.786 Fib)
• Break above the yellow and orange resistance trendlines (~$0.57)
These conditions could form a Cup & Handle pattern and lead to a retest of the $0.80-$0.85 supply zone.
If that it broken, it could set the next target to ~$1.25.
Lemonade may be ready for a squeezeNYSE:LMND broke dramatically into overbought territory on the weekly chart earlier this year. It's taken understandable time to digest those gains and now looks like it could be building steam to revisit prices reached during that breakout.
The shorter term 4H chart, more suitable for entry and exit signals, illustrates a recent break above a cup and handle formation. That little pump appears to be consolidating rapidly.
Should the shorter term move find traction, the the weekly chart could provide a reasonable target as a trading range is formed for a larger move in the long run. A swing trade looks attractive at this point with potential 50% upside.

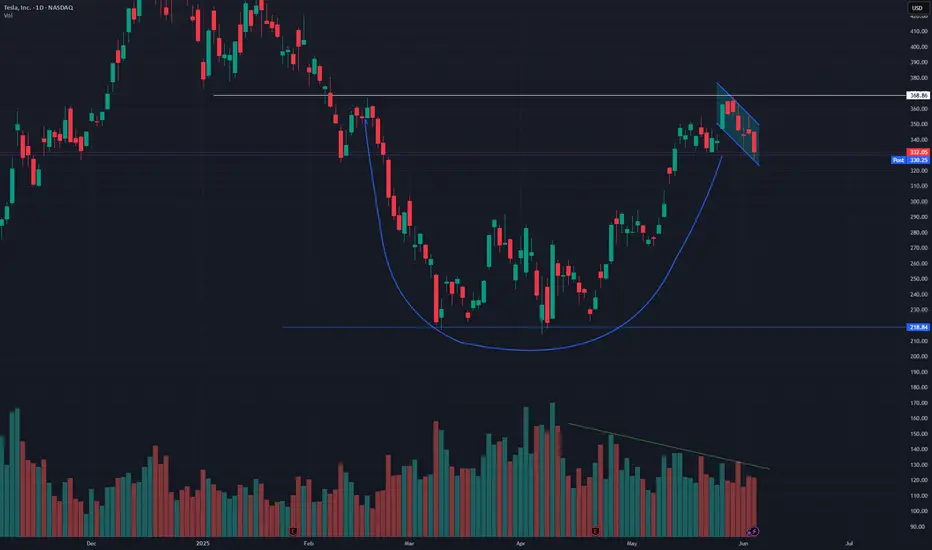
TSLA: Continues to form a Cup and Handle reversal patternHey folks,
Just a quick analysis of NASDAQ:TSLA on the daily chart. Compared to my last analysis, price has fallen a bit since, as a new flag (handle) continues to form following a cup pattern.
- Cup and Handle pattern forming. The handle would also count as a bull flag. This is known as
a cup and handle reversal pattern, after a downtrend. So yes, it is possible for a stock to
reverse its trend through the formation of a cup and handle reversal pattern (as you can see
in the chart).
- Major resistance at $366 which marks the peak of the flag (handle) pattern. This would have
to be broken in order for the cup and handle to be valid.
- Volume has also been decreasing during the formation of this pattern: this is typical amongst
Cup and Handle patterns, and generally a positive sign.
Note: Not financial advice.
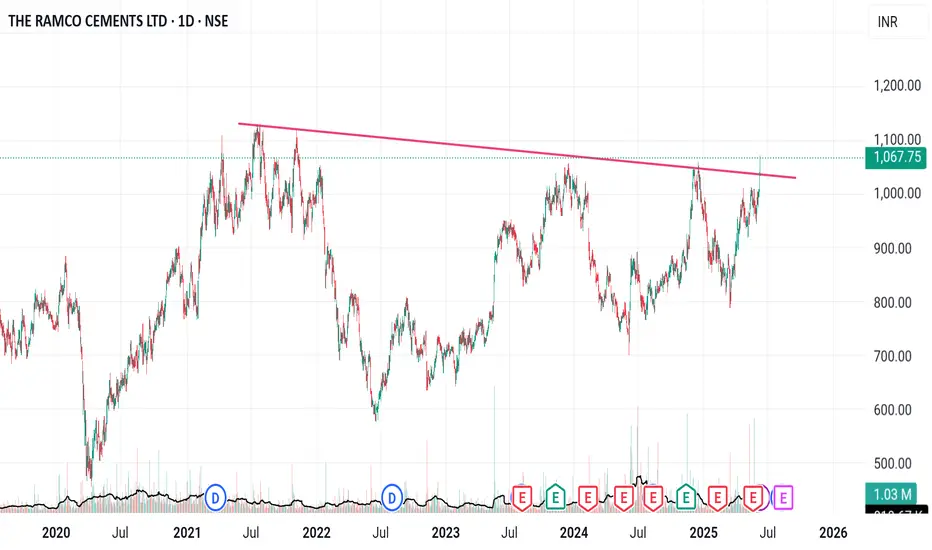
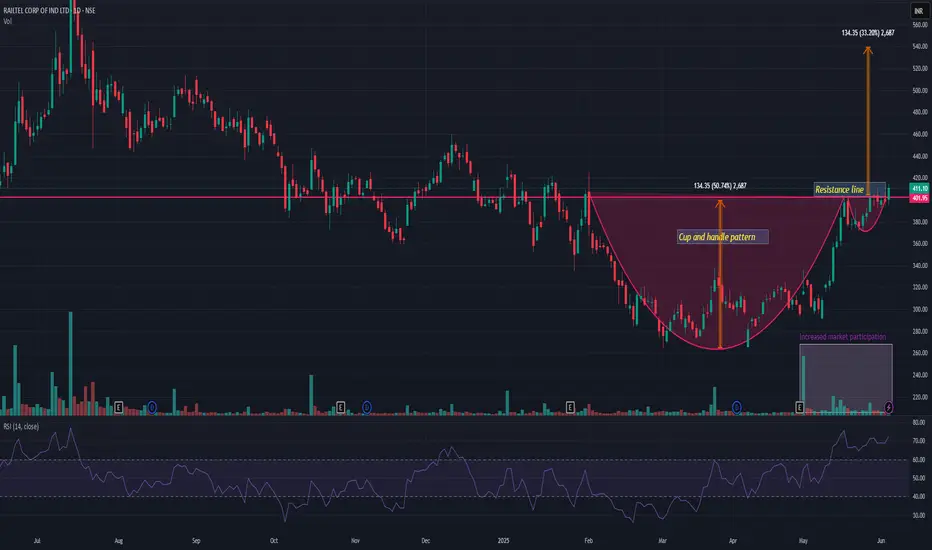
RAILTELRAILTEL showing very good strength and currently trading above resistance line. It has also been observed cup and handle pattern breakout with decent increased volume in recent days. If I consider recent depth then we may see approx 30-33% rally in coming days provided that it holds and closing above 380 levels all the time. Strong up move is on the table!
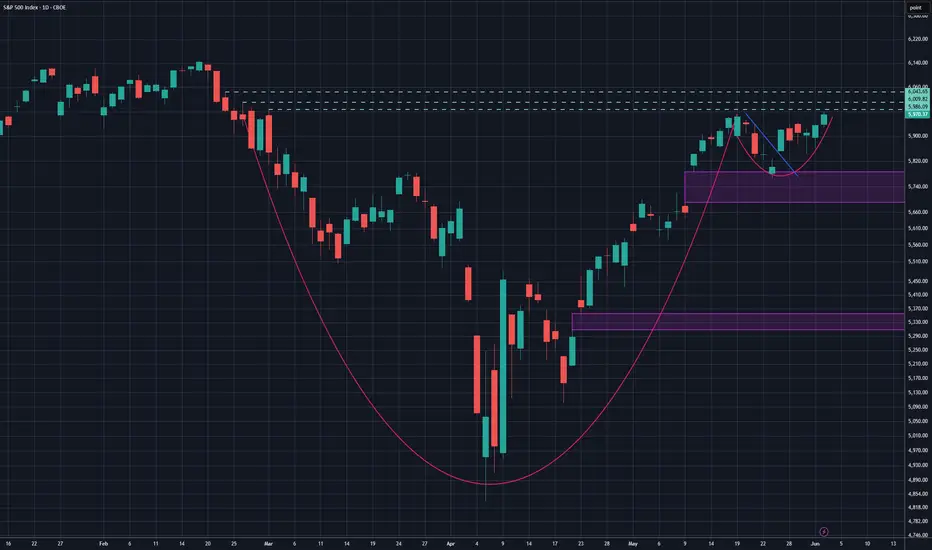
Something Brewing on SPXCup and handle brewing on the SPX daily. All time highs are near. See you there before the pullback
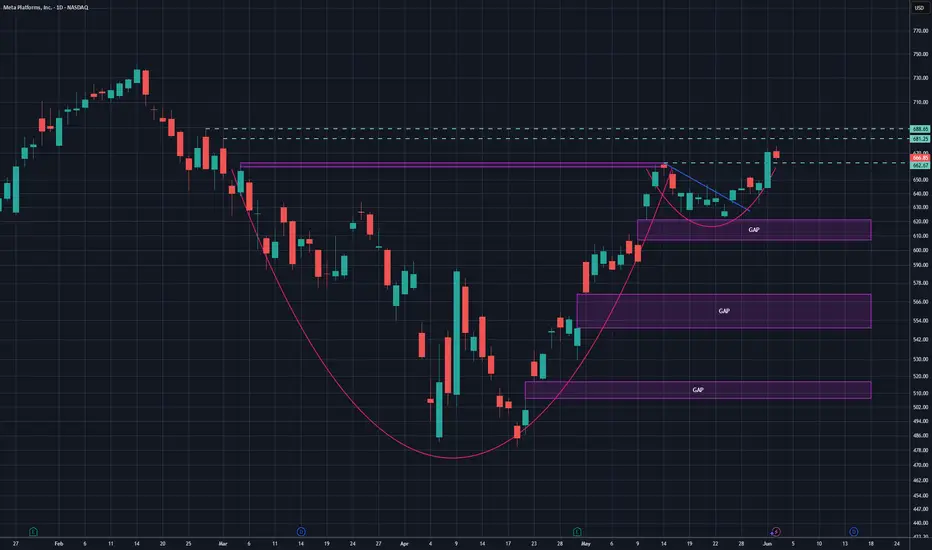
META cup and handle breakout retestMETA daily cup and handle broke out and is trading to a retest of the breakout level at ~662. A hold over 661~663 area confirms the breakout and would be a good location to add longs. The proper measured move would put the price target far past the ATH in the 900s, which I think is a bit excessive in the short term given the current economic and geopolitical climate. My price targets are a bit more conservative, with the first PT at 681.25 and a secondary PT at 688.65.
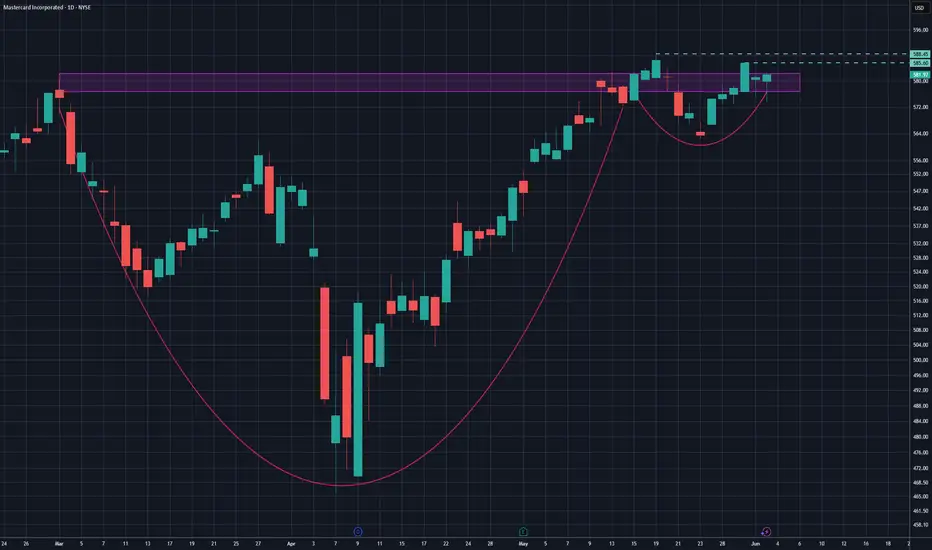
MA another financial cup and handleMastercard is another name in the financial sector that is showing a cup and handle formation on the daily chart. Two price targets to break at $585.60 and the ATH of $588.45 and it's off to new highs.
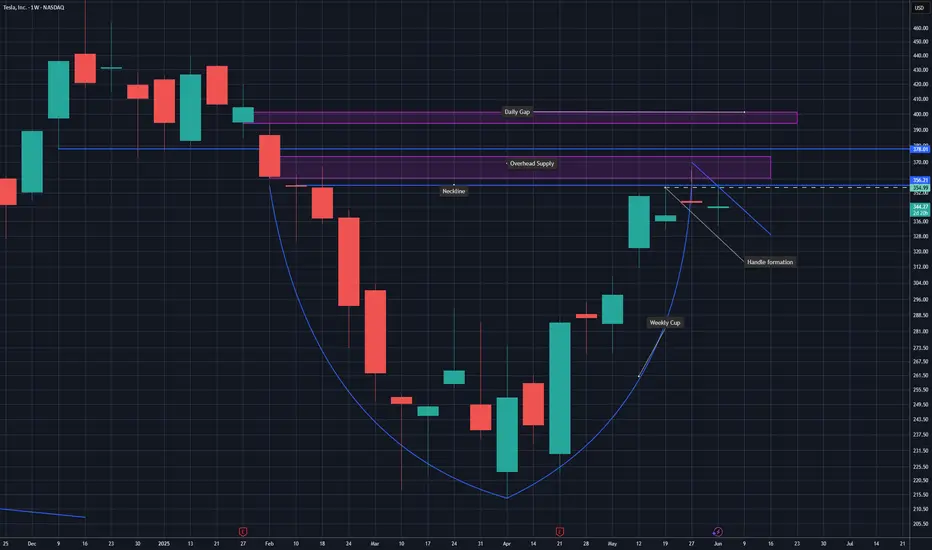
TSLA weekly cup and handleNASDAQ:TSLA
Last week, the daily chart on TSLA showed a cup and handle formation. Price attempted to break up but rejected overhead supply in the 360s. Price action is starting to show the formation of a handle on the weekly chart that may present a stronger move in the coming weeks to break through the 360 resistance level and overhead supply. June tends to be a strong month for TSLA historically, so the move could happen by the end of the month. Strong break of 360 and a close over to confirm a projected movement to $400 as a first price target, with $420.69 as a secondary PT.
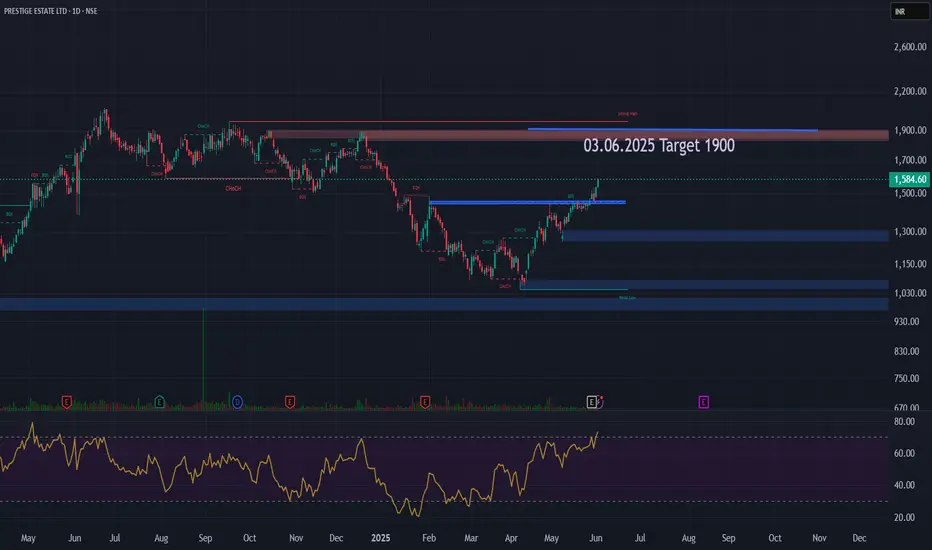
Cup & Handle Breakout - PRESTIGECurrent Price: ₹1,584.60
Technical Analysis:
Cup & Handle Breakout Pattern: The provided chart shows a potential Cup & Handle pattern, with the price breaking out above a resistance level. A confirmed breakout with strong volume is typically a bullish signal. The chart also indicates a "Strong High" marked near ₹1,900.
Immediate Target: ₹1,900
Time Frame: 3 to 6 months.
Fundamental Analysis:
Market Cap: ₹68,189 Cr.
Current Price: ₹1,585
Stock P/E: 146 (Extremely high, indicating very high growth expectations are priced in or low recent earnings.)
Book Value: ₹358
Dividend Yield: 0.11%
ROCE: 7.69% (Relatively low for a company with such a high P/E.)
ROE: 3.50% (Very low return on equity, especially considering the high P/E.)
Face Value: ₹10.0
High / Low (52-week): ₹2,075 / ₹1,048
Shareholding Pattern (as of March 2025):
Promoters: Decreased stake from 70.00% (Mar 2017) to 60.95% (Mar 2025).
FIIs: Fluctuating, currently at 17.08% (Mar 2025) from 24.43% (Mar 2017).
DIIs: Consistently increased stake from 4.41% (Mar 2017) to 19.23% (Mar 2025). This is a strong positive signal.
Public: Currently at 2.74% (Mar 2025).
No. of Shareholders: Significantly increased from 11,656 (Mar 2017) to 1,68,033 (Mar 2025), indicating rising retail interest.
Recent Performance: Prestige Estates, being a prominent real estate developer, would have its financial performance tied to property sales, project completions, and new project launches. Recent results for real estate companies in India have generally been positive due to robust housing demand.
EPS: Given the P/E of 146, the EPS (Earnings Per Share) would likely be very low. For example, if P/E is 146 and Current Price is ₹1585, then EPS = ₹1585 / 146 ≈ ₹10.85. This suggests that earnings are currently quite low relative to the stock price.
Corporate Actions:
Real estate companies often engage in corporate actions like fundraising (QIPs, preferential allotments) to fund new projects, joint ventures, or acquisitions of land parcels. Dividend payouts are also common.
Any announcements regarding new project launches, significant sales bookings, or progress on existing projects would be key corporate actions.
Company Order Book / Sales Pipeline:
For real estate companies, the "order book" is typically represented by sales bookings for ongoing and upcoming projects, and the development pipeline of future projects. Higher sales bookings and a strong pipeline indicate future revenue visibility.
Latest News:
Recent news for Prestige Estates would likely focus on:
Q4 FY25 and FY25 financial results: The market would be keenly watching their earnings for any justification of the high valuation.
Sales Performance: Updates on property sales, new launches, and project completions.
Expansion Plans: Announcements of new land acquisitions or expansion into new cities/segments.
Analyst Reports: Brokerage reports on their performance and outlook.
Overall Assessment:
Prestige Estates Projects Ltd. presents a mixed but potentially bullish outlook, driven by strong technicals and positive industry trends, but tempered by a very high valuation:
Bullish Technicals: The identified Cup & Handle breakout is a strong bullish pattern, indicating potential upward momentum. The target of ₹1,900 seems to align with a "Strong high" level on the chart.
Strong DII Confidence: The continuous increase in DIIs' stake and the significant rise in the number of shareholders indicate growing domestic institutional and retail confidence in the company.
Industry Tailwinds: The real estate sector in India has been witnessing robust demand, which benefits established players like Prestige.
High Valuation (P/E 146): This is the most significant fundamental concern. A P/E of 146 implies that the market is expecting exceptionally high earnings growth in the future. The current ROE (3.50%) and ROCE (7.69%) are quite low for such a high valuation, indicating that current profitability doesn't justify the price, but future growth potential is being heavily discounted. Investors are clearly betting on aggressive future expansion and profitability.
Conclusion:
The technical setup for Prestige Estates Projects Ltd. appears bullish with the Cup & Handle breakout, and the immediate target of ₹1,900 seems technically plausible within the 3-6 month timeframe. The increasing DII holding also provides confidence. However, the extremely high P/E ratio of 146 suggests that a significant amount of future growth is already priced into the stock. For the stock to sustain this rally and potentially move beyond, the company must deliver exceptionally strong sales bookings, project completions, and, most importantly, a substantial increase in its earnings per share in the coming quarters to fundamentally support its premium valuation.
Disclaimer: This analysis is for informational purposes only and does not constitute investment advice. Investing in stocks with very high P/E ratios carries elevated risks. Always conduct your own thorough research, carefully analyze the stock chart, assess your risk tolerance, and consult with a qualified financial advisor before making any investment decisions. The stock market carries inherent risks.
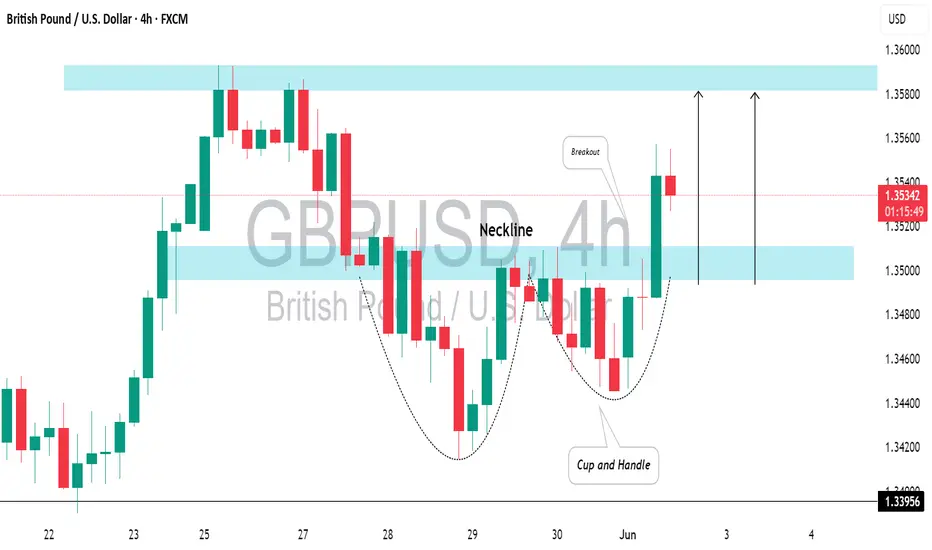
GBPUSD: Important Breakout📈GBPUSD has surpassed and closed above a crucial intraday horizontal resistance level.
The highlighted blue region represents the neckline of a cup and handle pattern.
This breakout suggests further upward movement.
The next resistance level is at 1.3580.
Cup and handle pattern Retesting the cup and handle pattern.
Good to go long in it.
Educational purposes only.
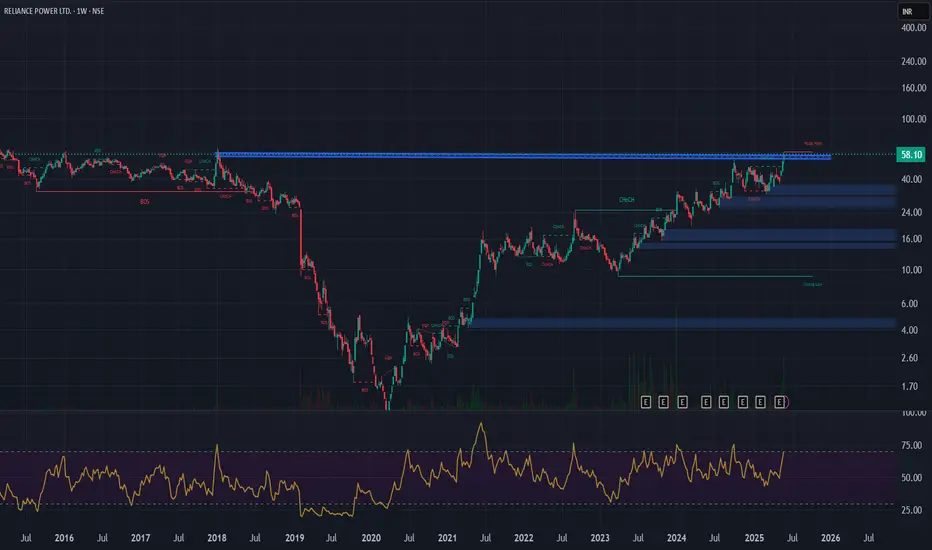
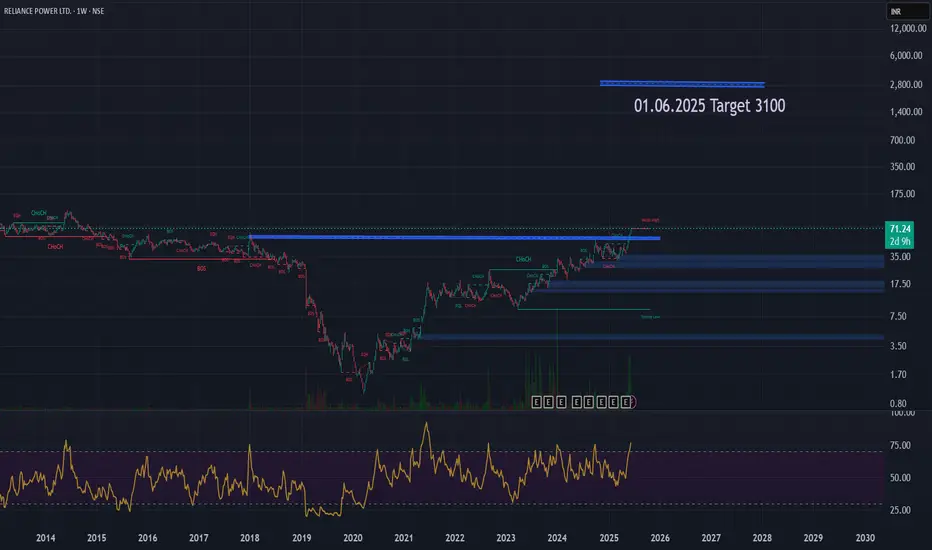
Cup & handle Breakout - RPOWERCurrent Price: ₹58.10
Technical Analysis:
Cup & Handle Breakout Pattern: The provided chart for RPOWER shows a pattern that resembles a Cup & Handle, with a recent breakout above the resistance level around ₹58.10. A confirmed breakout with strong volume is typically a bullish signal.
Target: ₹3100
Time Frame: 3 to 6 Years. This is an extremely ambitious long-term target, implying a massive increase from the current price.
Fundamental Analysis :
Sales (Revenue from Operations): Sales have been volatile over the years, with a peak in Mar 2017 at ₹10,396 Cr., declining to ₹7,562 Cr in Mar 2020, and then showing a recovery to ₹7,583 Cr in Mar 2025.
Operating Profit: Fluctuating, reaching a high of ₹4,506 Cr in Mar 2017 and a low of -₹2,823 Cr in Mar 2020. It has recovered to ₹2,108 Cr in Mar 2025.
Net Profit: The company has reported significant losses for several years. It posted substantial net losses from Mar 2020 (-₹2,952 Cr) to Mar 2023 (-₹4,068 Cr). Crucially, Reliance Power has reported a positive Net Profit of ₹2,948 Cr in Mar 2025. This marks a significant turnaround from previous years' losses.
EPS in Rs.: Corresponding to the net profit, EPS was negative from Mar 2020 to Mar 2023, but turned positive at ₹9.34 in Mar 2025.
Compounded Sales Growth: TTM: -4%. 3 Years: 0%. 5 Years: -7%. 10 Years: 1%. This indicates recent flat to declining sales growth, despite the recent profit recovery.
Compounded Profit Growth: TTM: 91%. 3 Years: 22%. 5 Years: 7%. 10 Years: %. The TTM and 3-year profit growth figures are very strong, largely due to the turnaround from losses to profit.
Return on Equity (ROE): Last Year: 0%. 3 Years: -10%. 5 Years: -7%. 10 Years: -1%. Despite the recent net profit, the compounded ROE remains negative, which suggests that the company is still grappling with past accumulated losses impacting equity.
Key Fundamental Observations:
Turnaround in Profitability: The most significant fundamental development is the shift from consistent losses to a positive Net Profit of ₹2,948 Cr in March 2025, and a positive EPS of ₹9.34. This is a crucial change.
Debt: While not explicitly shown in the provided Profit & Loss or Shareholding Pattern images, Reliance Power has historically been burdened by high debt. The recent profit might be linked to debt restructuring or asset sales.
P/E Ratio: Given the recent positive EPS of ₹9.34 and current price of ₹58.10, the trailing P/E would be around 6.22 (58.10 / 9.34). This is very low if the profit is sustainable. However, given the negative historical EPS and the "T.T.M. Profit Growth" at 91%, the market may still be cautious about the sustainability of this newfound profitability.
Corporate Actions:
Debt Resolution: Reliance Power has been aggressively pursuing debt reduction strategies. This recent significant profit could be a result of asset monetization, debt settlements, or specific financial restructuring efforts.
Fundraising: The company has previously raised funds through various mechanisms to address its debt and financial obligations.
Company Order Book:
For a power generation company, the "order book" primarily refers to its Power Purchase Agreements (PPAs). The stability and duration of these agreements are crucial for revenue visibility. The recent profit turnaround suggests some improvements in operational performance and potentially better PPA realizations.
Latest News:
News related to RPOWER would predominantly focus on its financial restructuring efforts, debt resolution, asset sales, and the operational performance of its power plants. The recent positive financial results would be a major highlight. Any new power projects or significant PPA signings would also be key news.
Overall Assessment & Viability of Target:
The technical Cup & Handle breakout pattern is generally bullish. The most significant fundamental factor is the remarkable turnaround to a positive Net Profit and EPS in March 2025 after years of losses. This makes the company's financial health appear much stronger than before.
However, the target of ₹3100 from ₹58.10 within 3-6 years is still extremely ambitious (over 50x return). While the recent profit is a massive positive, for such a target to be credible, the company would need to:
Sustain Profitability: Demonstrate consistent, growing profits over multiple quarters and years, not just a one-off.
Continue Debt Reduction: Maintain a strong focus on further reducing its debt burden.
Improve Operational Performance: Ensure its power assets are operating efficiently and securing favorable PPAs.
Re-rate by Market: The market would need to significantly re-rate the company's valuation based on sustained growth and profitability, moving it from a 'turnaround story' to a 'growth story'.
The "Compounded Sales Growth" being negative for TTM and 3/5 years indicates that the profit growth is currently more due to cost control, debt reduction, or non-operating income/asset sales rather than core revenue expansion. For sustained profit growth, sales growth also needs to improve.
Conclusion:
The technical pattern and the very recent fundamental shift to profitability are encouraging. However, the long-term target of ₹3100 is highly aggressive and relies on the company not only sustaining its newfound profitability but also achieving exceptional, compounded growth for several years. Investors would need to carefully monitor the consistency of future profits, debt levels, and core business growth.
Disclaimer: This analysis is for informational purposes only and does not constitute investment advice. Investing in turnaround stories and highly volatile stocks carries significant risks. Always conduct your own exhaustive research, assess the company's current and future financial viability, understand all associated risks, and consult with a qualified financial advisor before making any investment decisions.