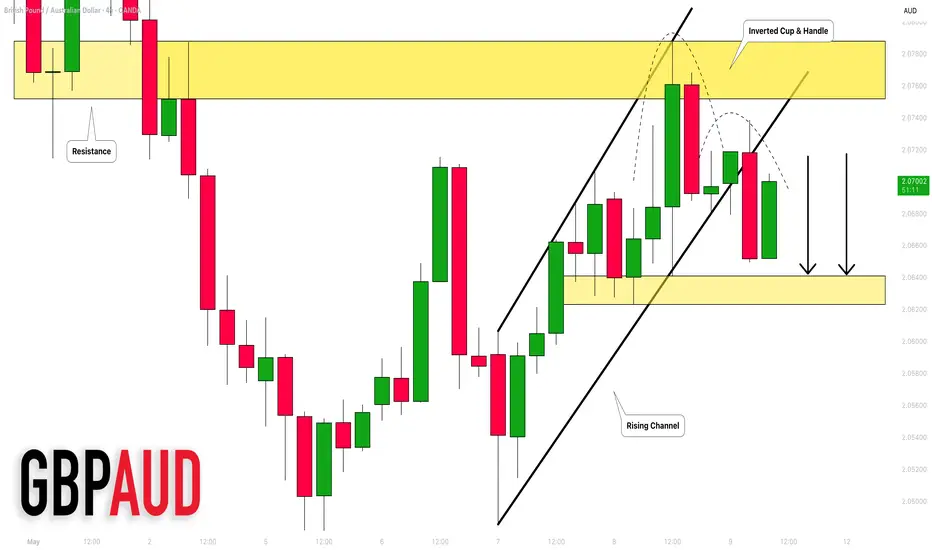
GBPAUD: 2 Strong Bearish Confirmations 🇬🇧🇦🇺
GBPAUD is in a very bearish price action after a test
of the underlined horizontal resistance.
The price formed an inverted cup and handle pattern
and violated its neckline and a support line of a rising
parallel channel on an hourly time frame.
Probabilities will be high to see a decline at least to 2.064 support.
❤️Please, support my work with like, thank you!❤️
Cup And Handle
Ethereum - Perfect exactly how I thoughtEthereum
Stage 1 - Triangle Pattern - Gave perfect breakdown of triangle pattern
Stage 2 - Form M Pattern - Have almost completed the selling target
Stage 3 - Retesting completed *Current)
Stage 4 - Forming inverse cup and handle and inverted head and shoulder pattern
Stage 5- in either of the scenario it may come down but if it goes above 2297 expect it to reach 4000/500/7000 in coming days
Stage 5.2 - if the retesting is completed and bearish patter is continued expect it to reach to 900 USD
For more details ping me
GK Trade manthan

TOST Target Price $74.18 - LARGE Cup Handle Formation.Large C & H formation with ultimate Target Price of $74.18. Within the Handle is an inverted H & S formation with 1st Taregt of $45.13

BTC is following Cup n Handle Pattern exactlyBTC is following the Cup and Handle Pattern on the Weekly timeframe. After forming the CnH Pattern, it also took a pullback.
It seems like it is about to take a rally now.

Understanding the Inverted Cup and Handle Chart PatternUnderstanding the Inverted Cup and Handle Chart Pattern
Understanding chart patterns is fundamental for market participants. This article delves into the inverted cup and handle formation, a bearish signal indicating a potential downward movement. Explore its identification, trading strategies, psychological underpinnings, common pitfalls, and more to boost your trading knowledge.
What Is the Inverted Cup and Handle Pattern?
The inverted cup and handle, sometimes called an upside-down cup and handle pattern, is a bearish chart pattern that may appear during up- and downtrends. It is the opposite of the traditional cup and handle pattern, which is bullish. The inverse formation consists of two main parts: the "cup," which is an inverted U-shape, and the "handle," a small upward retracement following the cup.
Identifying the Inverted Cup and Handle Pattern
Identifying the inverse cup and handle pattern involves recognising a specific sequence of market movements that signal a potential bearish move. Here's a step-by-step overview of identifying this formation:
Cup Formation
- Shape: The pattern begins with an inverted U-shaped "cup." The price gradually rises, consolidates, and then begins to decline, reflecting a shift from bullish to bearish sentiment.
- Depth: The cup should have a rounded top, not a sharp V-shape, indicating a gradual reversal. The depth of the cup can vary but typically represents a significant portion of the preceding movement.
Handle Formation
- Upward Retracement: After the cup's formation, prices usually experience a minor upward retracement or consolidation, forming the "handle." This movement should be relatively short and not exceed the initial high of the cup.
- Shape and Duration: The handle often appears as a small flag or pennant and should be brief in duration compared to the cup. An optimal handle retraces no more than half of the cup’s depth.
Breakout Confirmation
- Neckline Break: The pattern is confirmed when prices break below the neckline, the lowest point of the handle. This breakout often leads to a significant decline in prices, signalling a bearish trend.
- Volume Surge: Volume typically decreases during the formation of the cup and increases as prices decline, especially during the handle formation. A substantial increase in volume during the breakout can validate the pattern and minimise the risk of false signals.
The Psychology of the Inverted Cup and Handle
The psychology behind the inverse cup and handle pattern is rooted in market sentiment and behavioural finance. This bearish pattern reflects a shift from optimism to pessimism among traders.
- Initial Uptrend: The formation starts with an upward movement, where traders are generally bullish, driving prices higher. This phase is marked by growing confidence and increasing demand.
- Formation of the Cup: As prices peak, consolidate, and start to decline, some traders begin to take profits, leading to reduced buying pressure. The rounded decline of the cup signifies a gradual shift in sentiment from bullish to bearish as traders become cautious and selling pressure mounts.
- Handle Formation: The minor upward retracement forming the handle indicates a brief period of consolidation where the market tests the resolve of buyers. It can be considered a dead cat bounce. This phase often traps optimistic traders who expect the uptrend to resume, but the overall sentiment remains fragile and cautious.
- Breakout and Decline: The decisive break below the neckline represents a culmination of bearish sentiment. At this point, selling pressure overwhelms any remaining bullishness, leading to a sharp decline. The volume surge during this breakout confirms the shift in market psychology from hopeful to bearish as traders rush to exit their positions or initiate short sales.
Trading the Inverted Cup and Handle Pattern
Trading the inverted cup and handle pattern involves careful identification and strategic decision-making to maximise potential returns. This pattern presents two primary entry points for traders: during the handle formation or after the neckline break.
Entry on the Break of the Handle
- Risk-Reward Advantage: Entering on the breakout of the handle’s lower boundary offers a better risk-to-reward ratio but requires more skill and confidence in pattern recognition.
- Technical Tools: Traders often use a medium-term moving average (like 21 periods) to confirm the downward leg of the handle. A decisive close below the moving average indicates a continuation of the downward handle leg.
- Momentum Indicators: Using momentum indicators like the RSI (Relative Strength Index) or stochastic oscillator helps confirm downward movement. Bearish divergence suggests that the bearish trend is likely to continue.
- Volume Analysis: Increasing volume during the handle's breakout indicates strengthening seller control. High volume often validates the pattern and potentially reduces the risk of false signals. Note that volume data may be less reliable in a decentralised forex market.
- Stop Loss and Profit Target: Traders typically place a stop loss above the handle's high to potentially protect against upward spikes. The reverse cup and handle pattern target is usually set at a distance equal to the cup's height, projected downward from the handle's breakout point, although it can be greater if the retracement is particularly shallow.
Entry After the Neckline Break
- Confirmation Advantage: Waiting for the neckline break offers greater confirmation of the formation but may provide a less favourable risk-to-reward ratio.
- Price Action: A decisive close below the pattern's low, ideally with a strong candlestick and minimal wicks, indicates a reliable breakout. This typically confirms the bearish trend and provides a clear entry signal.
- Volume Confirmation: Higher volume during the neckline break can further validate the pattern and indicate that the breakout is genuine and not a false signal.
- Stop Loss and Profit Target: In this scenario, the stop loss is typically set above the handle's high. The profit target remains the same, projecting the cup's height downward from the breakout point.
Common Mistakes to Avoid
When trading the upside-down cup and handle pattern, avoiding common mistakes is key for maximising potential returns. Some of the more common mistakes traders make include:
- Premature Entry: Entering a trade too early, before the handle completes or the neckline breaks, can lead to false signals and losses. Most traders wait for clear confirmation, such as a decisive close below the neckline with increased volume.
- Ignoring Volume: Volume is a critical component in confirming the pattern. Low volume during the breakout phase may indicate a fakeout. Traders typically look for a substantial increase in volume to validate the pattern.
- Incorrect Pattern Identification: Misidentifying the pattern is a common error. The cup should have a rounded bottom, not a sharp V-shape, and the handle should be relatively short. Accurate identification requires practice and attention to detail.
- Overlooking Market Conditions: External factors, such as news events or broader market trends, can impact the pattern’s reliability. Traders consider these conditions when planning their trades.
Advantages and Disadvantages
As with all chart patterns, the inverted cup and handle pattern comes with its pros and cons. Here are some key advantages and disadvantages of using this pattern:
Advantages
- Clear Signal: The pattern provides a clear signal of a potential bearish movement, helping traders anticipate market declines.
- Risk Management: With defined entry and exit points (handle high for stop loss and cup depth for profit target), it aids in effective risk management.
- Flexibility in Analysis: Several forms of analysis, from support/resistance and momentum indicators to volume and price action, can be used to trade the pattern.
- Versatility: Applicable across various timeframes and markets, including stocks, forex, and commodities, making it a versatile tool for different trading strategies.
Disadvantages
- Complex Identification: Accurately identifying the pattern can be challenging, requiring significant experience and skill.
- Rarity: The pattern doesn’t occur frequently, limiting trading opportunities.
- False Breakouts: Like all chart patterns, it is susceptible to false breakouts, especially if not confirmed with volume and other technical indicators.
- Timing Sensitivity: Entering too early during the handle formation can result in premature positions, while waiting for the neckline break might reduce the risk-to-reward ratio.
The Bottom Line
The inverted cup and handle pattern is one of the most popular chart patterns among traders of all levels. However, like any technical formation, it should be used alongside other indicators and sound risk management to potentially increase its effectiveness. By mastering patterns like the inverted cup and handle, traders can gain deeper insights into market psychology and price action to navigate volatile markets with greater confidence.
FAQ
What Is the Inverse Cup and Handle Pattern in Forex?
The inverse cup and handle pattern in forex is a bearish chart pattern. It features an inverted U-shaped cup followed by a small upward retracement (the handle). This pattern suggests that sellers are gaining control, and prices are likely to decline further once the neckline is broken.
How Can You Trade the Inverse Cup and Handle?
Traders can enter positions either on the break of the handle’s lower boundary or after the neckline break. Entering during the handle might offer a better risk-to-reward ratio, while waiting for the neckline break provides greater confirmation. Key tools to validate the breakout include moving averages, momentum indicators like RSI or stochastic oscillator, and volume analysis.
What Happens After the Reverse Cup and Handle Pattern?
After the reverse cup and handle pattern is completed, the price typically moves downward strongly. This bearish movement is often confirmed by a strong breakout below the neckline with increased volume, signalling a sustained decline in prices.
What Is the Opposite of the Cup and Handle?
The opposite of a cup and handle is the inverse cup and handle pattern. While the cup and handle indicates a bullish movement, the inverse version signals a bearish trend.
Is the Inverted Cup and Handle Bullish or Bearish?
The inverted cup and handle pattern is bearish. It indicates that the price will move downwards, suggesting that traders may open short trades.
This article represents the opinion of the Companies operating under the FXOpen brand only. It is not to be construed as an offer, solicitation, or recommendation with respect to products and services provided by the Companies operating under the FXOpen brand, nor is it to be considered financial advice.
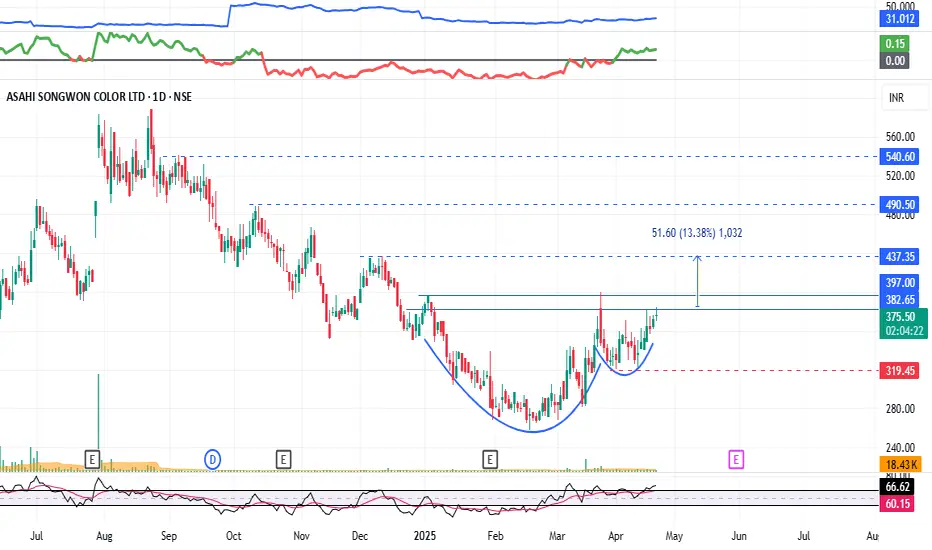
ASAHI SONGWON : Chart Pattern Breakout#ASAHISONG #cupandhandle #chartpattern #breakout #swingtrade #swingtrading
ASAHISONG : Swing Trade
>> Chart Pattern Breakout soon
>> Cup & Handle Visible
>> Volumes Dried up
>> Good Strength in Stock
Swing Traders can lock Profit at 10% and keep Trailing
Disc : Charts shared are for study Purpose & not a Trade Recommendation
Pls do uour Own Analysis or Consult ur Financial Advisor before taking any position, Dont go all in...plan ur Trades with Proper Position Sizing, Risk Management and clear plan.
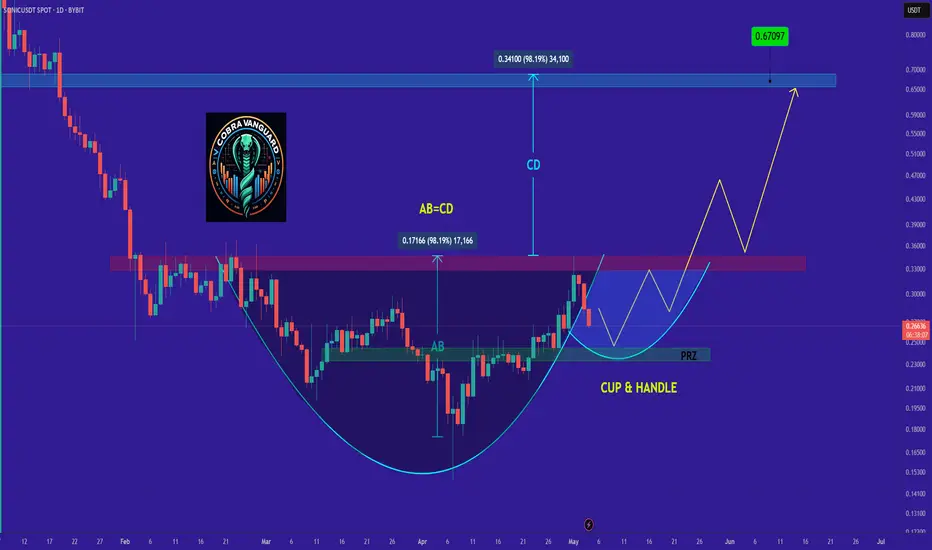
SONIC - Time to buy again!Perhaps this is a cup and handle pattern, and if that's the case, it could push the price up to around 65 cents.
Give me some energy !!
✨We spend hours finding potential opportunities and writing useful ideas, we would be happy if you support us.
Best regards CobraVanguard.💚
_ _ _ _ __ _ _ _ _ _ _ _ _ _ _ _ _ _ _ _ _ _ _ _ _ _ _ _ _ _ _ _
✅Thank you, and for more ideas, hit ❤️Like❤️ and 🌟Follow🌟!
⚠️Things can change...
The markets are always changing and even with all these signals, the market changes tend to be strong and fast!!
PRIVISCL | Time to Buy @LTP | SL below 1770 | Target 3050Disclaimer:
This is not financial advice. Please do your own research or consult with a financial advisor before making any investment decisions. Investments in stocks can be risky and may result in loss of capital.

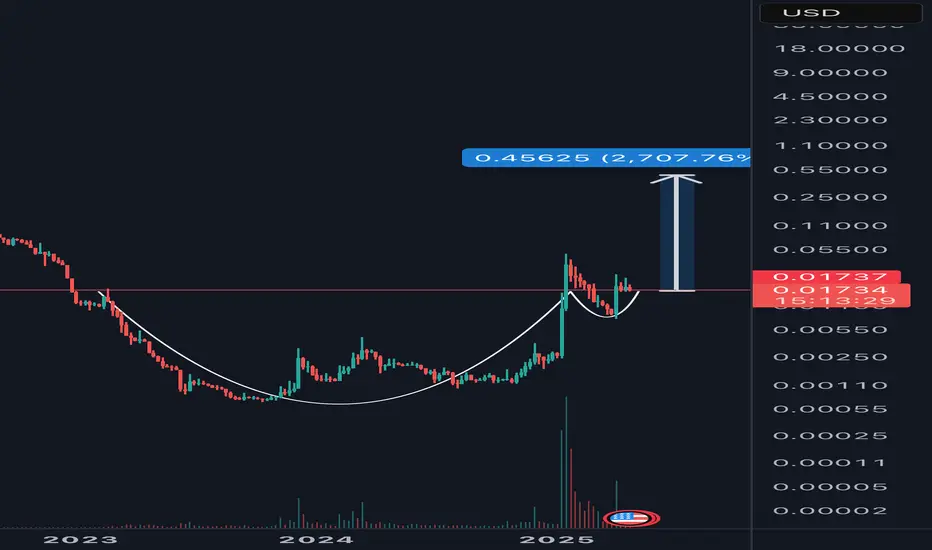
XCN Cup and Handle on the weekly Could this be the biggest cup and handle we’ve ever seen?
Pretty wild idea. But nothing is really impossible in crypto is it?
What do you think traders??
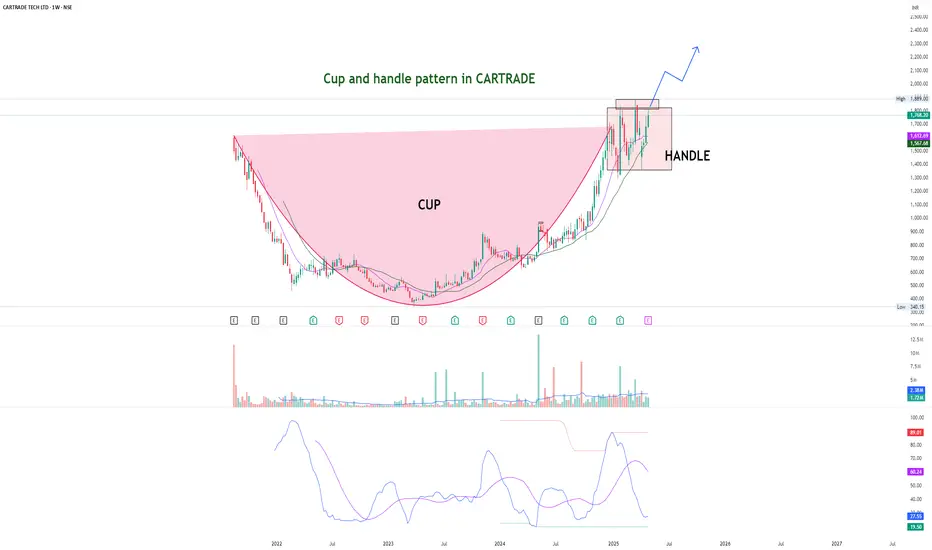
Cup and handle pattern in CartradeCup and handle pattern observed in Cartrade. The handle is of sideways action with decreasing volume during handle progression suggesting sellers are drained out and buyers are taking control. Sustainable breakout might be observed.
Sherwin-Williams Stock Quote | Chart & Forecast SummaryKey Indicators On Trade Set Up In General
1. Push Set Up
2. Range Set up
3. Break & Retest Set Up
Notes On Session
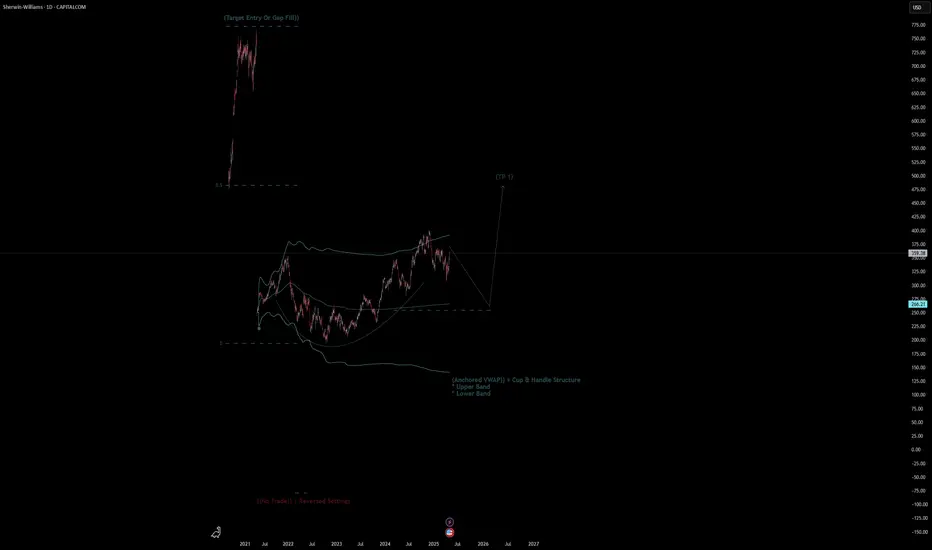
# Sherwin-Williams Stock Quote
- Double Formation
* (Target Entry Or Gap Fill)) At 770.00 USD | Completed Survey
* ((No Trade)) On Reversed Settings | Subdivision 1
- Triple Formation
* (Anchored VWAP)) + Cup & Handle Structure | Subdivision 2
* (TP1) | Subdivision 3
* Daily Time Frame | Trend Settings Condition
- (Hypothesis On Entry Bias)) | Regular Settings
- Position On A 1.5RR
* Stop Loss At 300.00 USD
* Entry At 360.00 USD
* Take Profit At 460.00 USD
* (Consolidation Argument)) & Pattern Confirmation
* Ongoing Entry & (Neutral Area))
Active Sessions On Relevant Range & Elemented Probabilities;
European-Session(Upwards) - East Coast-Session(Downwards) - Asian-Session(Ranging)
Conclusion | Trade Plan Execution & Risk Management On Demand;
Overall Consensus | Buy
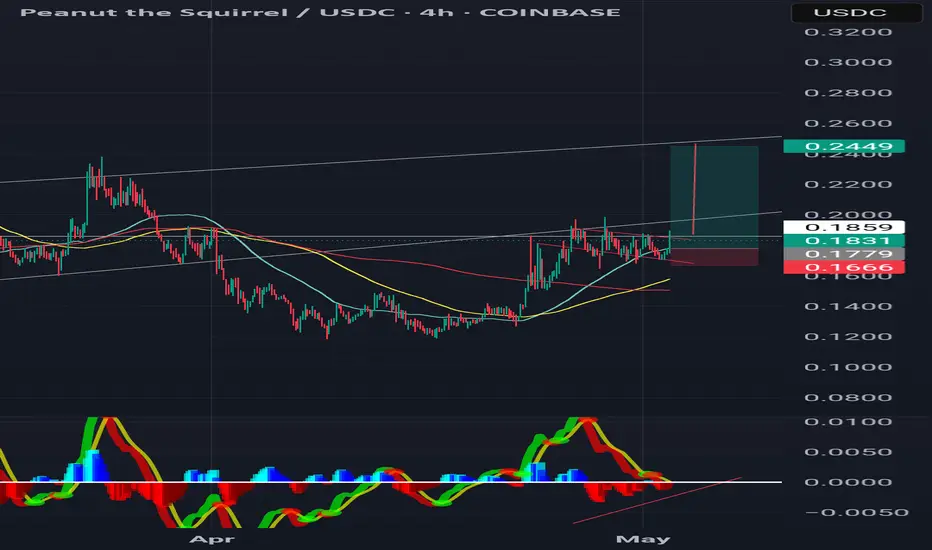
Perfect setup is nuts Easy money here just a matter of when likely soon, text book cup and handle. Depth of cup takes exactly to resistance where im sure it will wick up. $PNUT is the lowest market cap crypto on hood at 183 million pretty low volume for now, just accumulation.
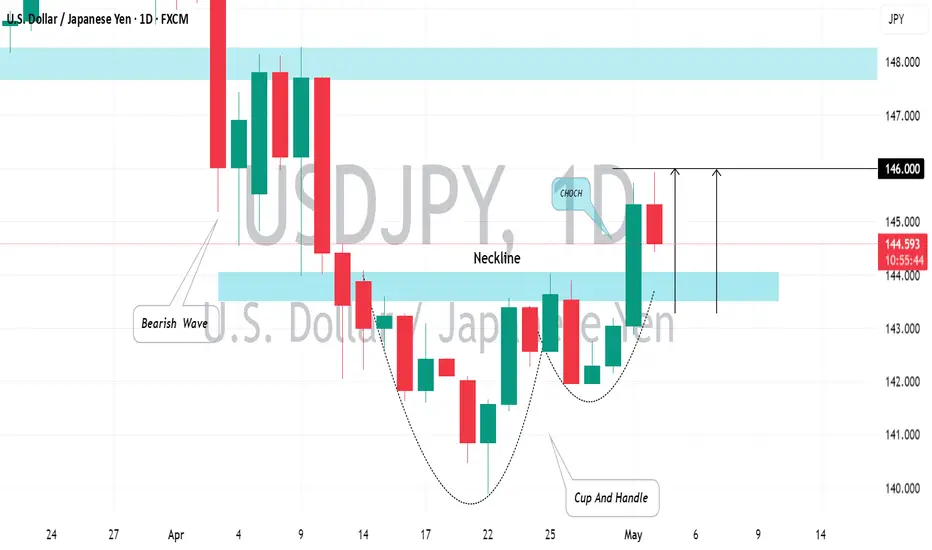
USDJPY: Time to Recover?!The USDJPY chart formed an inverted cup & handle pattern that has broken its neckline on a daily timeframe, signaling a confirmed Change of Character (CHoCH) and suggesting a potential bullish reversal.
This could lead to a market recovery and a possible move towards the 146.00 level in the near future.
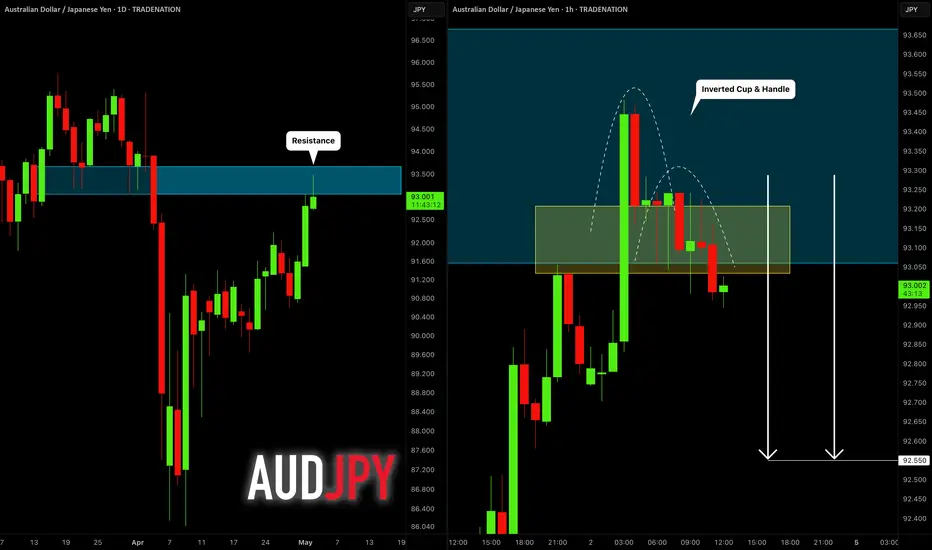
AUDJPY: Key Resistance Ahead 🇦🇺🇯🇵
AUDJPY is approaching an important resistance cluster on a daily.
The price formed a cup and handle pattern on that on an hourly.
Its neckline has just been broken.
I expect a pullback at least to 92.55 level.
❤️Please, support my work with like, thank you!❤️
I am part of Trade Nation's Influencer program and receive a monthly fee for using their TradingView charts in my analysis.
EURCHF: Pullback From Support 🇪🇺🇨🇭
There is a high chance that EURCHF will bounce
from a recently broken horizontal resistance.
After a breakout, it turned into support with a high probability.
As a confirmation signal, I see a tiny cup & handle pattern
on an hourly time frame and intraday bullish imbalance.
Goal - 0.9422
❤️Please, support my work with like, thank you!❤️
I am part of Trade Nation's Influencer program and receive a monthly fee for using their TradingView charts in my analysis.

BTC retesting its cup and handle SupportThe weekly BTC chart shows a perfect cup and handle in play.
The price is retracing after breaking the $74k resistance area in Nov 2024.
Once the price reaches, the now support, and bounces from $72-74k area we can enter long positions.
Previously it took 6 weeks to reach ATH $109K
We can expect BTC to reach $110k approx. in 2 months time once it reverses from the support $72-74k
And the rest of the 2025 may be Bullish taking us to new ATH

A wonderful ALTCOIN Bullrunis all set in motion.
If my chart resonates with you in any way.
The combined dominance charts of the big four.
#BTC.d
#ETH.d
#USDC.d
#USDT.d
We are on our way to my anticipated target zone.

Bitcoin (BTC/USD) - Cup and Handle Breakout🔍 Pattern Identified: Cup ☕ & Handle 🏆 Pattern
🕒 Timeframe: 1-Hour Chart (1H)
💥 Breakout Level: Around $95,000
🎯 Projected Target: $97,073.75
📈 Technical Overview:
Bitcoin formed a rounded cup showing accumulation at lower levels.
After completing the cup, a small pullback (handle) indicated a healthy consolidation.
A strong breakout above the neckline resistance confirms the bullish pattern.
⚡ Actionable Insights:
As long as the price stays above the neckline, momentum remains positive.
A breakout generally leads to a strong continuation rally towards the projected target.
📊 Watch for volume confirmation for added strength.
⚠️ Caution if price slips back below the neckline – breakout may invalidate.
Disclosure: I am part of TradeNation's Influencer program and receive a monthly fee for using their TradingView charts in my analysis.

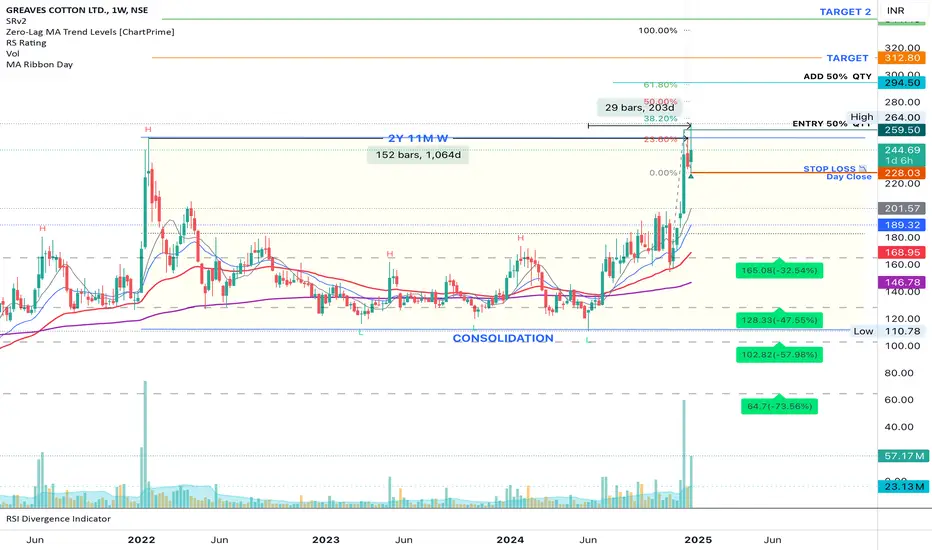
GREAVESCOT NSE 2Y11M RBCUP BO WTF -SWING/POSITIONAL Stock Analysis
Trade Plan:
Entry: 50% of the total quantity at 260 DTF Close, with an additional 50% added at 294 DTF Close Price.
Stop Loss: 228
Target 1: 312
Target 2: 341, TGT3 : 395
Hold for a period of 9 months to 2 year or until the target 3 is reached.
Chart Pattern:
The stock has formed a Rounding Bottom Cup in a time of THREE Years, there has been a Steady Bullish Copybook rise for the past 6months with a considerable volume buying
Technical Indicators:
The stock’s daily timeframe (DTF) shows that the price is currently trading above the 50-day exponential moving average (EMA) and the 20-day EMA above the 50D EMA. This indicates an Ascending phase of alignment in the stock’s EMA. A bullish trend in formation on the DTF/WTF timeframe.
Additionally, the current price is near the 23.6% Fibonacci Extension level. This level could serve as a potential entry point for investors, depending on their risk tolerance. More cautious investors might consider entering above the 38.2% retracement level.
Volume Analysis:
There has been a consistent buying volumes for a Month now. There is buying in the past. weeks are above the 20VMA.
Prioritize Watch List:
Keep this stock in your watch list for further analysis and potential trading opportunities.
Disclaimer: This information is solely for educational and reference purposes. Trading inherently carries risks, and it’s crucial to exercise caution and conduct comprehensive research before making any investment decisions. Make sure you have a well-defined risk appetite, proper position sizing, and a stop-loss order based on your risk tolerance. Review your Portfolio periodically. Exit positions when the price closes 7-8% below your entry point or When 9EMA crosses Below 21EMA in DTF. Earlier too basis your Risk profile. Consider re-entering the market when the trend reverses.Before engaging in any trading activities, it is paramount to thoroughly comprehend these technical analysis concepts and conduct extensive research on the stocks you are interested in. Furthermore, consulting a certified financial advisor can offer valuable insights and guidance before making investment decisions.
Technical Analysis Concepts:
Multiple Time Frame Analysis (MTFA):
Daily Time Frame (DTF): Used for short-term analysis and identifying trends.
Weekly Time Frame (WTF): Provides a broader perspective and helps in trend confirmation.
Monthly Time Frame (MTF): Ideal for long-term analysis and trend analysis.
All-Time High (ATH): The highest price reached on a specific chart.
Lifetime High (LTH): The highest price reached over the entire chart’s history.
Stop Loss (SL): A predetermined price level at which an investment is automatically exited to limit potential losses.
Swing Trade: A trading strategy that involves holding positions for a significant period, typically few weeks to months.
Positional Trade: A trading strategy that aims to capitalize on long-term trends and position oneself accordingly.
CHART PATTERNS
Rounding Bottom Cup/Handle (RBC&H): A pattern that signals a potential reversal from a downtrend.
Breakout (BO): A price move closure above a resistance or below a support level.
Flag & Pole BO: (F&P BO) Bullish Continuation Pattern
Consolidation : Price Typically Swings between a Range for a period of Time Long or Short basis the MTFA. Breaking out of this range UPWARDS is an opportunity to BUY and DOWNWARDS is SELL opportunity.
Moving Averages:
Exponential Moving Average (EMA): A popular moving average that places more weight on recent price data.
Volume-Weighted Moving Average (VWMA): A moving average that gives more weight to high-volume stocks.
Fibonacci Retracement/Extension:
Trend-based Fibonacci Retracement: Used to identify potential support and resistance levels during re-tracements.
Trend-based Fibonacci Extension: Used to identify potential breakout levels during extensions.
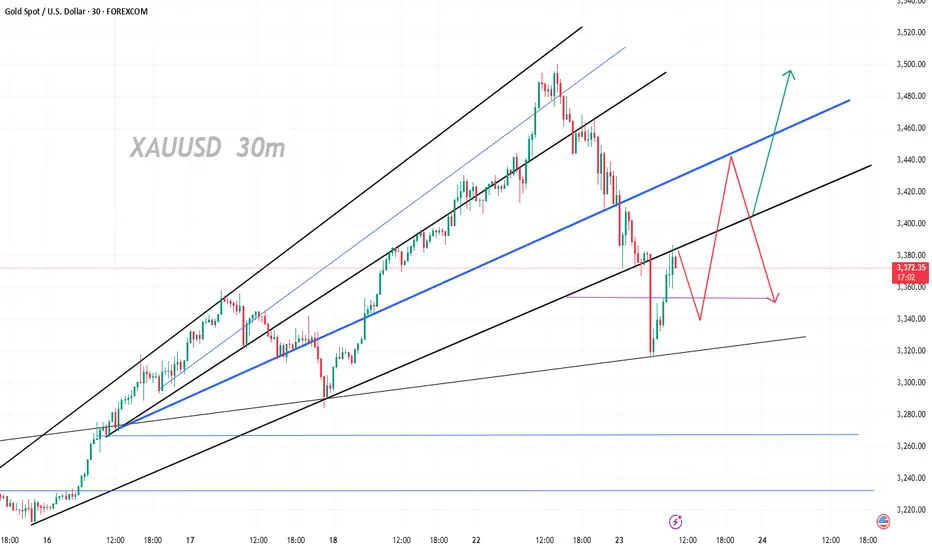
Gold: Beware of the Impending Mid-to-Long Term Bearish Trend💥 Post-market surprise news shook the gold market:
About a week ago, Trump publicly hinted at “considering firing” Powell. But just after today’s market close, he suddenly walked it back, saying he “never thought about it.”
At the same time, he dropped signals of easing trade tensions — this combo crushed gold’s safe-haven sentiment, causing a gap-down open that nearly broke below 3300!
🗣 Looks like Trump might be happily trading gold himself! 😂
Now, gold has recovered most of that drop and filled the gap, so this round of quick rebound profits is mostly over.
📉 What’s next? Strategy outlook:
🔺 Short-term resistance to watch:
Key level at 3400
If broken, 3420–3440 is a strong short-entry zone
If price pushes further, consider scaling into shorts between $3440–3540, targeting $3268
🔻 Short-term support:
A gap still exists around 3313
If price fails to break above 3440, apart from shorting near 3420, watch for buying opportunities near 3300
📉 Mid-term view:
If gold climbs past 3440 again this week and holds, expect a mid-term correction
Mid-term targets: 3190–3128
A drop below 3000 is not out of the question — the rally from 2000 to 3500 is simply too steep!
🧭 In summary: The rebound opportunity is nearly over. Don’t chase blindly at these highs — the market is entering a highly volatile decision zone. We could be looking at bull traps followed by a meaningful correction.
🎯 Long positions — manage your rhythm!
If price shows signs of exhaustion or stalls in the 3400–3440 zone,
🔔 Take profits promptly to avoid giving gains back!
If a clear breakout fails, it’s time to switch back to shorts and follow the trend.
Educational Video: How Technical Analysis worksThe chart is explained in the video and we can see how you can get an Alpha over the market by knowing when to invest in a stock. Selecting fundamentally strong company is very important but why investing in a Fundamentally strong company when it has a technical breakout can give you a better yield on your investment is explained in the video.
Disclaimer: This is not a recommendation to buy Tata Consumer Product stock but we are using it as an illustration to understand what Technical analysis is and how it works.
The above information is provided for educational purpose, analysis and paper trading only. Please don't treat this as a buy or sell recommendation for the stock or index. The Techno-Funda analysis is based on data that is more than 3 months old. Supports and Resistances are determined by historic past peaks and Valley in the chart. Many other indicators and patterns like EMA, RSI, MACD, Volumes, Fibonacci, parallel channel etc. use historic data which is 3 months or older cyclical points. There is no guarantee they will work in future as markets are highly volatile and swings in prices are also due to macro and micro factors based on actions taken by the company as well as region and global events. Equity investment is subject to risks. I or my clients or family members might have positions in the stocks that we mention in our educational posts. We will not be responsible for any Profit or loss that may occur due to any financial decision taken based on any data provided in this message. Do consult your investment advisor before taking any financial decisions. Stop losses should be an important part of any investment in equity.

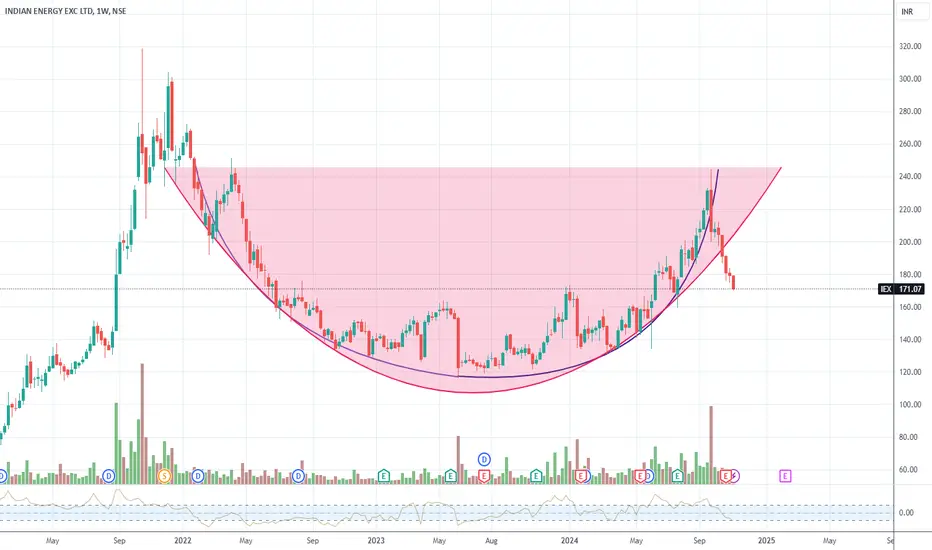
Cup Handel PatternBig cup has formed, handle is in process. Strong bullish if pattern completes. We can go long if breaks above 244
FET LONG/BUY SETUPHello, TradingView community and my subscribers, please if you like ideas do not forget to support them with your likes and comments, thank you so much and we will start a LONG/BUY outlook on #FETUSDT.P explained
