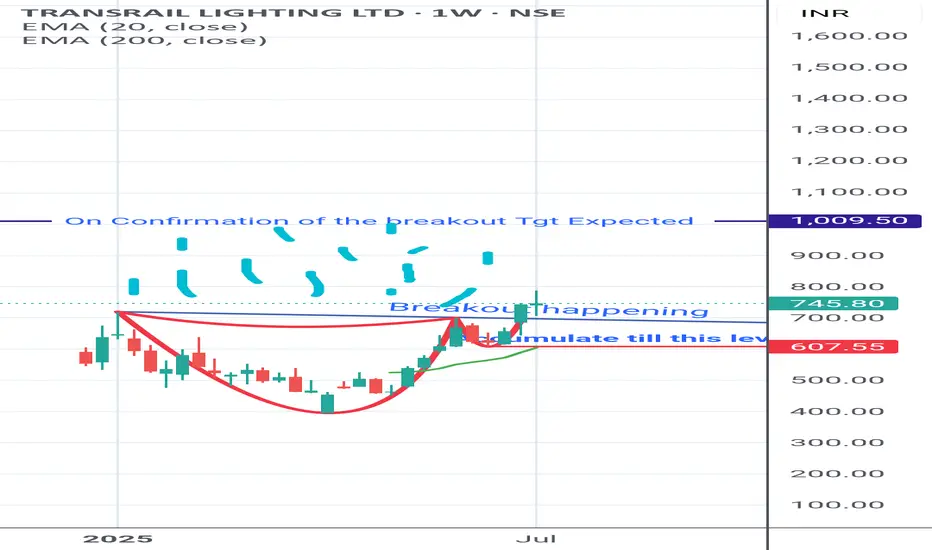
Transrail Lighting with beautiful Cup and handle pattern Have a SIP in this Cup of coffee. Looks good for Short /Longterm.
Enjoy it
Cupandhandlepattern
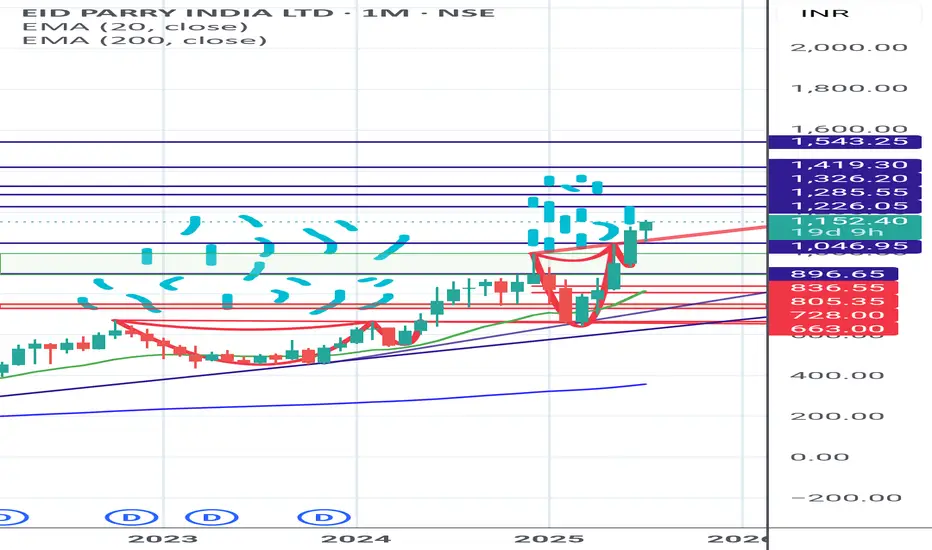
EID PARRY - TASTE THE 2ND CUP OF COFFEE Second Cup and handle pattern is ready. Taste the sweetness of it.
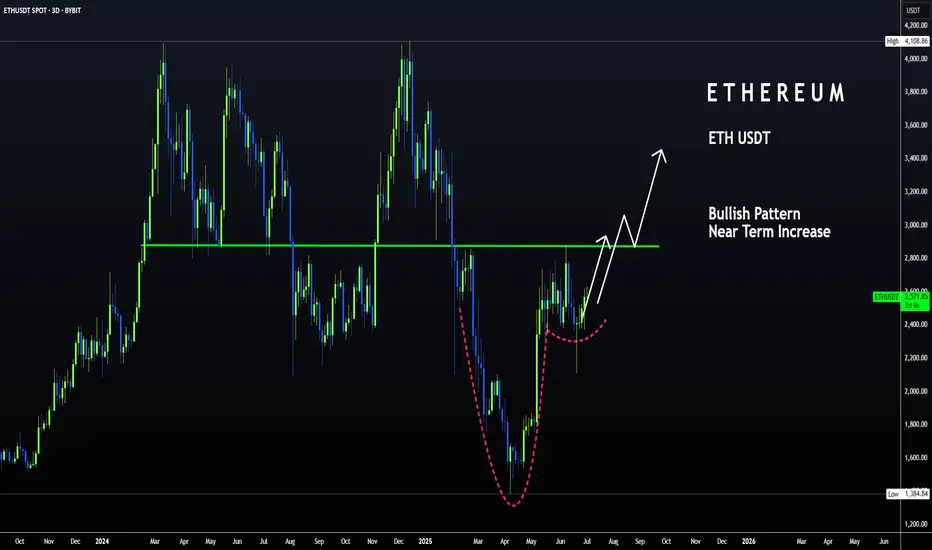
ETH | Bullish Pattern - Cup and Handle +15%A Bullish pattern is appearing on the Ethereum chart.
From a Cup and Handle pattern, we can easily expect atleast a 15% increase. This is true for the near term. A +15% would put us here:
Just under $3K we may see heavy resistance. This is also the neckline resistance, as it was the previous support for the breakout that ultimately led to a new ETH ATH.
_______________________________
BYBIT:ETHUSDT

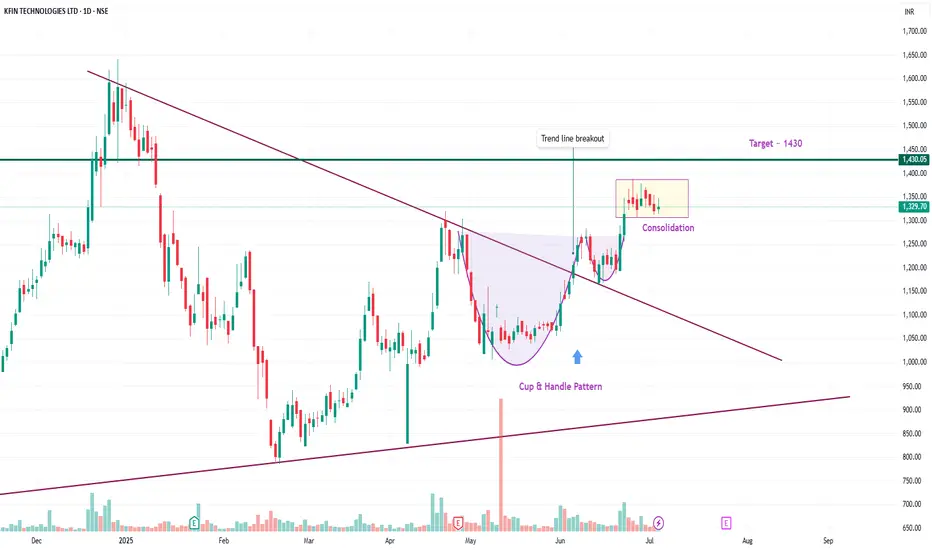
KFINTECH Bullish Signals on Daily TimeframeKFINTECH is displaying multiple bullish signals with healthy volume on the daily timeframe. It is currently consolidating and may experience a slight dip, which could offer a good accumulation opportunity.
Stop loss: Your strategy
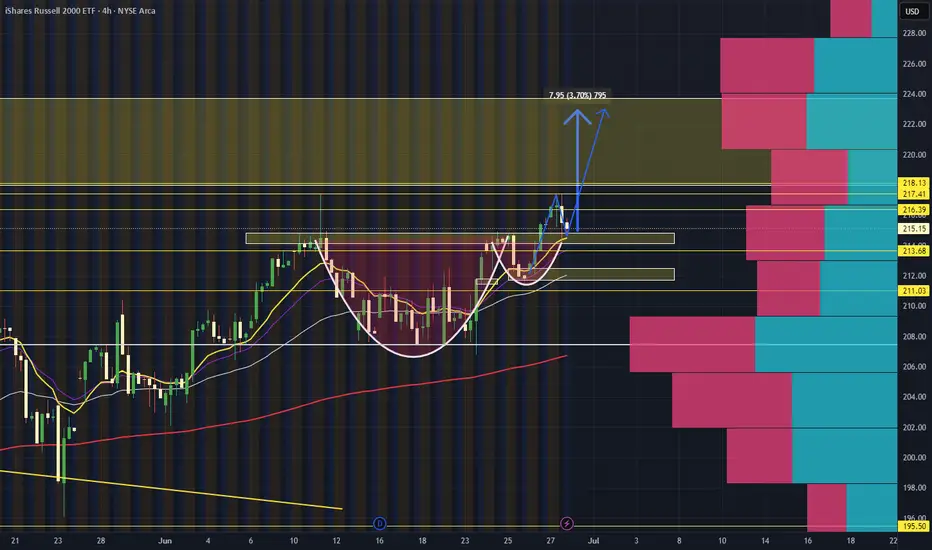
$IWM 4 hour cup and handleLooks like a cup and handle pattern formed with a retest of the neck line.
A break above $215.53 would confirm bullish momentum back in. A break and hold below the neckline would invalidate the pattern.
Happy hunting!
THELEELATHELEELA is giving resistance + cup and handle breakout above 414 level. Market participation has also increased in recent sessions. So if it sustains and closes above 414 then it looks very attractive and may start new momentum rally. 398 seems very good support. On upper side we may see momentum of 10-12%. Make sure that it sustain and closes above 414!

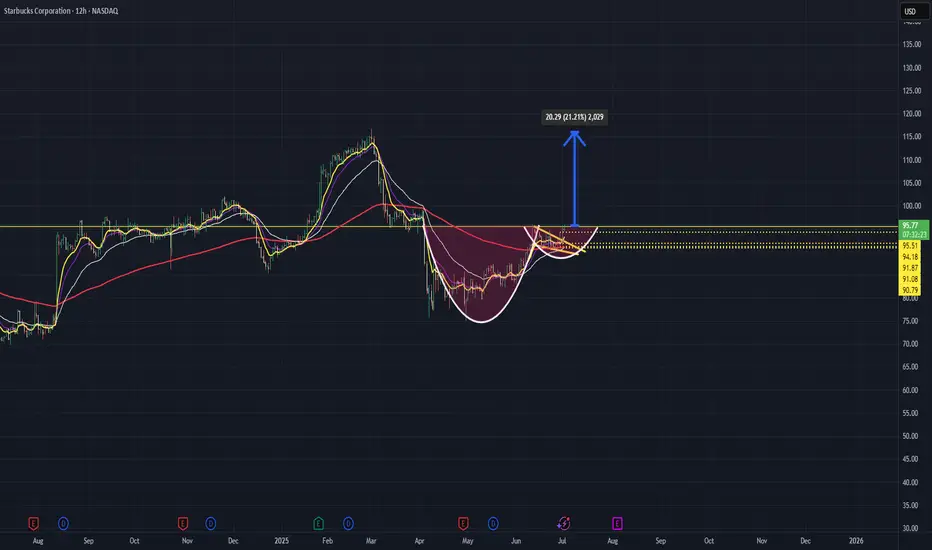
Cup and Handle with a shot of espresso: A bullish blendSince March, Starbucks ( NASDAQ:SBUX ) has been in a sustained downtrend, gradually rounding out a base. Now, the chart is showing early signs of a trend reversal.
Yesterday, price broke out of a bull flag formation on the daily chart and is now testing the $95.50 zone — a critical neckline level of a cup and handle pattern.
✅ Bullish Scenario:
A clean break and hold above $95.50 would confirm the cup-and-handle breakout.
If confirmed, this setup could target a measured move that eventually retests all-time highs.
More conservative traders may want to wait for a back test of the $95.50 neckline as confirmation, especially given its past historical significance.
⚠️ Bearish Invalidation:
A break and hold below $95.50 would invalidate the cup-and-handle pattern, suggesting the breakout has failed.
📌 This is a purely technical idea. No fundamentals involved.
As always, Happy Hunting!
This is not financial advice. Always do your own due diligence
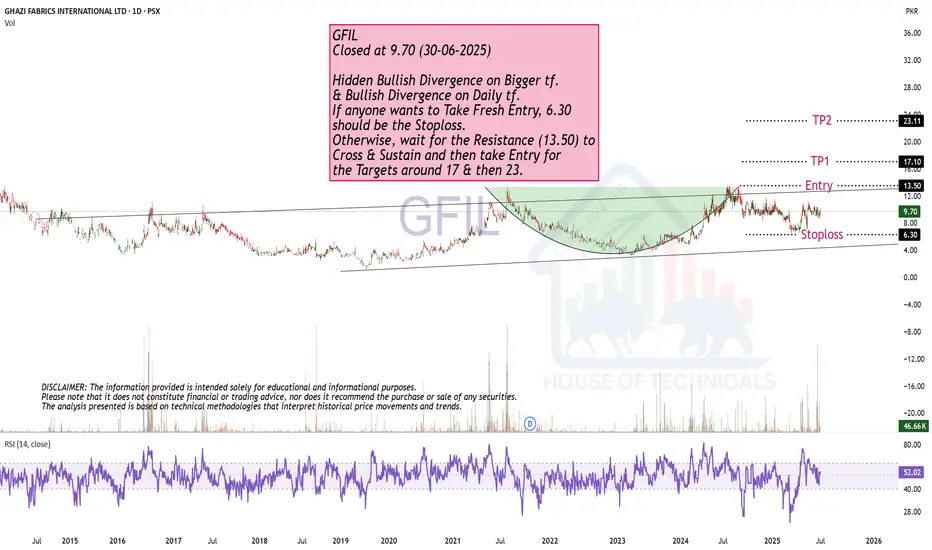
Cup & Handle Formation.GFIL
Closed at 9.70 (30-06-2025)
Hidden Bullish Divergence on Bigger tf.
& Bullish Divergence on Daily tf.
If anyone wants to Take Fresh Entry, 6.30
should be the Stoploss.
Otherwise, wait for the Resistance (13.50) to
Cross & Sustain and then take Entry for
the Targets around 17 & then 23.
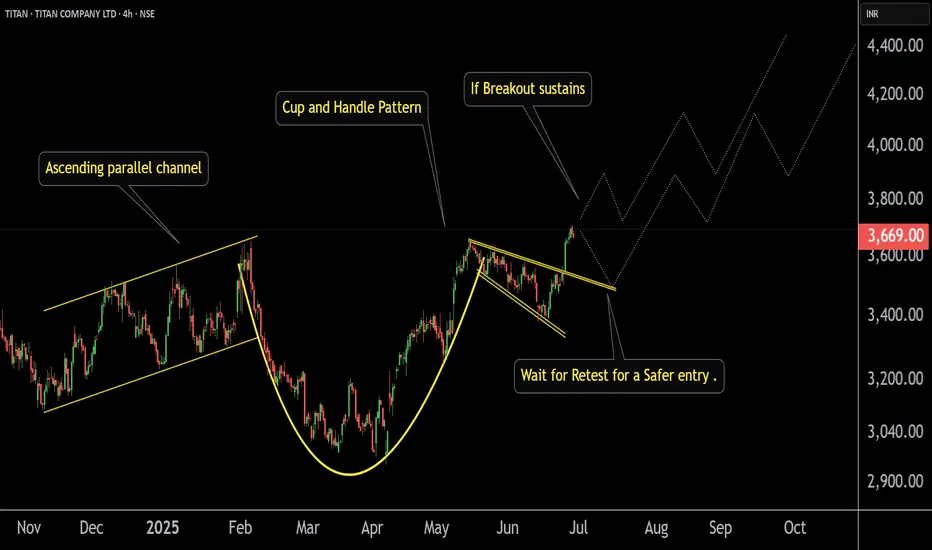
TITAN ' s Key Point | Breakout | Swing.This is the 4 hour Chart of the TITAN COMPANY.
Titan has formed a Cup and Handle pattern and given a breakout .
Two possible scenarios:
If the breakout sustains with volume, the rally may continue.
If it retests the breakout level, it would offer a safer entry before the next leg up.
If this level is sustain then we may see higher prices in Titan.
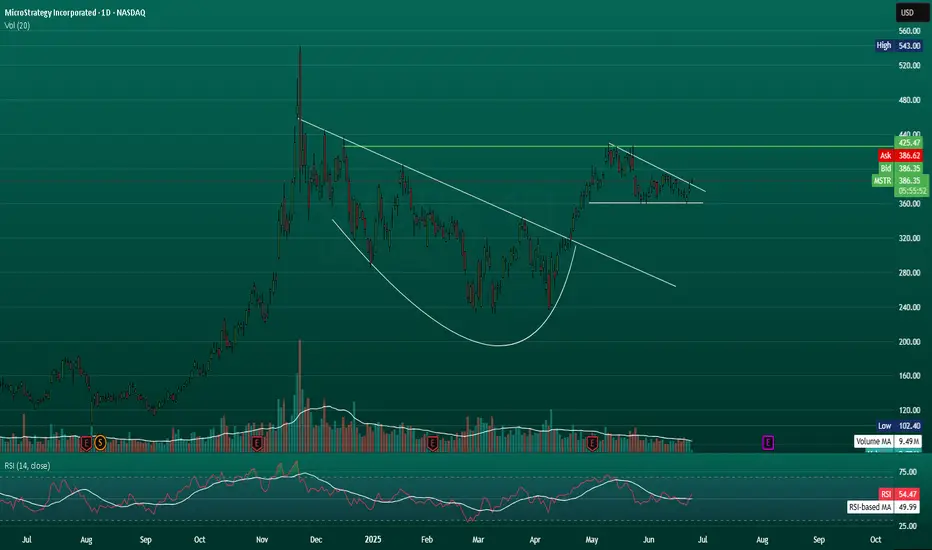
MSTRMSTR after looking above and failing in the attempt to test the highs it has been consolidating for a period of time and is show some signs of strength. If BTC can get a nice push above all time highs I believe you will see ATHs on MSTR.
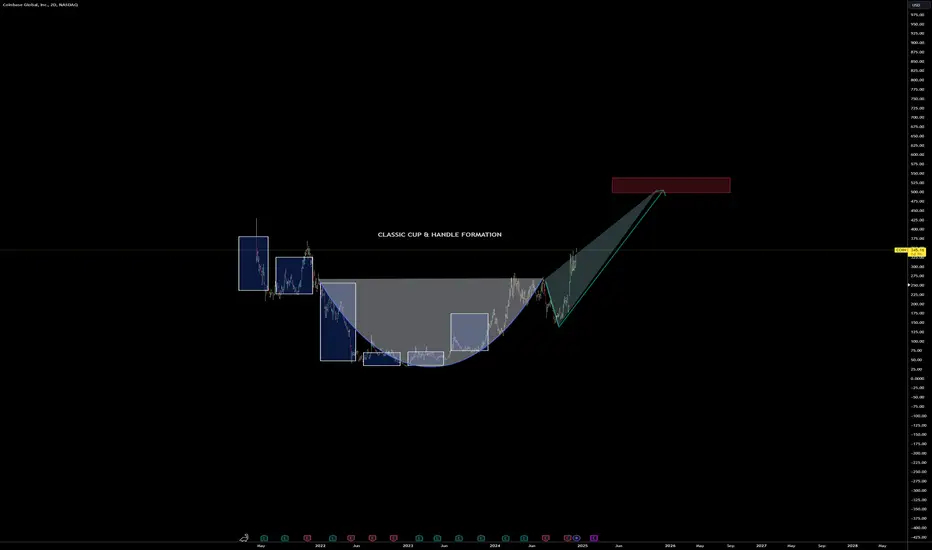
COIN- Cup and Handle FormationThere is more to this, but the basic formation is here. Other systems seem to also support the formation (such as Gann, and Harmonics).
There are a few 6 month candles overlaid in the entry to this that I was creating- illustrating the 6 month gains to form the cup. The handle portion did catch me off guard as we are typically use to seeing a cup form at the initial correction, but this one seems to have formed inside of the down move (very interesting).
Lets see how it works out. If true- its 50% gain on the bone here.
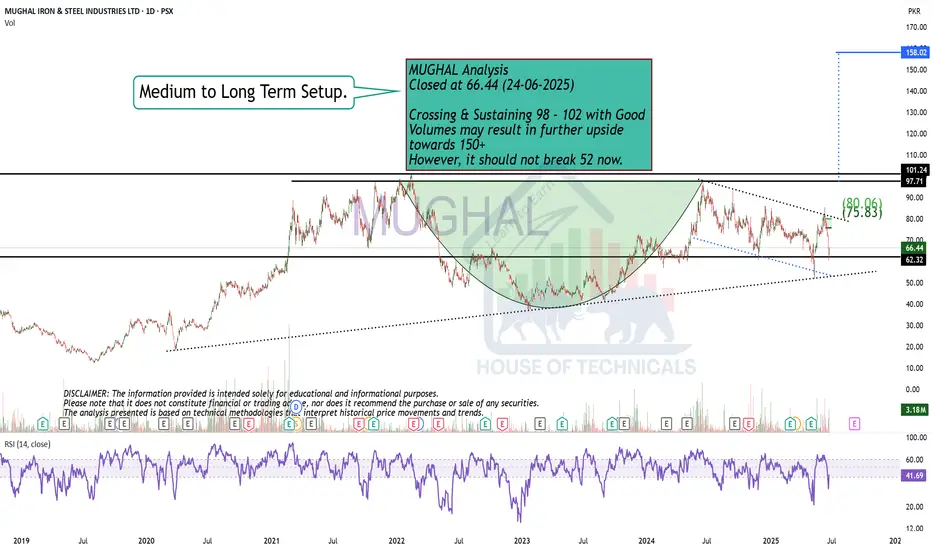
Cup & Handle FormationMUGHAL Analysis
Closed at 66.44 (24-06-2025)
Crossing & Sustaining 98 - 102 with Good
Volumes may result in further upside
towards 150+
However, it should not break 52 now.
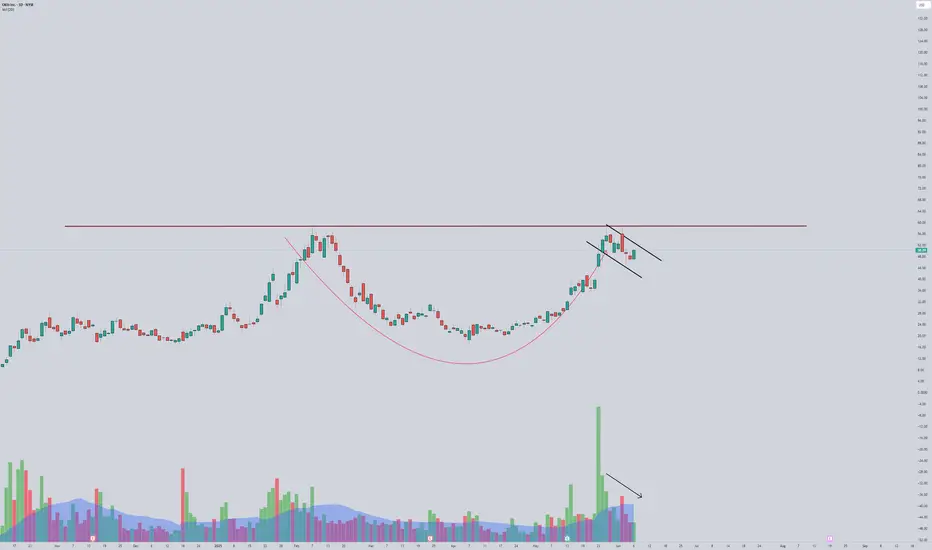
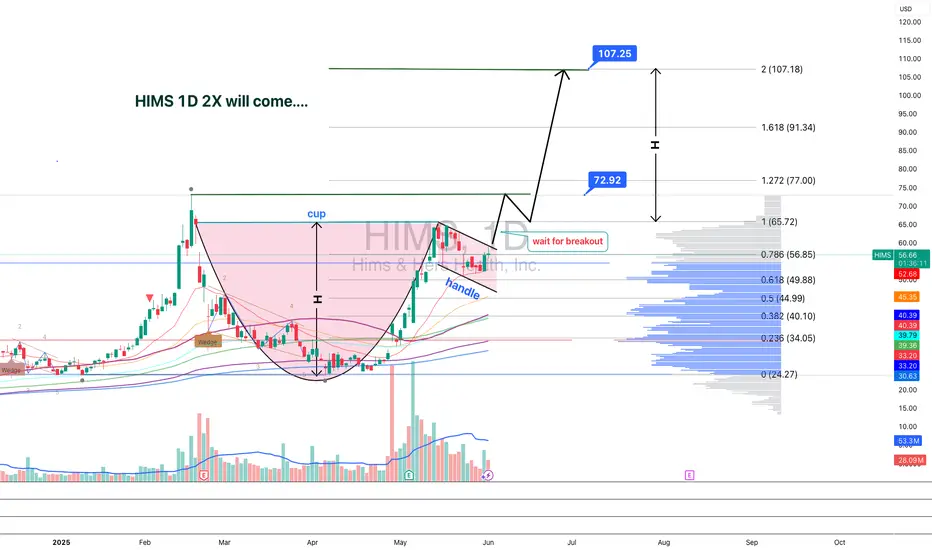
HIMS 1D — This pattern didn’t cook for nothingOn the daily chart of Hims & Hers Health, we’re looking at a textbook cup with handle formation — not just a pattern, but a structure backed by time, volume, and classic price behavior. The base of the cup formed steadily from February to May 2025, and as soon as the curve was complete, price transitioned into a tight consolidation — the "handle" that often masks real accumulation.
Right now, price is testing the resistance area. And it’s not just floating up there — it’s coming in hot: price has already broken through EMA 20/50/100/200 and SMA 50/200. That’s a full stack flip. This isn’t sideways noise — it’s a structural shift in control.
Volume is starting to build as price rises, confirming that demand is real and institutional positioning likely active. We’re watching a breakout zone above the handle — and when that breaks, the structure unlocks with a clear target: $107.25, roughly a 2x move from current levels.
This setup isn’t noise. It’s a long-cooked formation that’s now about to boil over. If the handle holds and price breaks through — the rest is just follow-through.
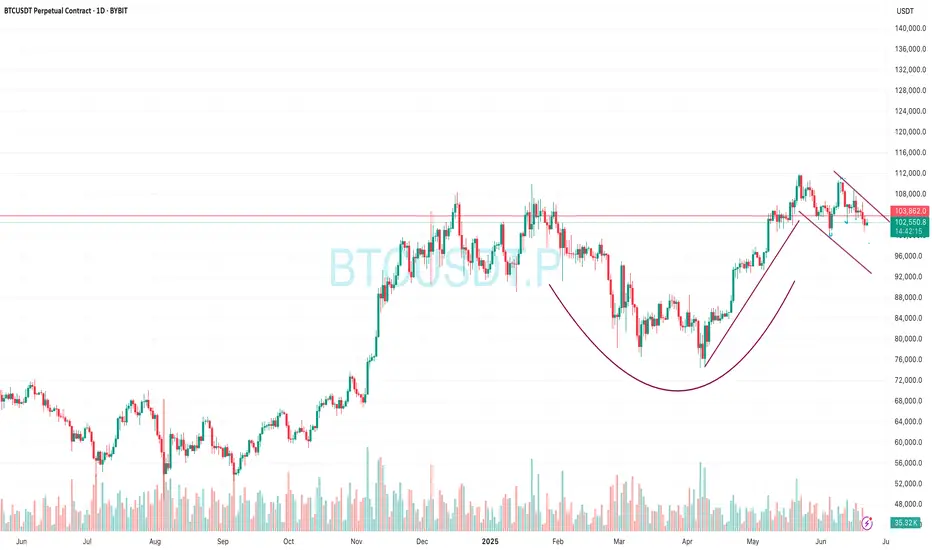
BTC - Cup & Handle?BTC forming a cup and handle on the 1D chart which seems to be the main timeframe/narrative of play..
Bullish on All Time Frames.SSGC Closed at 44.24 (18-06-2025)
Bullish on All Time Frames.
Important Resistance Zone : 50 - 57
Important Support Zone : 35 - 41
Very Strong Bullish Patterns appearing
on Bigger Time frames.
Crossing 56 - 57 with Huge Volumes, may
result in further upside move of price
towards 80+
However, this time it should not break 24.

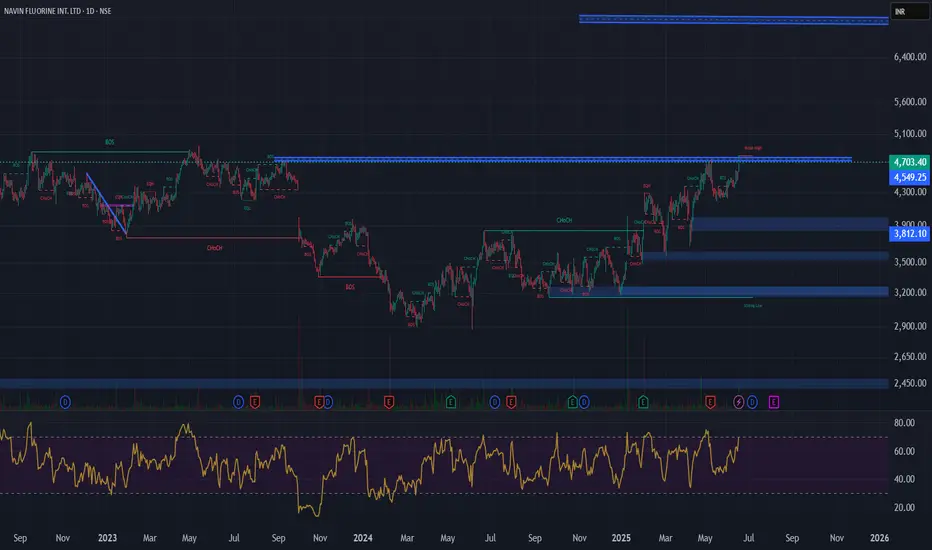
Cup & Handle Breakout - NAVINFLOURCurrent Price: ₹4,703
Technical Analysis:
Cup & Handle Breakout Pattern: The provided chart for NAVIN FLUORINE INT. LTD. shows a pattern that resembles a Cup & Handle. The current price action indicates it is at or near a potential breakout level.
Waiting for Confirmation: Your statement "Waiting for confirmation" is crucial. A confirmed breakout typically involves the price sustaining above the resistance level with strong trading volume.
Immediate Target: ₹7,000
Time Frame: 6 months to 1 year.
Fundamental Analysis:
Sales (Revenue from Operations): Consistently growing over the years, from ₹486 Cr in Mar 2014 to ₹2,349 Cr in Mar 2025.
Operating Profit: Shows a strong upward trend, from ₹66 Cr in Mar 2014 to ₹534 Cr in Mar 2025.
Net Profit: Also shows consistent growth, from ₹68 Cr in Mar 2014 to ₹289 Cr in Mar 2025.
EPS in Rs.: Increased from ₹13.47 in Mar 2014 to ₹58.19 in Mar 2025. This indicates healthy year-on-year growth in earnings.
Compounded Sales Growth: Healthy growth with 14% (TTM), 17% (3 Years), 17% (5 Years), and 15% (10 Years).
Compounded Profit Growth: Very strong growth with 25% (TTM), -7% (3 Years), and 20% (10 Years). The negative 3-year profit growth needs to be investigated, as the net profit has consistently increased in the past 3 years (258 Cr in Mar 2022, 375 Cr in Mar 2023, 270 Cr in Mar 2024, 289 Cr in Mar 2025). This might be due to a specific high base year or non-recurring items impacting the compounded calculation for that period.
Return on Equity (ROE): Strong and consistent, with 12% (Last Year), 13% (3 Years), 14% (5 Years), and 16% (10 Years).
Dividend Payout %: Consistent dividend payouts, with 21% in Mar 2025.
Stock P/E: While not provided in the specific image for Navin Fluorine's fundamental ratios, based on the current price of ₹4703 and FY25 EPS of ₹58.19, the trailing P/E would be approximately 80.82. This is a very high P/E ratio, indicating significant growth expectations are priced into the stock.
Corporate Actions & Latest News:
Dividends: The company has a consistent history of paying dividends.
Capacity Expansion/R&D: As a specialty chemicals and fluorochemicals company, corporate actions and news for Navin Fluorine often revolve around:
New project announcements or capacity expansions to meet growing demand.
R&D initiatives for new products or applications.
Strategic partnerships or collaborations.
Client wins in niche chemical segments.
Q4 FY25 Results: The latest news would include the Q4 FY25 financial results, which show a Net Profit of ₹289 Cr.
Company Order Book:
For a specialty chemicals company like Navin Fluorine, the "order book" typically includes long-term contracts with key clients and new project wins. A growing sales trend suggests a healthy order pipeline.
Overall Assessment:
Navin Fluorine International Ltd. presents a fundamentally strong picture with consistent growth in sales and net profit, along with robust profitability ratios like ROE. This strong fundamental performance supports the company's premium valuation.
The Cup & Handle breakout pattern is a bullish technical indicator. If confirmed with strong volume, it could potentially lead to the stock moving towards higher levels.
Key Considerations:
High Valuation: The calculated P/E of approximately 80.82 is very high. This means the market is already pricing in substantial future growth. The company needs to continue delivering exceptional results to justify and sustain this valuation.
Confirmation of Breakout: It's crucial to wait for proper confirmation of the Cup & Handle breakout with strong volume to validate the technical signal.
Profit Growth Anomaly: Investigate the negative "Compounded Profit Growth" for 3 years, despite the increasing net profit trend shown in the table. This might be a calculation anomaly or specific high-base effect.
Given the strong underlying business, consistent growth in key financial metrics, and the bullish technical pattern, the immediate target of ₹7,000, while ambitious, could be plausible within the 6-month to 1-year timeframe, provided the technical breakout is confirmed and the company continues its strong fundamental performance.
Disclaimer: This analysis is for informational purposes only and does not constitute investment advice. Investing in stocks, especially those with high valuations, carries inherent risks. Always conduct your own thorough research, carefully analyze the stock chart, assess your risk tolerance, and consult with a qualified financial advisor before making any investment decisions. The stock market carries inherent risks.
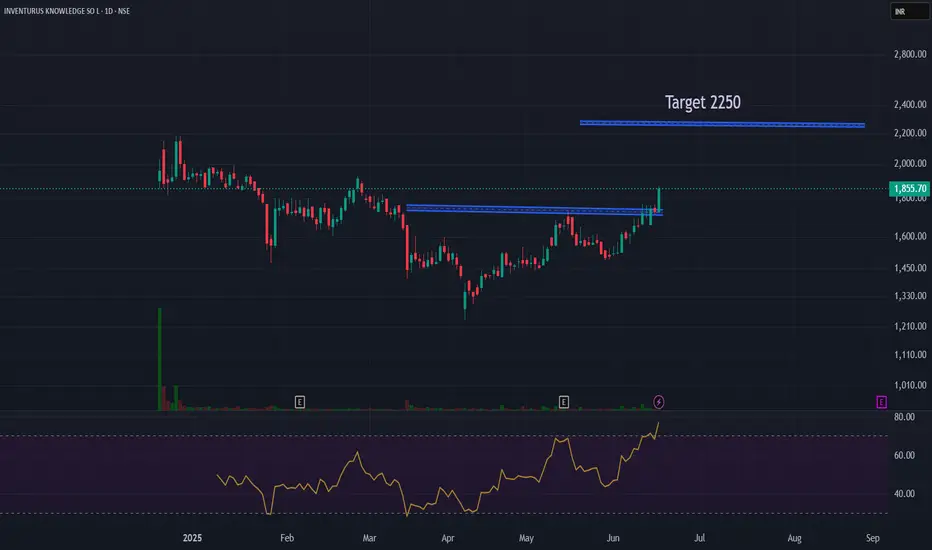
Cup & handle Breakout - IKSCurrent Price: ₹1,855
Technical Analysis:
Cup & Handle Breakout Pattern: The provided chart for "INVENTURUS KNOWLEDGE SO L LTD" shows a pattern that resembles a Cup & Handle, with the price breaking out above a resistance level.
Waiting for Confirmation: Your statement "Waiting for confirmation" is crucial. A confirmed breakout typically involves the price sustaining above the resistance level with strong trading volume.
Immediate Target: ₹2,250
Time Frame: 3 to 6 months.
Strict Stop Loss: ₹1,630.
Fundamental Analysis (Based on the images provided for Inventurous Knowledge Solutions Ltd.):
Market Cap: ₹31,858 Cr.
Current Price: ₹1,856 (close to your stated ₹1,855)
Stock P/E: 65.5. This is a very high P/E ratio, indicating significant growth expectations are priced into the stock.
Book Value: ₹104
Dividend Yield: 0.00%. The company does not currently pay dividends.
ROCE (Return on Capital Employed): 27.2%. This is a strong return, indicating efficient use of capital.
ROE (Return on Equity): 33.0%. This is an excellent return, showing strong profitability for shareholders' equity.
Face Value: ₹1.00
Industry P/E: 35.7. IKS's P/E of 65.5 is considerably higher than the industry P/E, suggesting it's valued at a premium compared to its peers.
Price to Sales: 12.0. This is a high Price to Sales ratio, indicating the market values its sales highly.
High / Low (52-week): ₹2,190 / ₹1,226.
Sales (Revenue from Operations): Consistently growing from ₹529 Cr in Mar 2020 to ₹2,664 Cr in Mar 2025.
Operating Profit: Shows strong growth, from ₹162 Cr in Mar 2020 to ₹770 Cr in Mar 2025.
Net Profit: Consistently increasing, from ₹137 Cr in Mar 2020 to ₹486 Cr in Mar 2025.
EPS in Rs.: Grew from ₹166.73 in Mar 2020 to ₹28.33 in Mar 2025. (Note: There's a significant drop in EPS from Mar 2020 (₹166.73) to Mar 2021 (₹200.10) to Mar 2022 (₹13.61) then recovering to ₹28.33 in Mar 2025. This may indicate a stock split or bonus issue that adjusted the EPS calculation over these years, making direct year-on-year numerical comparison without accounting for corporate actions misleading for these specific numbers. However, the net profit is consistently growing).
Compounded Sales Growth: 10 Years: N/A, 5 Years: 52%, 3 Years: 52%, TTM: 47%. These are very strong sales growth figures.
Compounded Profit Growth: 10 Years: N/A, 5 Years: 29%, 3 Years: 25%, TTM: 31%. These are also strong profit growth figures.
Return on Equity: Last Year: 46%, 3 Years: 37%, 5 Years: 39%. Excellent and consistent ROE.
Corporate Action & Latest News:
No specific corporate actions (like dividends for the latest year or splits/bonuses) are listed in the provided snippets.
The strong and consistent growth in sales, operating profit, and net profit indicates positive fundamental performance. This suggests the latest news would likely revolve around strong financial results and positive outlooks for the company.
For a company in "Knowledge Solutions," news might also include new client wins, expansion into new service areas, technological advancements, or strategic partnerships.
Company Order Book:
For a "Knowledge Solutions" company, an "order book" might refer to long-term contracts, recurring client engagements, and new project wins. The consistent sales growth implies a healthy pipeline of work.
Overall Assessment:
Inventurous Knowledge Solutions (IKS) presents a strong fundamental picture with consistent and high growth in sales and profits, coupled with excellent profitability ratios like ROCE and ROE. This explains the premium valuation (Stock P/E of 65.5 vs Industry P/E of 35.7), as the market is clearly pricing in sustained high growth.
The Cup & Handle breakout pattern on the chart is a bullish technical indicator. If confirmed with strong volume, it could propel the stock towards your immediate target of ₹2,250 within 3-6 months. The strict stop loss at ₹1,630 provides risk management.
Key Considerations:
Valuation: The stock is trading at a significant premium to its intrinsic value and industry P/E. This means future growth needs to be exceptionally strong to justify and sustain this valuation.
EPS Interpretation: Be mindful of potential corporate actions (like stock splits) that might have impacted the reported EPS historical numbers. The net profit growth is more consistently indicative of performance.
Confirmation of Breakout: Crucially, wait for proper confirmation of the Cup & Handle breakout with strong volume to validate the technical signal.
Given the strong underlying business performance, excellent growth metrics, and the bullish technical pattern, the immediate target of ₹2,250 within the specified timeframe appears plausible, contingent on the confirmed technical breakout and continued strong fundamental performance.
Disclaimer: This analysis is for informational purposes only and does not constitute investment advice. Investing in stocks, especially those with high valuations, carries inherent risks. Always conduct your own thorough research, carefully analyze the stock chart, assess your risk tolerance, and consult with a qualified financial advisor before making any investment decisions.
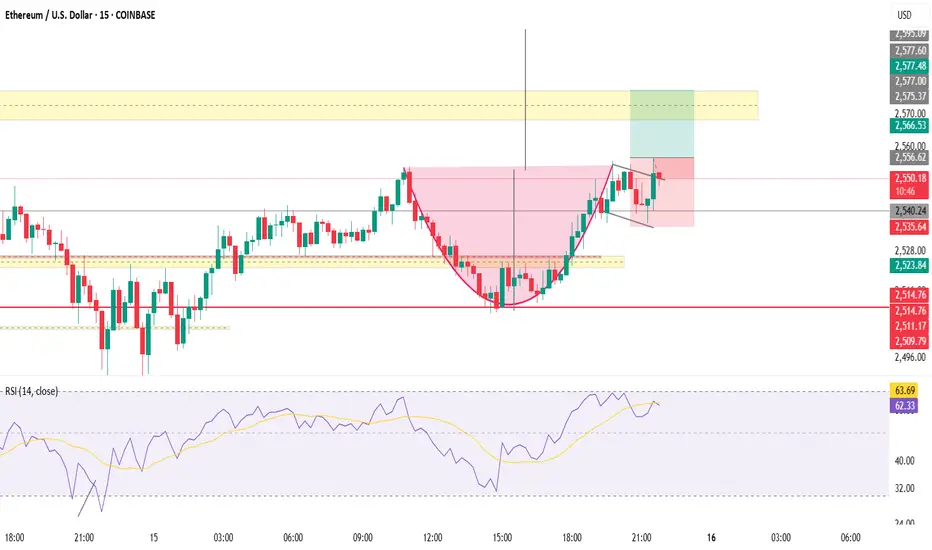
EHTUSD15 min TF
Buy on next breakout
Cup and Handle Format
Risk Reward mentioned in chart with TP SL EP
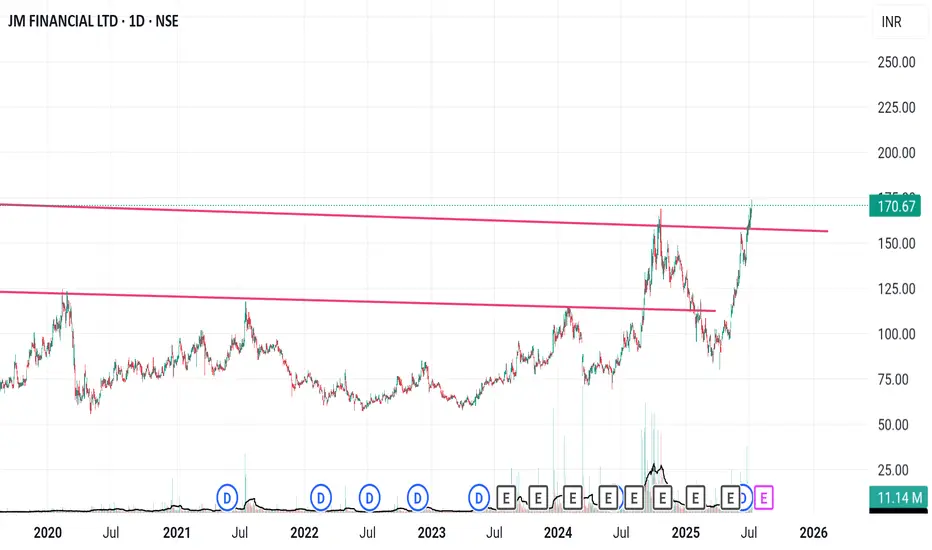
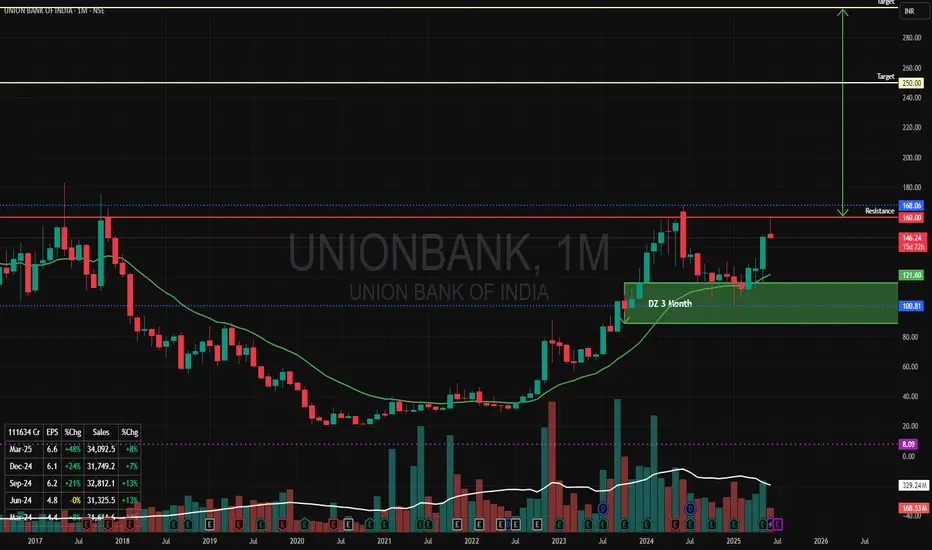
"Union Bank of India" Cup & Handle PatternI can see a Cup & Handle Pattern in Union Bank of India in Monthly Time Frame. Price is also coming from Monthly Demand Zone.
Rs 160 is a a Resistance line to break this Pattern.
Once we see a breakout of this level of Rs 160 Upside with a Good Volume (Increased from Previous Months) the Price can double from here to Rs 300 in next 12 months time.
first Target Rs 250/-
Second Target RS 300/-
Lets Hope for the Best!
OKLO can go locoPattern: Classic cup and handle formation. Handle forming as a bull flag — very bullish continuation setup.
Resistance: ~$57.78 — key neckline from prior highs. Needs strong close above this level for confirmation.
Volume: Declining during handle = textbook. Suggests controlled pullback. Watching for volume spike on breakout.
Moving Averages: Price is trading above all key MAs, confirming bullish trend structure.
🔥 Most Favorable Path:
Let price tighten within the handle, then breakout above $57.78 on increased volume. If confirmed, target $66–70+ based on measured move from cup base to neckline.
⚠️ Invalidation:
Break below $50 with volume would invalidate handle and signal potential deeper retracement.
✅ Summary:
Setup: Cup & Handle
Bias: Strongly bullish
Entry trigger: Break + close > $57.78
Targets: $66 → $70 zone
Risk level: Manage below $50
*Not a financial advice