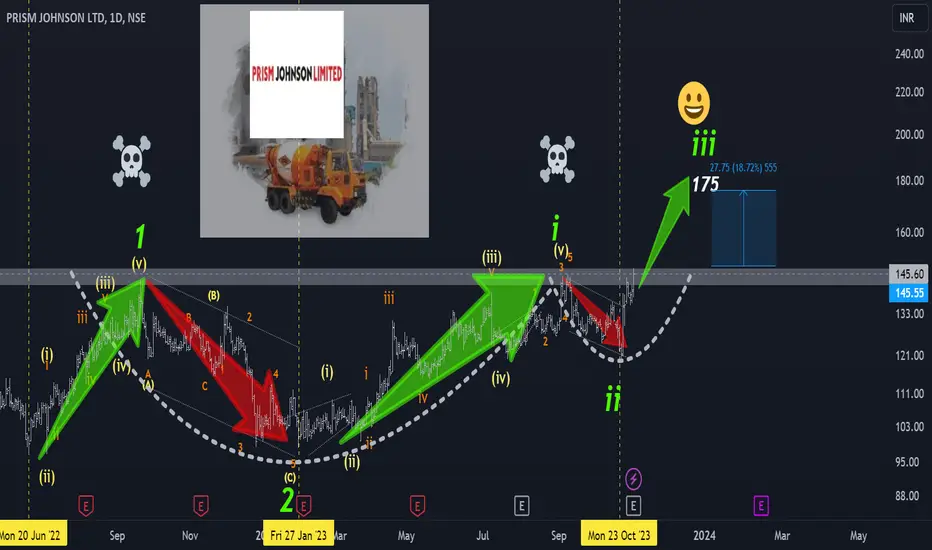
Break-out on cards and 18% rally for PRISM JOHNSON?There are three bullish confluences that you can see on this chart.
1.According to Elliot wave model the stock is taking off in wave III of 3.
2. A probable cup and handle breakout attempt.(target for this pattern comes in at around 200 Rs.)
3. Breakout attempt from imp 6 years old(2018-2023) horizontal resistance zone (145-150(Rs.))
The stock can give a swift move once it decisively closes above 150 mark.
Note*- This is not a buy/sell recommendation. This post is for educational purpose only.
Cupandhandlepattern
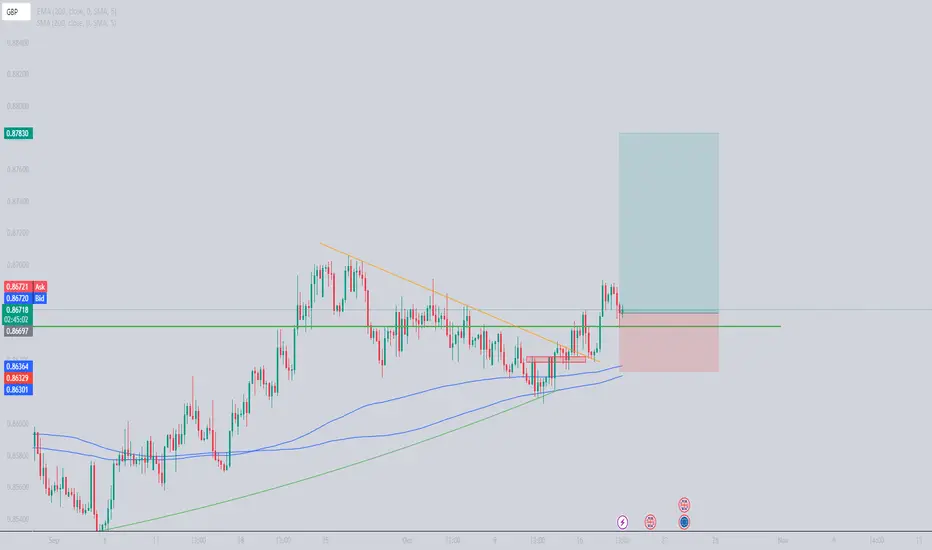
EURGBP in 4h timeframeafter cup and handle pattern in daily timeframe we have trend line in 4h that breaked out from it and ready for long position with good risk to reward(at least 3)
i puting daily timeframe screenshot in below
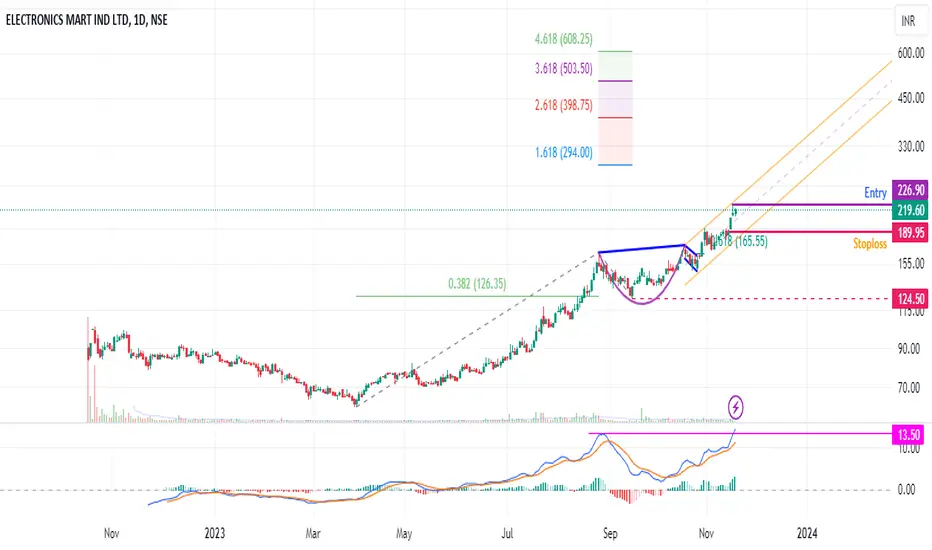
Electronics Mart has Cup and Handle pattern by William O'neilStock has made breakout from cup and handle pattern which didn't retrace more than 0.382 Fibonacci of previous rally. This pattern was developed by William O'Neil and introduced in his 1988 book, How to Make Money in Stocks.
Electronics Mart has a potential to 2-3x from here onwards as sales were also good in recent quarter. Entry 227 with small stop at gap near 207/190 as per your risk capacity.
DISCLAIMER:
There is no guarantee of profits or no exceptions from losses.
The stock and its levels discussed are solely the personal views of my research.
You are advised to rely on your judgement while investing/Trading decisions.
Seek help of your financial advisor before investing/trading.
Investment Warnings:
We would like to draw your attention to the following important investment warnings.
-Investment is subject to market risks.
-The value of shares and investments and the income derived from them can go down as well as up.
-Investors may not get back the amount they invested - losing one's shirt is a real risk.
-Past performance is not a guide to future performance.
-I may or may not trade this analysis
--------------------------(((((LIKE)))))-------------------------------
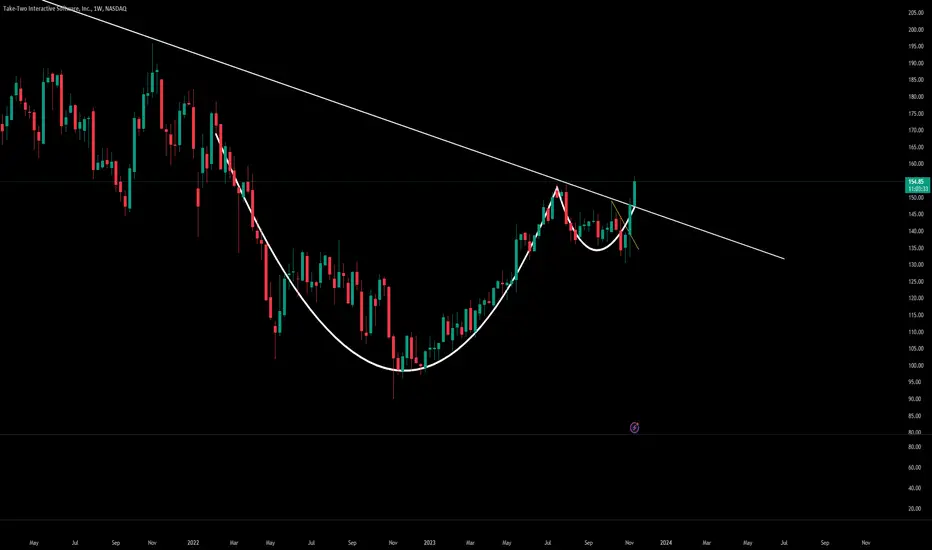
GTA VI Effect?Take Two Interactive, while on the downward sloping trend has formed a cup & handle pattern and successfully managed to break out of the range. The arrival of next Grand Theft Auto series is likely to push the stock up as it is likely to be one of the best selling titles in the gaming industry.
The stock has many supporting reasons to drive its price higher as we may see the continuation of GTA Online (for both V & VI) which has been a massive success amongst the community and also for Rockstar as it has helped generate regular income from its business model. Other than being the best GTA ever, it will incorporate features from other successful titles such as Red Dead Redemption 2, which arguably had better graphics than GTA V & all other games from the parent company in the past. We may also see Rockstar borrowing elements from RDR 2 like character physics & animals such as horses which have never been present in GTA before. This will be biggest & best release ever from the GTA series unlike Apple claiming their Iphone to be which is merely different from its previous iterations.
Moreover, the stock is down from its all time high and thus we can expect to see it breaking its previous highs with the next GTA on its cards. The stock looks good for a long term holding as Rockstar has high estimates from its upcoming titles in 2024-25 and none other than next GTA can achieve this level of sales. Rockstar has other upcoming titles too in the pipeline that may contribute to their success in the future.
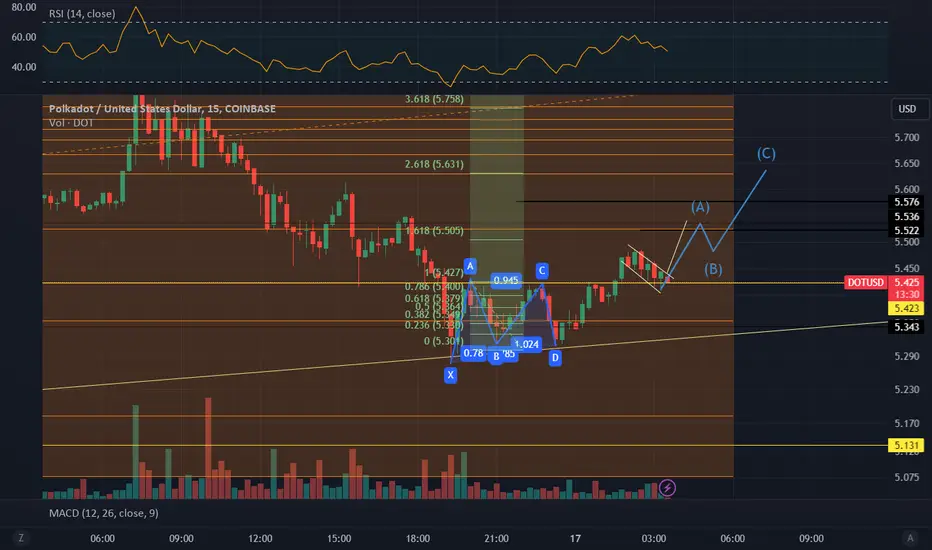
PolkaDOT cup and HQuick idea GOOD or BAD we will know soon!
NOT INVESTMENT ADVICE!!! IT CAN GO TO ZERO!
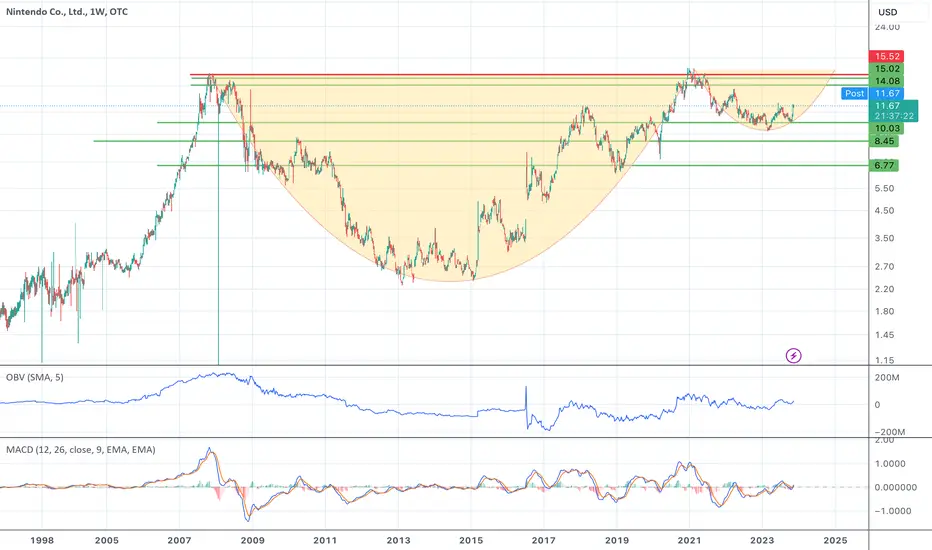
NTDOY - Weekly Cup & Handle I've been tracking this Cup & Handle Pattern on NTDOY for the past few months now. It was respected recently on a weekly timeframe when it tested the $10.03 Support Level. It appears that we are Bull Flagging as we speak, and on another level for the next leg up. If the Cup and Handle successfully closes above $15/16$ on a weekly candlestick. I truthfully believe that we could see anywhere from $20/$25/$30 All-Time Highs.
With the news of the new Zelda Movie releasing, as well as a new Nintendo Game Consol (Switch 2 Possibly?), the fundamentals are lining up with the Technical Analysis thats been done.
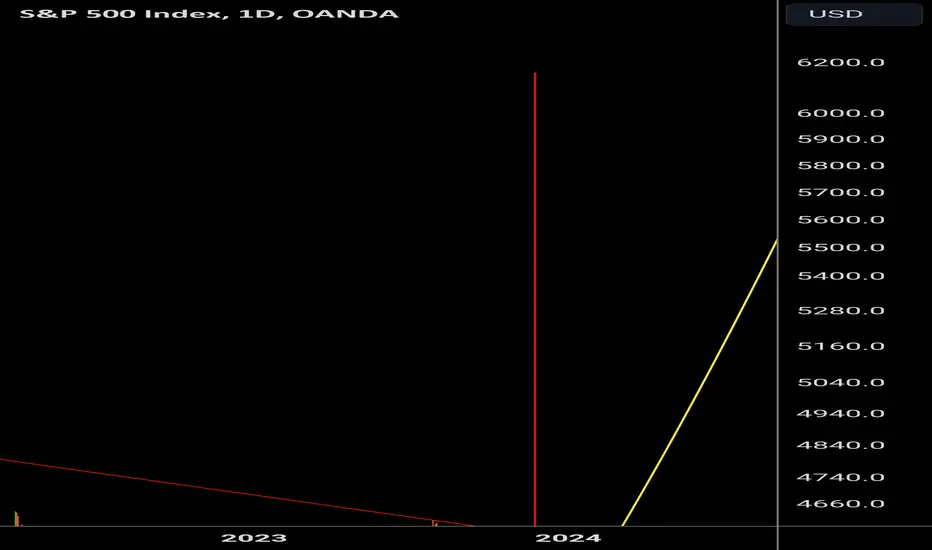
SPX cup and handle pattern. Price target $6,158.It appears to me that the SPX has formed a cup and handle pattern with a measured price target of $6,158.2. It will be interesting to see how this plays out. This is not financial advice, nor is it for your educational purposes. I am simply sharing my ideas to preserve them for myself and get feedback from others.
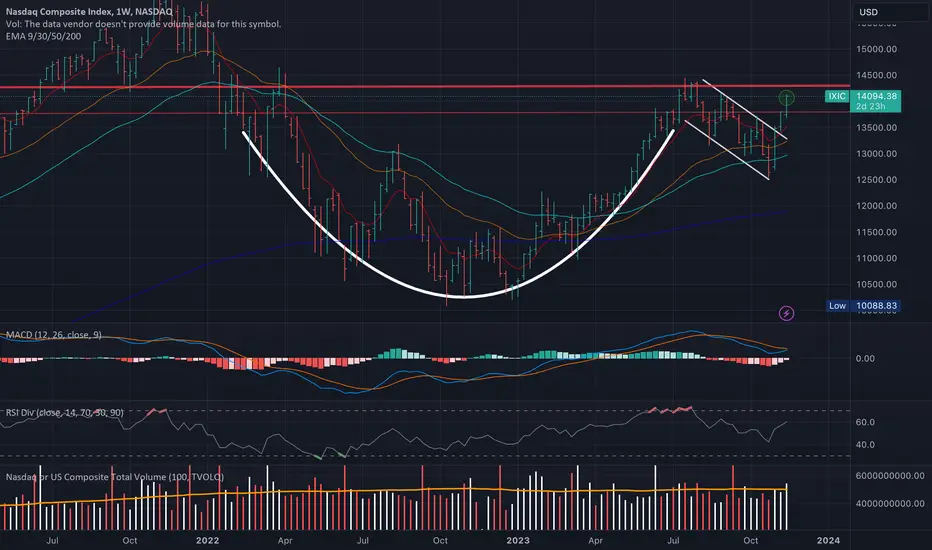
Strong Cup & Handle pattern on the weekly $IXIC chartToday witnessed a robust bullish surge in the Nasdaq with a cup and handle pattern (Very similar on the S&P500 too).
Introduced in 1988 by analyst William O’Neill, the cup and handle pattern signifies a bullish continuation pattern activated by consolidation following a robust upward trend. While the pattern requires time to evolve, its recognition and subsequent trading become relatively straightforward once it materializes. As with all chart patterns, trading volume and supplementary indicators should be employed to validate a breakout and the sustained bullish trajectory.
To validate the pattern, adherence to several rules is imperative:
- The cup with handle pattern must follow a significant bullish movement (Checked: +130% in 87 weeks).
- The lowest trough of the cup must be below 50% of the preceding bullish movement (Checked: -37%).
- The lowest trough of the handle must be below 50% of the cup’s height (checked: -13%).
Key statistics on cup with handle patterns, courtesy of CentralCharts, include:
In 79% of cases, the exit from a cup with handle pattern is bullish.
In 73% of cases, the cup with handle pattern’s price objective is reached (half the cup’s height), after breaking the neck line.
In 74% of cases, after exit, the price makes a pullback in support on the neck line.
In summary, the cup and handle pattern signifies a bullish continuation pattern, initiated by consolidation after a robust upward trend. While its development requires time, once formed, recognition and trading are relatively straightforward. Employing trading volume and additional indicators is crucial for confirming a breakout and sustaining the original bullish price movement.
PS: I think that a perfect cup and handle pattern would be form on the breakout of the 14300 neckline
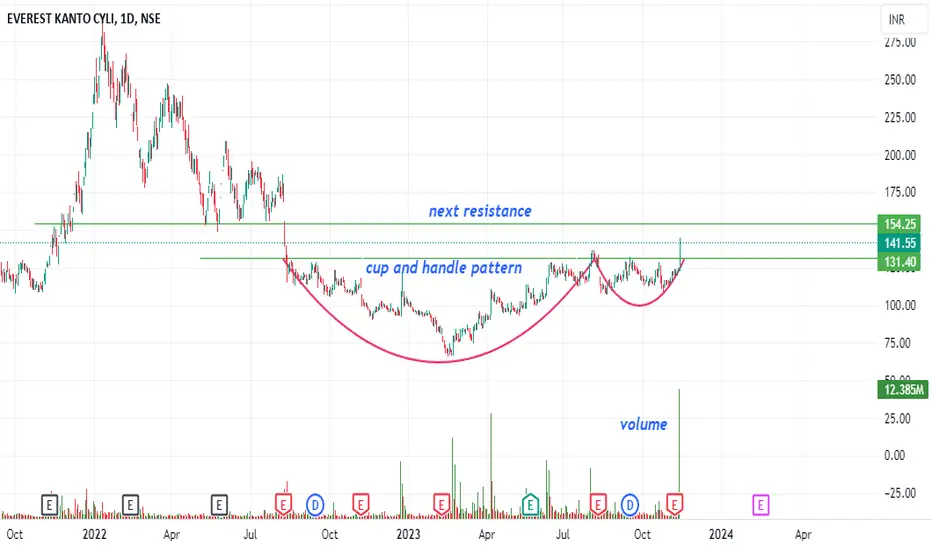
fundamental stockEverest Kanto Cylinder Ltd. (EKC) is engaged in the manufacture of high-pressure seamless gas cylinders along with other cylinders and equipment used for containing and storing natural gas, liquids, and air.
155 is the next resistance for the stock
my target is 180 with stop loss of 115
155 level can achieve in next two sessions.
no recognition for buy and sell
GBP/USD Potential Bullish Reversal - Cup and Handle FormationGBP/USD is currently on the verge of the lower boundary of an upward channel and forming a Cup and Handle pattern, indicating a potential bullish reversal. The entry point may occur after the price successfully breaks and retests the SNR level at 1.23113.
Technical Analysis:
-The Cup and Handle pattern is forming, signaling a potential bullish reversal.
-The price is approaching the lower boundary of the upward channel.
-SNR level at 1.23113 is a critical point for breakout confirmation.
Trade Plan:
-Entry Point: Wait for the price to break and retest the SNR level at 1.23113.
-Stop-Loss: Place a stop-loss below the nearest support level or according to your personal risk tolerance.
-Profit Target: Set a realistic profit target, possibly at the next resistance level (1.25497)
Special Considerations:
-Monitor economic news and fundamental factors that may affect GBP/USD.
-Do not hesitate to exit the trade if there are significant changes in market conditions.

GOOG CUP AND HANDLE PATTERNGreetings, traders! Welcome to another analysis session where we're diving into a promising opportunity. Today, our focus is on a noteworthy asset that has broken above a significant level. Let's delve into the details:
- **Breakout:** 123.26
- **Stops:** ST at 119.69
- **Targets:**
- 62%:
- 147.8%:
- 154.59
Observing the chart, we can discern that the price is currently navigating a distinct phase, forming upper and lower boundaries that shape a rectangle pattern. For those who've been following my analysis, you'll recognize my successful strategies for trading within such rectangle patterns.
As you're here, why not pay a visit to my profile? Your support and engagement are greatly appreciated. Stay connected and don't miss out as we're gearing up to share an array of analyses spanning stocks, futures, and commodities.
Stay tuned for more insights and updates. Your journey with us continues!
Best regards,
TCPLTP

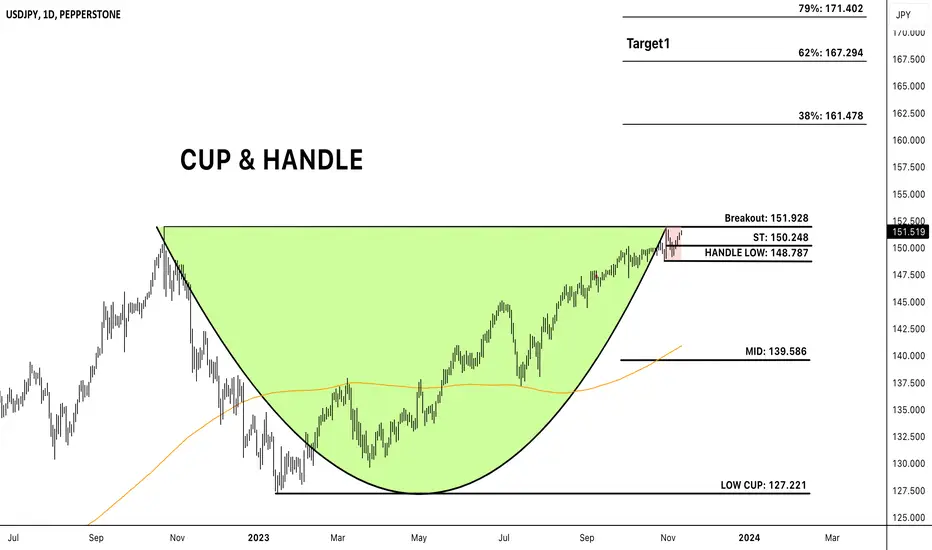
USDJPY CUP AND HANDLE PATTERN Hello traders! Let's explore USDJPY, where a cup and handle pattern has formed on its daily chart. Currently, the price is trading below the breakout level at 151.928. If we observe a breakout above this level, potential targets for this pattern could be:
Targets:
- 62% at 167.294
- 79% at 171.402
Keep a close eye on the price action around these levels, as they represent significant for potential market movements. Stay tuned for further updates on USDJPY!
TCPLTP
Will GOLD go test ATHs?GOLD is showing some clues of possible trend change. If price stays on top of the last highs the price structure changes from making lower highs to making a higher high. This can indicate from a accumulation and growing bull force.
As long as we stay on top of these previous highs I'm short term bull.
Ofc there is also the huge 12 year cup and handle pattern which would indicate of higher prices probably around 24-25. Targets 2500-3000 per ounce (I'm Long Term Bull)
Tell me if you would like a more in depth update about the 12 year GOLD cup and handle structure
-Jebu

ORBS/USDT TRADE SETUP!!Hello everyone, if you like the idea, do not forget to support it with a like and follow.
Welcome to this ORBS/USDT Trade setup.
ORBS looks good here. Breaks out from the symmetrical triangle and also the cup and handle-like structure. Currently, retesting the neckline. Long some here and add more in the dip.
Entry range:- $0.04370-$0.04470
Target1:- $0.049
Target2:- $0.058
Target3:- $0.064
Target4:- $0.070
SL:- $0.041
Buy on the spot or use low-leverage
If you like this idea then do support it with like and follow.
Thank You!

PANTECH Classic Cup and Handle SetupPANTECH showing obvious cup and handle setup. Looking good with recent price and volume action.
Attempt breakout on previous resistance (red line) and experience pull back.
Let's see if able to build a pivot and setup a momentum for solid breakout.
p/s: Good rally on previous sharing for ECOWLD, KPPROP, CAPITALA.

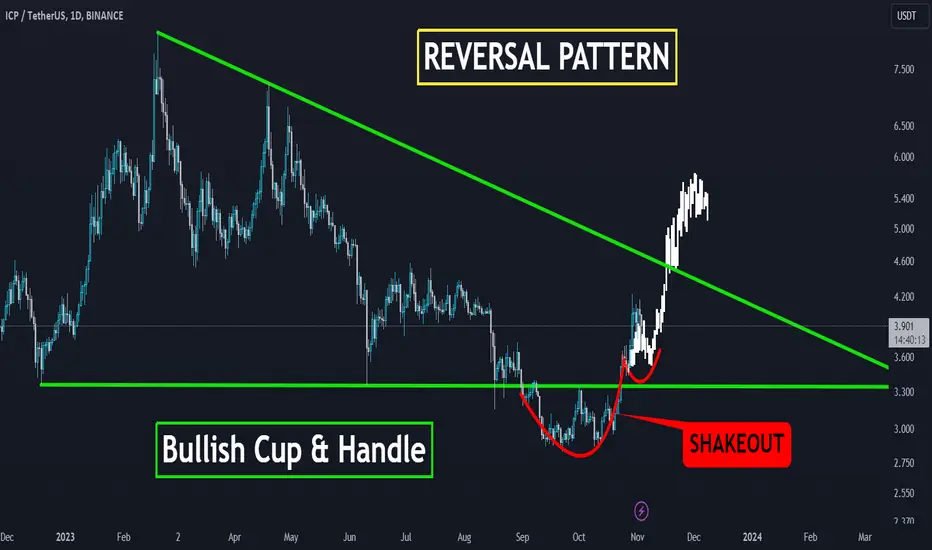
ICP Shakeout Below Pivot: BULLISH🚀 Internet Computer (ICP) has charted a promising course in the crypto waters with a significant breakout pattern – the cup and handle. This bullish setup, combined with a substantial triangle breakout, suggests that ICP is gearing up for a significant uptrend in the near future. 🌐🚀
Setting the Stage: The Triangle Breakout
ICP recently made a notable move by breaking out from a substantial triangle pattern, signifying a potential shift in its price trend. Triangle breakouts are essential indicators of impending price movement, offering traders and investors an opportunity to capitalize on emerging trends.
Cup and Handle: A Bullish Prelude
Adding to this momentum, ICP displayed an intriguing cup and handle formation on its daily chart. The cup and handle pattern is a classic sign of a bullish trend continuation. It reflects a temporary consolidation phase, like sipping from a cup, followed by a strong, upward move, akin to the handle of the cup. This pattern is revered for its potential to push prices higher.
Trading Strategy: Navigating the Crypto Seas
For traders and investors, ICP's recent price action and patterns are noteworthy. It's crucial to observe these developments and consider them as part of a comprehensive trading strategy. Implement effective risk management to navigate the often unpredictable crypto market.
Conclusion: ICP's Voyage Into Bright Waters
Internet Computer (ICP) is embarking on a voyage into brighter waters, marked by a triumphant triangle breakout and a classic cup and handle formation. These patterns signal the potential for bullish price movement in the coming days and weeks.
🚀 Crypto Insights | 💡 Trading Strategies | 💰 Market Analysis
❗See related ideas below❗
Feel free to share your thoughts and insights on ICP's chart developments. . 💚🚀💚
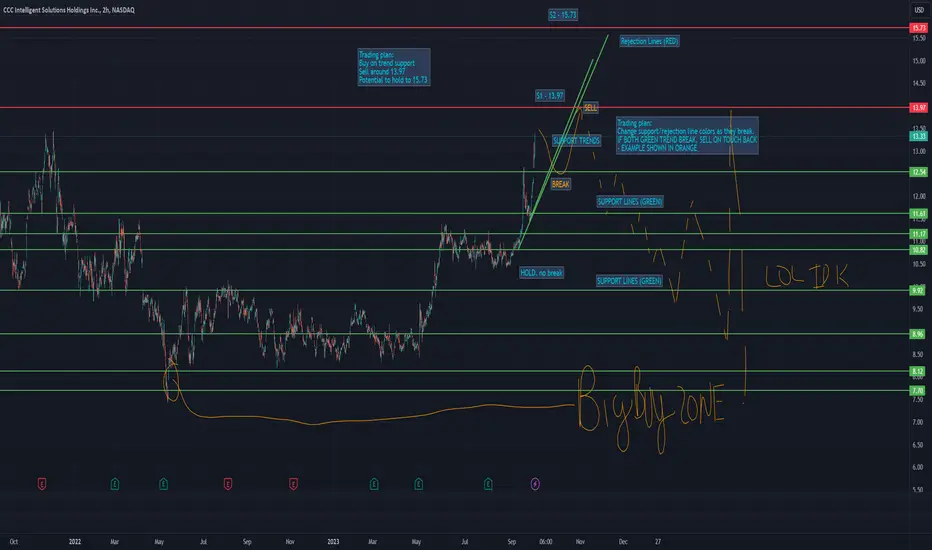
CCC Intelligent Solutions Holding Inc. Moon or BustChart was brought up on my stream today, and I wanted to post a chart. Looks like a nice run-up stock looking for a decent crash that should equal some pretty large percentage losses. Short term parabolic stock, so when those green trends break, the pump is pretty much over, and you'll want to start looking for an exit or short position on the retouch, which looks like it might end up being 13.9, but it's too hard to say right now, as those trends are held up on weak support.
CCC Intelligent Solutions Holding Inc. exhibits promising signs in its current chart analysis. On the daily timeframe, the Relative Strength Index (RSI) is indicating a bullish sentiment, although we haven't detected strong trend momentum yet. However, what makes this chart intriguing is the presence of a potential 'cup and handle' pattern nested within a larger 'cup and handle' formation.
Digging deeper into the 4-hour chart, we find crucial trend support, which has not been breached, and the RSI has yet to cross into bearish territory. This solidifies the foundation for a robust short-to-medium-term outlook.
Furthermore, a notable price gap has been observed at $12.5, providing an interesting point of reference for potential price movement.
The 1-hour RSI suggests a short-term correction may be on the horizon, supported by a subtle emerging trend. This could strengthen our 4-hour trendline, potentially setting the stage for a surge towards the $14 mark, with an optimistic stretch target of $15.72 in the event of favorable developments.
It's essential to note, however, that the 5-minute and 15-minute charts are currently showing signs of being overextended, indicating a need for caution in the short term.
In terms of price targets, we have an upper range of $13.9 to $14.05, while the lower range stands at $8.47 to $7.41. While a maximum price of $18 to $20 is not entirely out of the realm of possibility, it's essential to maintain a realistic perspective, and such levels may not be easily attainable.
In the unlikely event of a significant downturn, the stock could potentially dip below $5. In such a scenario, it's crucial to be prepared for a potential bounce when the drop stabilizes.
Looking ahead to the start of the trading week, should Monday open with a downward movement, it could present a compelling buying opportunity around the $12.54 mark, aligning with the prevailing trend. Such a move would also serve to reset the technical indicators, potentially paving the way for a push towards $14 and beyond.
In conclusion, CCC Intelligent Solutions Holding Inc. holds promise in its chart patterns and technical indicators, making it an interesting stock to watch. As with any investment, prudent risk management is advised, but the potential for exciting price movements in the coming sessions is certainly worth keeping an eye on.
Personally, I don't know if I'll give this stock another look, but I'll try to keep the prices update on my site, should it really start to get away from this chart. But overall, be careful, sell fast, and possibly try to enter a short position, it's a pretty nice setup, with limited but very real risk.
Analysis does not take any fundamentals into account. I've never heard of this company before.
Nick
Yolo to the Moon
Cup with handle
Incorporated in 1998, Allsec Tech is a global leader in outsourcing solutions offering future-ready, resilient business transformation services to industry heavy-weights, Fortune 100 companies, and growth-focused organizations. The services provided by the Company include data verification, processing of orders received through telephone calls, telemarketing, monitoring quality of calls of other call centers, customer services and HR and payroll processing. The Company has delivery centers at Chennai, Bengaluru and NCR.
With 4,000+ FTEs spread across 5 contact centers in the US, Philippines, and India, the company manages over 1 Million customer contacts per day, via multiple touchpoints.

[NASDAQ] Cup & Handle - Long setupNASDAQ is forming a nice Cup & Handle pattern on the daily aiming to find support around the 200d EMA and enough buyers to push the price to ATH.
A similar pattern was seen in the 2009 bottoming process, successfully defending the 200d EMA and resuming the secular bull market.
The same goes for the 2008 failure to hold the 200d EMA giving us a clear invalidation point for our setup
If NASDAQ looses the 200d EMA most likely the bear market will resume

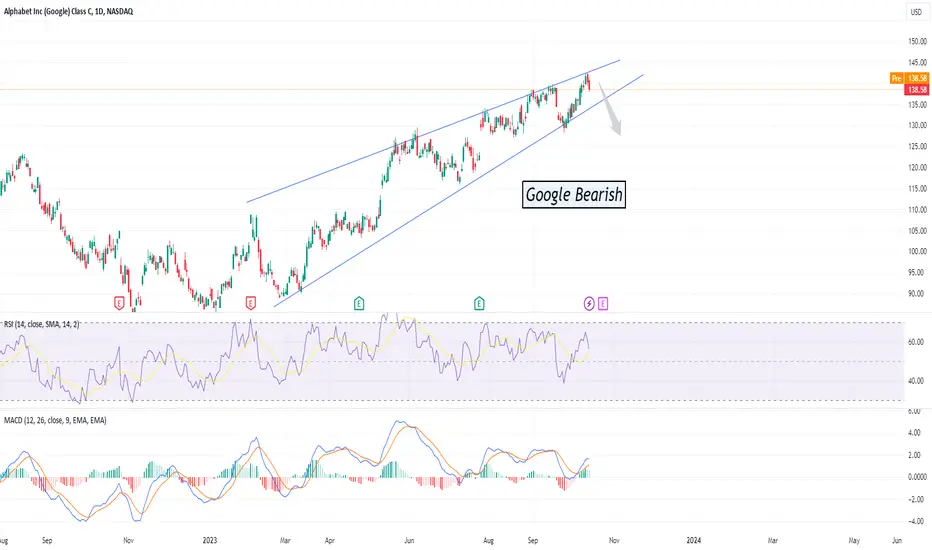
Google Bearish for limited timeChart currently shows Bearish Signal as per the following reasons:
Indicators:
1. Slight Dark Cloud cover indicated
2. Two Black crows, today's trading will indicate if three black crows are confirmed.
3. Slight Bearish divergence
Patterns:
1. Bearish rising wedge on graph - indicates a potential bearish signal
Bullish After Cup and Handle Formation
Although it seems that perhaps the bearish trend may be limited to form a cup and handle pattern, once handle is broken - uptrend to continue.
WABAG - Cup with handle BO NSE:WABAG
As seen on the chart, Va Tech Wabag Ltd has formed a nice U-shaped Cup, and the volume was low when it was forming the handle and the breakout was with a good volume.
There is a high probability that this pattern will be successful.
Disc - invested, for educational purposes only
Another similar setup was with Finolex Cables

FinolexCable Cup and handle formation breakout
NSE:FINCABLES
As seen on the chart, Finolex Cables have formed a nice U-shaped Cup and the handle is also not very deep.
Also, the volume was low when it was forming the handle and the breakout was with a significantly higher volume for the handle.
There is a high probability that this pattern will be successful.
Disc - invested, for educational purposes only.

$TATAPOWER - Cup with handleAs seen on the chart, NSE:TATAPOWER has formed a nice U-shaped Cup,
The stock was in an uptrend before forming Cup (up 27% recent bottom)
Took 51weeks to form the complete pattern.
47 weeks for Cup with a correction of ~25%
4 weeks for Handle with a correction of ~6%
Volume dried up during the first part of the cup.
But was good when coming out of the cup and also at the BO of the handle.
There is a high probability that this pattern will be successful.
With regard to recent results,
Total revenue was INR ~15000 cr, 2% Y-o-Y and 18% Q-o-Q.
EBITDA at 3005 cr, 43% Y-o-Y and -3% Q-o-Q.
PAT at 1141 cr, 29% Y-o-Y and 22% Q-o-Q. (after exceptional items)
15 consecutive quarters of PAT growth (Y-o-Y)
NSE:LEMONTREE 's pattern is still in progress
Disc - invested, for educational purposes only
