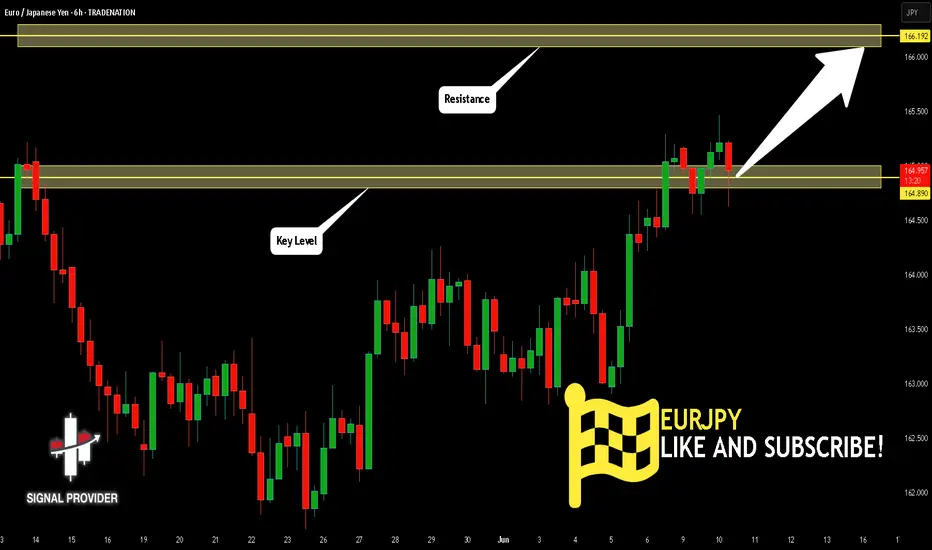
EURJPY Will Go Higher From Support! Buy!
Please, check our technical outlook for EURJPY.
Time Frame: 6h
Current Trend: Bullish
Sentiment: Oversold (based on 7-period RSI)
Forecast: Bullish
The price is testing a key support 164.890.
Current market trend & oversold RSI makes me think that buyers will push the price. I will anticipate a bullish movement at least to 166.192 level.
P.S
Overbought describes a period of time where there has been a significant and consistent upward move in price over a period of time without much pullback.
Disclosure: I am part of Trade Nation's Influencer program and receive a monthly fee for using their TradingView charts in my analysis.
Like and subscribe and comment my ideas if you enjoy them!
Currency
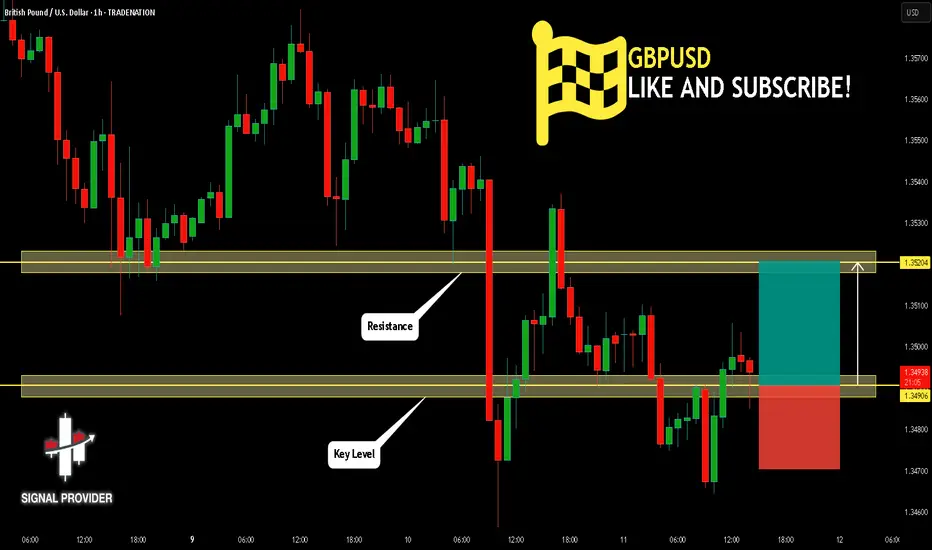
GBPUSD Will Move Higher! Buy!
Take a look at our analysis for GBPUSD.
Time Frame: 1h
Current Trend: Bullish
Sentiment: Oversold (based on 7-period RSI)
Forecast: Bullish
The price is testing a key support 1.349.
Current market trend & oversold RSI makes me think that buyers will push the price. I will anticipate a bullish movement at least to 1.352 level.
P.S
The term oversold refers to a condition where an asset has traded lower in price and has the potential for a price bounce.
Overbought refers to market scenarios where the instrument is traded considerably higher than its fair value. Overvaluation is caused by market sentiments when there is positive news.
Disclosure: I am part of Trade Nation's Influencer program and receive a monthly fee for using their TradingView charts in my analysis.
Like and subscribe and comment my ideas if you enjoy them!
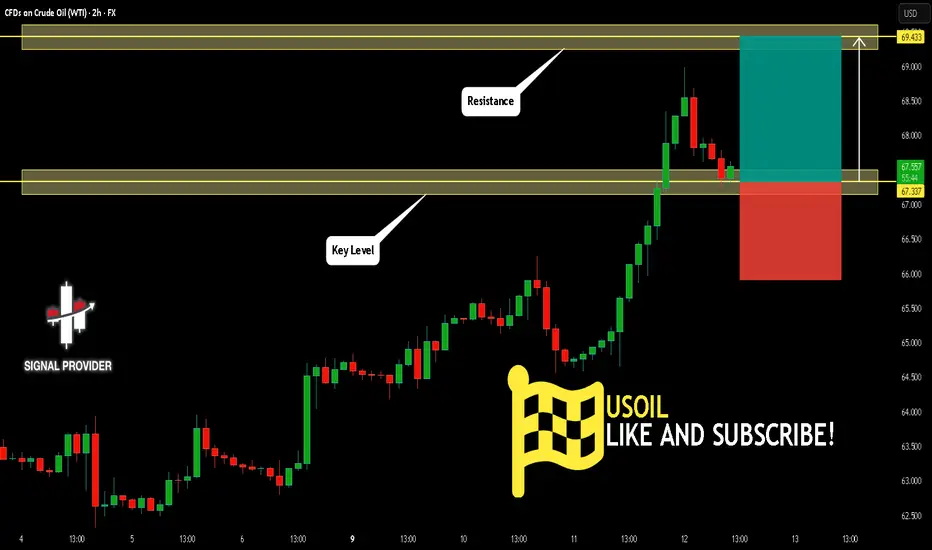
USOIL Will Go Higher From Support! Buy!
Take a look at our analysis for USOIL.
Time Frame: 2h
Current Trend: Bullish
Sentiment: Oversold (based on 7-period RSI)
Forecast: Bullish
The market is testing a major horizontal structure 67.337.
Taking into consideration the structure & trend analysis, I believe that the market will reach 69.433 level soon.
P.S
The term oversold refers to a condition where an asset has traded lower in price and has the potential for a price bounce.
Overbought refers to market scenarios where the instrument is traded considerably higher than its fair value. Overvaluation is caused by market sentiments when there is positive news.
Disclosure: I am part of Trade Nation's Influencer program and receive a monthly fee for using their TradingView charts in my analysis.
Like and subscribe and comment my ideas if you enjoy them!
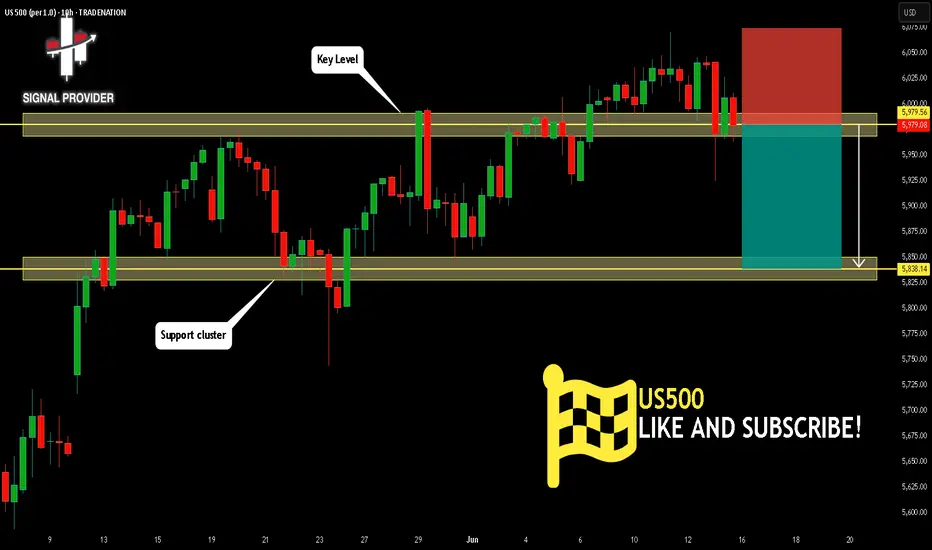
US500 Will Fall! Short!
Here is our detailed technical review for US500.
Time Frame: 10h
Current Trend: Bearish
Sentiment: Overbought (based on 7-period RSI)
Forecast: Bearish
The market is approaching a significant resistance area 5,979.56.
Due to the fact that we see a positive bearish reaction from the underlined area, I strongly believe that sellers will manage to push the price all the way down to 5,838.14 level.
P.S
Overbought describes a period of time where there has been a significant and consistent upward move in price over a period of time without much pullback.
Disclosure: I am part of Trade Nation's Influencer program and receive a monthly fee for using their TradingView charts in my analysis.
Like and subscribe and comment my ideas if you enjoy them!
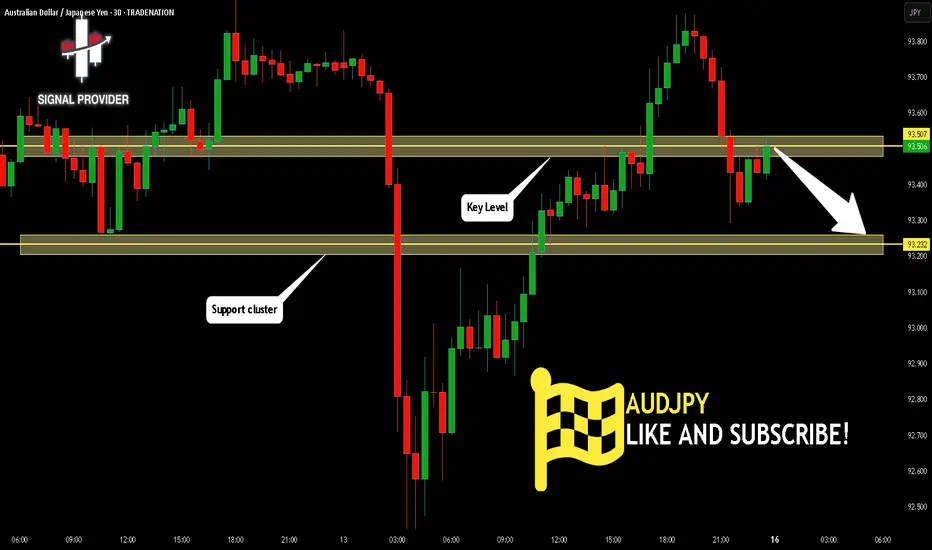
AUDJPY Will Go Lower From Resistance! Sell!
Take a look at our analysis for AUDJPY.
Time Frame: 30m
Current Trend: Bearish
Sentiment: Overbought (based on 7-period RSI)
Forecast: Bearish
The market is on a crucial zone of supply 93.507.
The above-mentioned technicals clearly indicate the dominance of sellers on the market. I recommend shorting the instrument, aiming at 93.232 level.
P.S
Please, note that an oversold/overbought condition can last for a long time, and therefore being oversold/overbought doesn't mean a price rally will come soon, or at all.
Disclosure: I am part of Trade Nation's Influencer program and receive a monthly fee for using their TradingView charts in my analysis.
Like and subscribe and comment my ideas if you enjoy them!
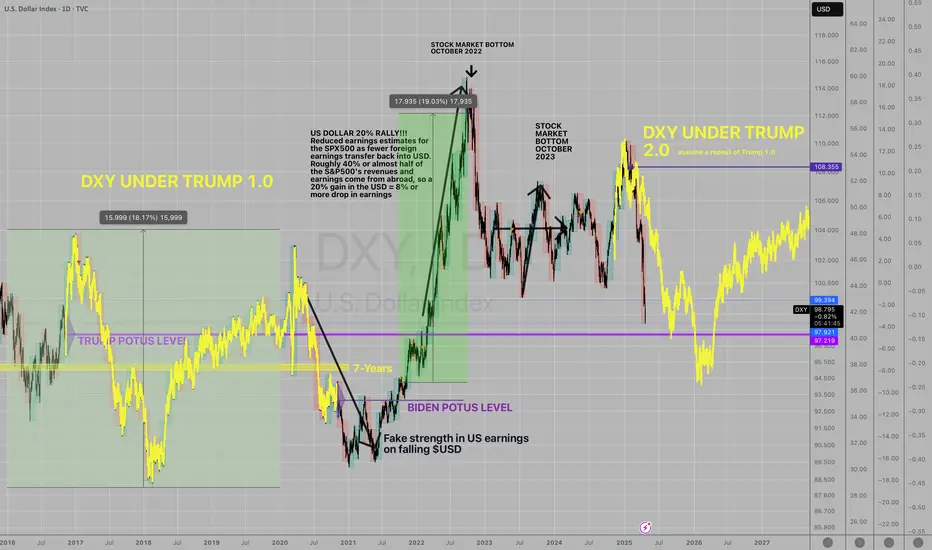
$DXY Repeating 2016 Post-Election I have highlighted the 2016 to 2020 Presidential Elections time period and then pasted that timeframe onto the 2024 election and found that the pattern is going along very similarly to Trump 1.0.
If we assume that the future unfolds the same as last time, which is low probability, of course, then the future will unfold as shown in the yellow bars going into the future, as shown.
Initially in 2016 post election there was a 7% rally in the U.S. Dollar Index and then a 15% retreat for the following year. So far in 2025 we have seen the same rally and a similar decline, but only faster this time.
It would appear as thought the bulk majority of the declines in the TVC:DXY are over at this time with perhaps 4% further downside over the balance of the year.
The Dollar Index has been useful for predicting changes in the earnings estimates for the S&P500 in the USA due to the high percentage of earnings coming back to the US for quarterly reporting. I have posted a few charts in the past which have been helpful at determining the risk in the stock market.
The behavior of the global central banks has certainly had its impact on monetary aggregates and inflation. The policy response since the Covid Pandemic has been for maximum liquidity and maximum Government spending to keep the global economy afloat. The post-Covid response is now coming to a head along with new policy directives to cut wasteful Government spending and to reduce inflation (caused the Gov't spending).
Global investors have flocked to the US for access to high technology stocks and have driven up the value of US assets to extreme levels compared to other markets. This adjustment phase where investors remove money from overvalued, or highly valued, US assets back to other markets has created a wave of selling in the US Dollar and US listed equities.
What does the future hold? We never know but we sure can learn from what happened in the past by looking at charts just like this one to see what may happen. Looks like a bounce in the TVC:DXY from here, followed by a new low and then a rebound into the next few years.
All the best,
Tim
April 22, 2025 1:16PM EST TVC:DXY 98.78 last
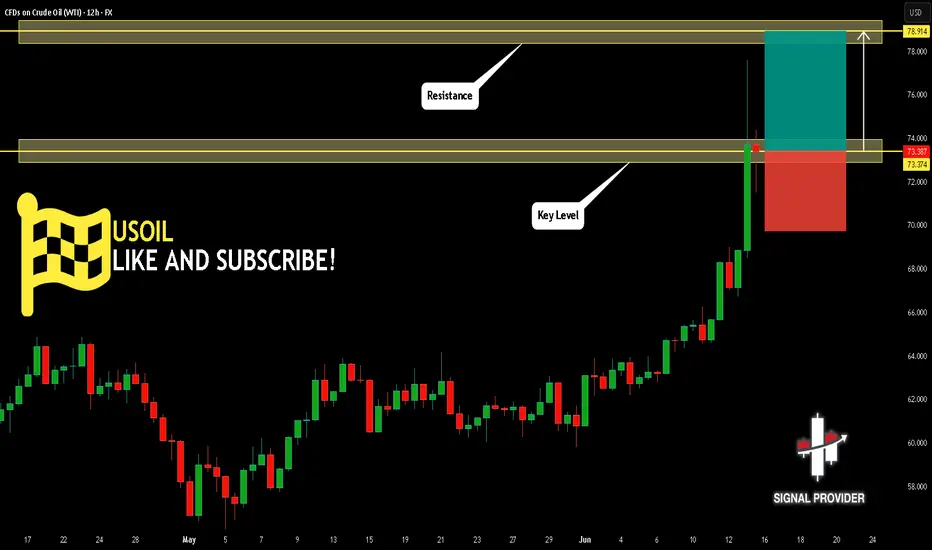
USOIL Will Go Up From Support! Long!
Please, check our technical outlook for USOIL.
Time Frame: 12h
Current Trend: Bullish
Sentiment: Oversold (based on 7-period RSI)
Forecast: Bullish
The price is testing a key support 73.374.
Current market trend & oversold RSI makes me think that buyers will push the price. I will anticipate a bullish movement at least to 78.914 level.
P.S
The term oversold refers to a condition where an asset has traded lower in price and has the potential for a price bounce.
Overbought refers to market scenarios where the instrument is traded considerably higher than its fair value. Overvaluation is caused by market sentiments when there is positive news.
Disclosure: I am part of Trade Nation's Influencer program and receive a monthly fee for using their TradingView charts in my analysis.
Like and subscribe and comment my ideas if you enjoy them!
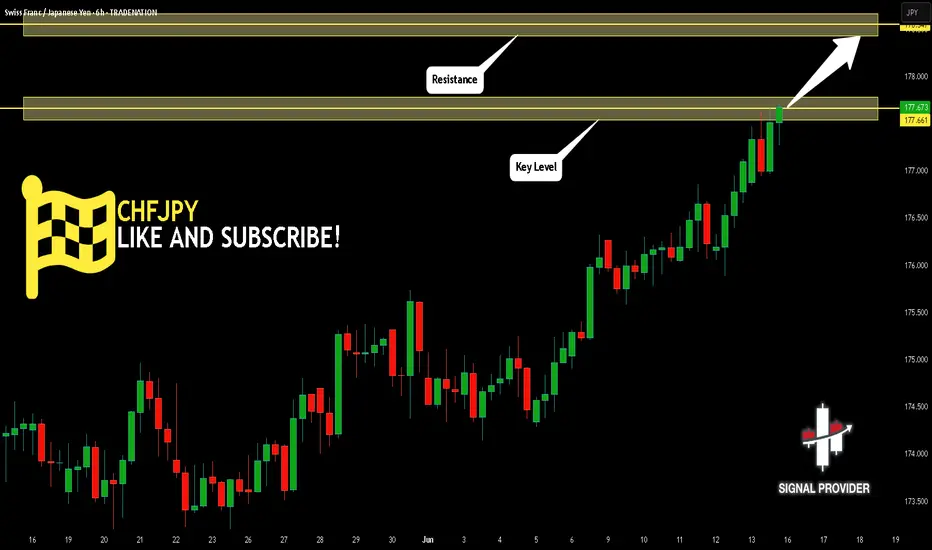
CHFJPY Will Go Higher! Buy!
Here is our detailed technical review for CHFJPY.
Time Frame: 6h
Current Trend: Bullish
Sentiment: Oversold (based on 7-period RSI)
Forecast: Bullish
The market is trading around a solid horizontal structure 177.661.
The above observations make me that the market will inevitably achieve 178.547 level.
P.S
We determine oversold/overbought condition with RSI indicator.
When it drops below 30 - the market is considered to be oversold.
When it bounces above 70 - the market is considered to be overbought.
Disclosure: I am part of Trade Nation's Influencer program and receive a monthly fee for using their TradingView charts in my analysis.
Like and subscribe and comment my ideas if you enjoy them!
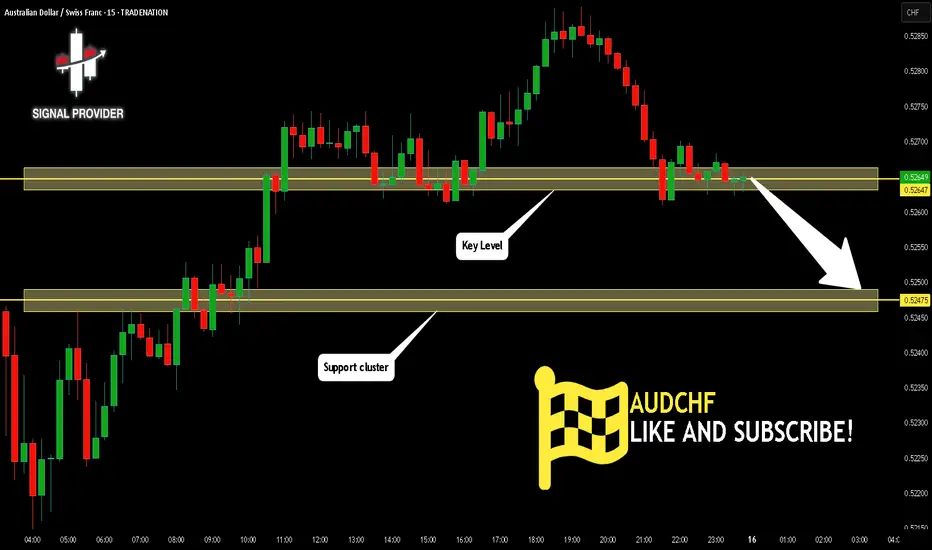
AUDCHF Will Go Down! Short!
Take a look at our analysis for AUDCHF.
Time Frame: 15m
Current Trend: Bearish
Sentiment: Overbought (based on 7-period RSI)
Forecast: Bearish
The market is testing a major horizontal structure 0.526.
Taking into consideration the structure & trend analysis, I believe that the market will reach 0.524 level soon.
P.S
Overbought describes a period of time where there has been a significant and consistent upward move in price over a period of time without much pullback.
Disclosure: I am part of Trade Nation's Influencer program and receive a monthly fee for using their TradingView charts in my analysis.
Like and subscribe and comment my ideas if you enjoy them!
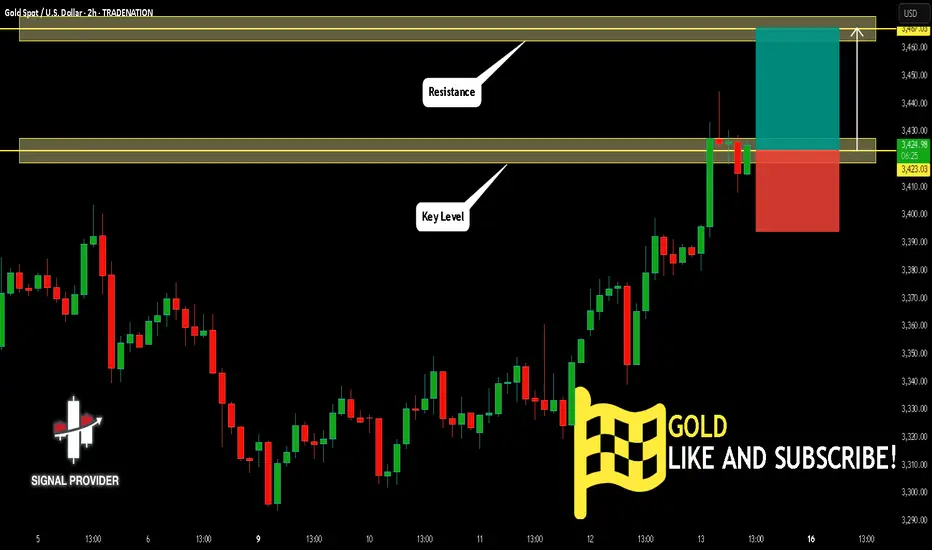
GOLD Will Move Higher! Long!
Please, check our technical outlook for GOLD.
Time Frame: 2h
Current Trend: Bullish
Sentiment: Oversold (based on 7-period RSI)
Forecast: Bullish
The market is approaching a key horizontal level 3,423.03.
Considering the today's price action, probabilities will be high to see a movement to 3,467.03.
P.S
Please, note that an oversold/overbought condition can last for a long time, and therefore being oversold/overbought doesn't mean a price rally will come soon, or at all.
Disclosure: I am part of Trade Nation's Influencer program and receive a monthly fee for using their TradingView charts in my analysis.
Like and subscribe and comment my ideas if you enjoy them!
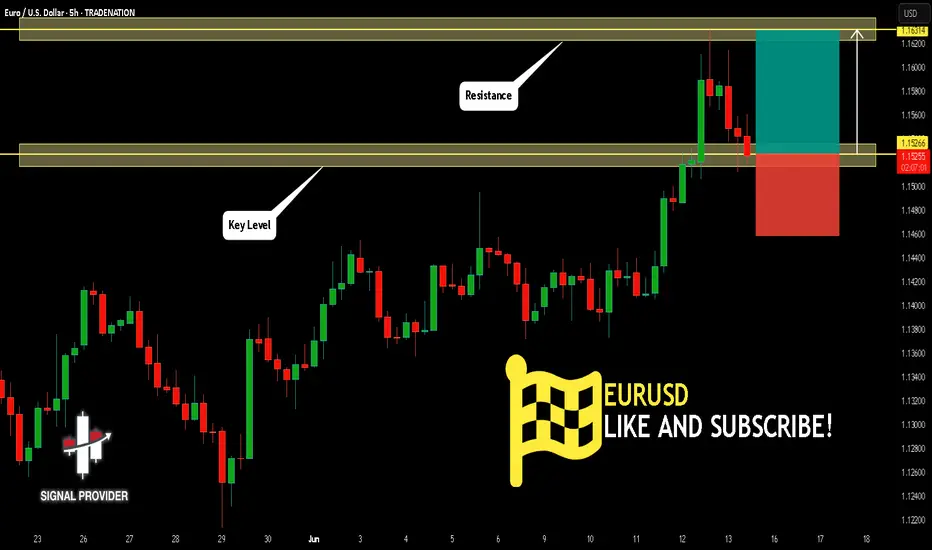
EURUSD Is Bullish! Buy!
Here is our detailed technical review for EURUSD.
Time Frame: 5h
Current Trend: Bullish
Sentiment: Oversold (based on 7-period RSI)
Forecast: Bullish
The market is approaching a significant support area 1.152.
The underlined horizontal cluster clearly indicates a highly probable bullish movement with target 1.163 level.
P.S
The term oversold refers to a condition where an asset has traded lower in price and has the potential for a price bounce.
Overbought refers to market scenarios where the instrument is traded considerably higher than its fair value. Overvaluation is caused by market sentiments when there is positive news.
Disclosure: I am part of Trade Nation's Influencer program and receive a monthly fee for using their TradingView charts in my analysis.
Like and subscribe and comment my ideas if you enjoy them!
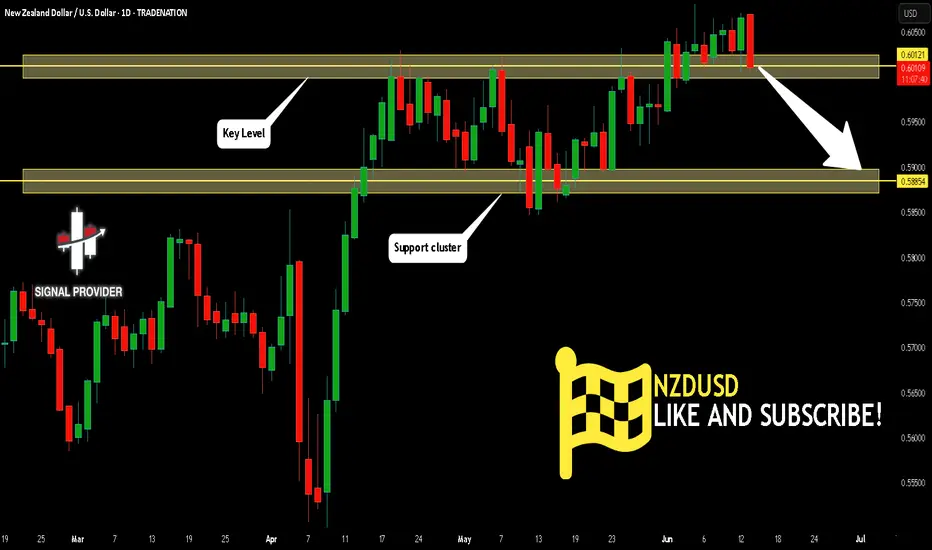
NZDUSD Is Very Bearish! Short!
Take a look at our analysis for NZDUSD.
Time Frame: 1D
Current Trend: Bearish
Sentiment: Overbought (based on 7-period RSI)
Forecast: Bearish
The market is on a crucial zone of supply 0.601.
The above-mentioned technicals clearly indicate the dominance of sellers on the market. I recommend shorting the instrument, aiming at 0.588 level.
P.S
We determine oversold/overbought condition with RSI indicator.
When it drops below 30 - the market is considered to be oversold.
When it bounces above 70 - the market is considered to be overbought.
Disclosure: I am part of Trade Nation's Influencer program and receive a monthly fee for using their TradingView charts in my analysis.
Like and subscribe and comment my ideas if you enjoy them!
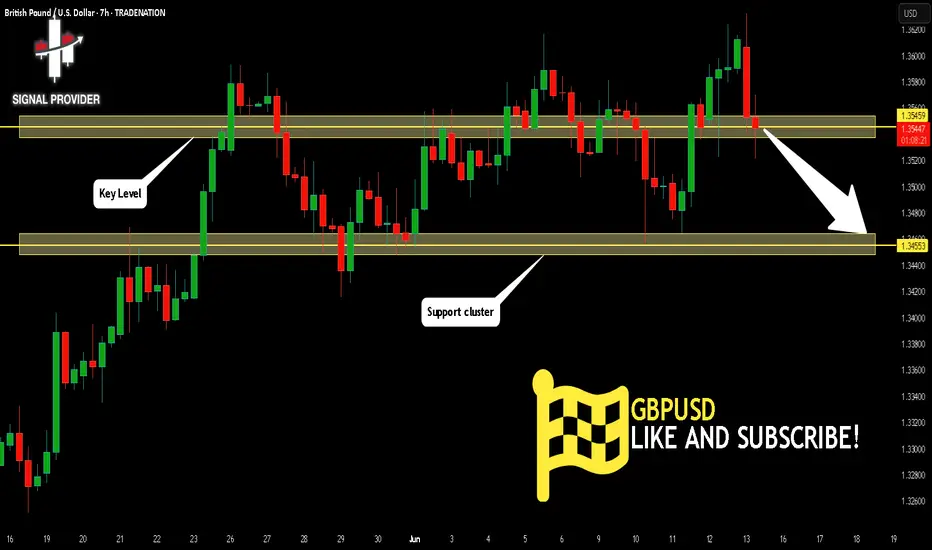
GBPUSD Is Going Down! Sell!
Please, check our technical outlook for GBPUSD.
Time Frame: 7h
Current Trend: Bearish
Sentiment: Overbought (based on 7-period RSI)
Forecast: Bearish
The price is testing a key resistance 1.354.
Taking into consideration the current market trend & overbought RSI, chances will be high to see a bearish movement to the downside at least to 1.345 level.
P.S
Overbought describes a period of time where there has been a significant and consistent upward move in price over a period of time without much pullback.
Disclosure: I am part of Trade Nation's Influencer program and receive a monthly fee for using their TradingView charts in my analysis.
Like and subscribe and comment my ideas if you enjoy them!
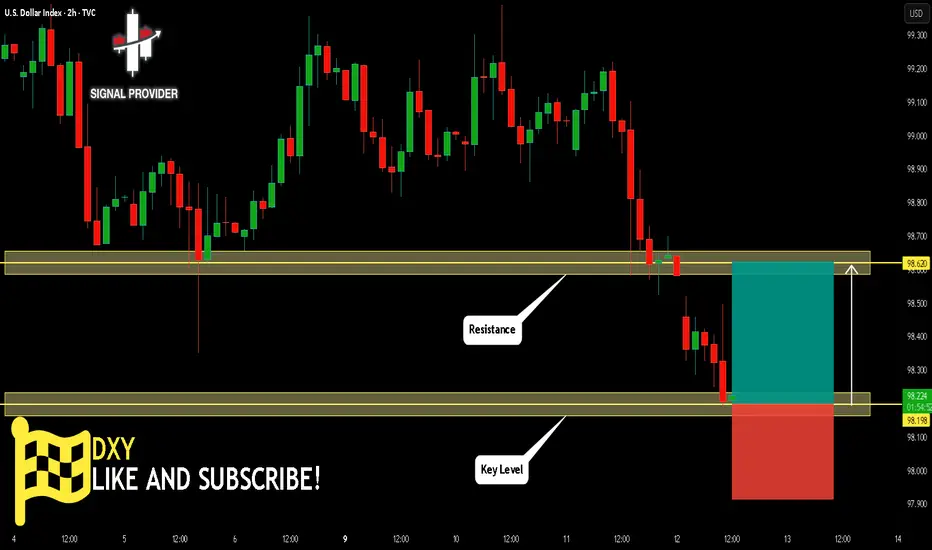
DXY Will Grow! Long!
Here is our detailed technical review for DXY.
Time Frame: 2h
Current Trend: Bullish
Sentiment: Oversold (based on 7-period RSI)
Forecast: Bullish
The market is trading around a solid horizontal structure 98.198.
The above observations make me that the market will inevitably achieve 98.620 level.
P.S
Please, note that an oversold/overbought condition can last for a long time, and therefore being oversold/overbought doesn't mean a price rally will come soon, or at all.
Disclosure: I am part of Trade Nation's Influencer program and receive a monthly fee for using their TradingView charts in my analysis.
Like and subscribe and comment my ideas if you enjoy them!
USDJPY Will Go Up From Support! Long!
Please, check our technical outlook for USDJPY.
Time Frame: 1h
Current Trend: Bullish
Sentiment: Oversold (based on 7-period RSI)
Forecast: Bullish
The market is approaching a key horizontal level 143.827.
Considering the today's price action, probabilities will be high to see a movement to 144.499.
P.S
We determine oversold/overbought condition with RSI indicator.
When it drops below 30 - the market is considered to be oversold.
When it bounces above 70 - the market is considered to be overbought.
Disclosure: I am part of Trade Nation's Influencer program and receive a monthly fee for using their TradingView charts in my analysis.
Like and subscribe and comment my ideas if you enjoy them!

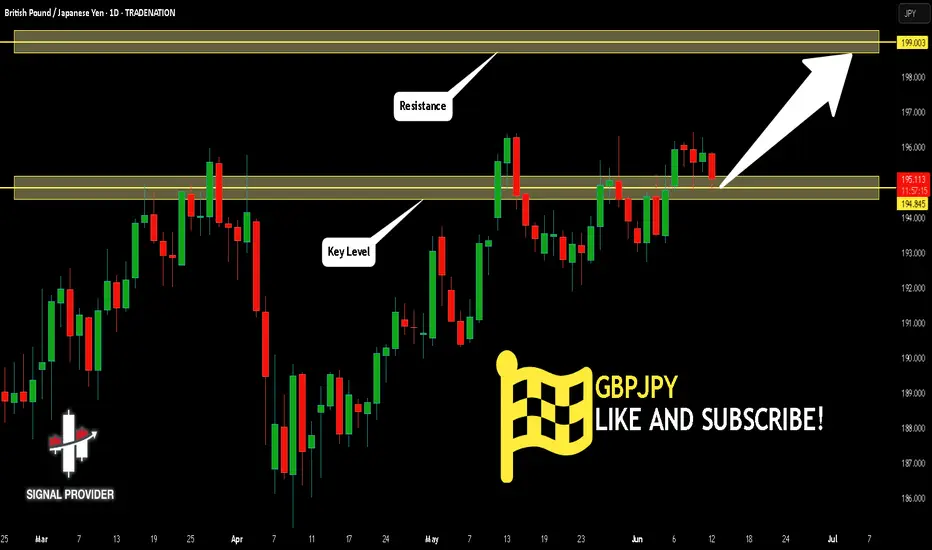
GBPJPY Will Go Higher! Buy!
Here is our detailed technical review for GBPJPY.
Time Frame: 1D
Current Trend: Bullish
Sentiment: Oversold (based on 7-period RSI)
Forecast: Bullish
The market is approaching a significant support area 194.845.
The underlined horizontal cluster clearly indicates a highly probable bullish movement with target 199.003 level.
P.S
Overbought describes a period of time where there has been a significant and consistent upward move in price over a period of time without much pullback.
Disclosure: I am part of Trade Nation's Influencer program and receive a monthly fee for using their TradingView charts in my analysis.
Like and subscribe and comment my ideas if you enjoy them!
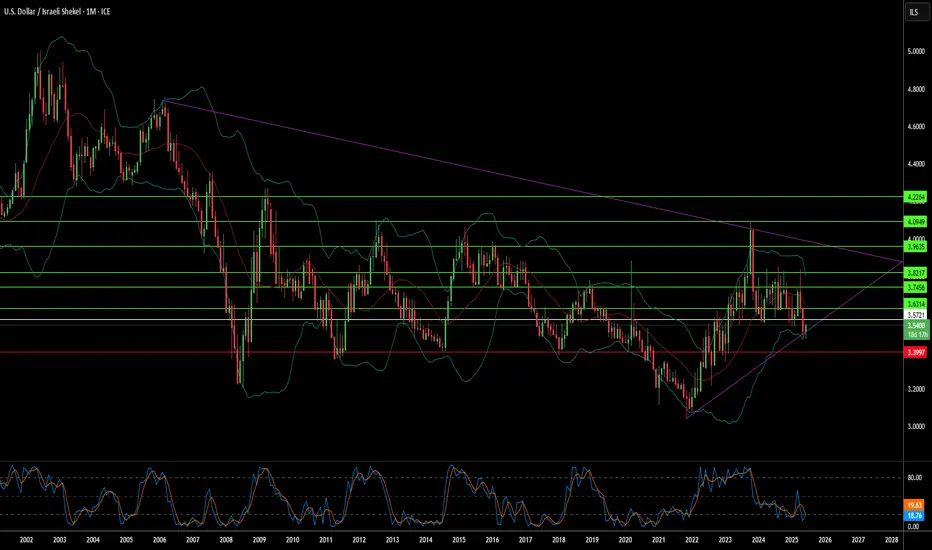
Uncertainty: The Dollar's Unexpected Ally?The recent strengthening of the US dollar (USD) against the Israeli shekel (ILS) serves as a potent illustration of the dollar's enduring role as a safe-haven currency amid heightened geopolitical uncertainty. This trend is particularly pronounced in the context of escalating tensions involving Iran, Israel, and the United States. Investors consistently gravitate towards the perceived stability of the dollar during periods of global unrest, leading to its appreciation against more volatile and susceptible currencies, such as the shekel.
A significant driver of this dollar demand stems from the precarious security landscape in the Middle East. Reports detailing Israel's potential operation into Iran, coupled with the United States' proactive measures like authorizing voluntary departures of military dependents and preparing for a partial evacuation of its Baghdad embassy, signal Washington's anticipation of potential Iranian retaliation. Assertive declarations from Iranian officials, explicitly threatening US military bases and claiming intelligence on Israeli nuclear facilities, further amplify regional risks, compelling investors to seek the dollar's perceived safety.
Compounding this geopolitical volatility is the stalled US-Iran nuclear diplomacy. Hurdles persist not only over core issues, such as uranium enrichment and sanctions relief, but also over the basic scheduling of talks, with both sides expressing diminishing confidence in a resolution. The recent International Atomic Energy Agency (IAEA) Board of Governors meeting, where the US and European allies introduced a non-compliance resolution against Iran, adds another layer of diplomatic tension, threatening increased sanctions or nuclear expansion and reinforcing the perception of a volatile environment that inherently strengthens the dollar.
These escalating tensions have tangible economic repercussions, further fueling investor flight to safety. The immediate aftermath has seen a significant increase in oil prices due to anticipated supply disruptions and a notable depreciation of the Iranian rial against the dollar. Warnings from maritime authorities regarding increased military activity in critical waterways also reflect broad market apprehension. During such periods of instability, capital naturally flows into assets perceived as low-risk, making the US dollar, backed by the world's largest economy and its status as a global reserve currency, the primary beneficiary. This flight-to-safety dynamic during major regional conflicts involving key global players consistently bolsters the dollar's value.
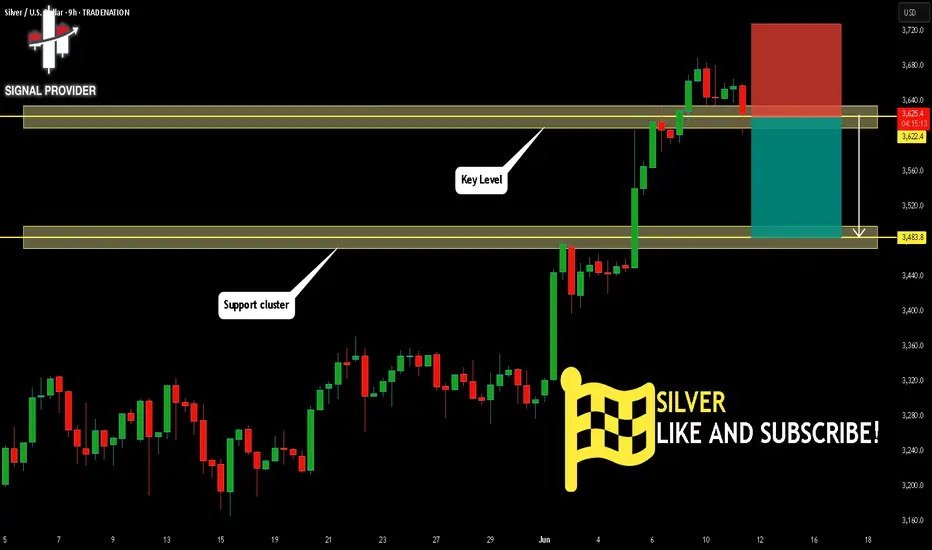
SILVER Will Go Down! Short!
Take a look at our analysis for SILVER.
Time Frame: 9h
Current Trend: Bearish
Sentiment: Overbought (based on 7-period RSI)
Forecast: Bearish
The market is on a crucial zone of supply 3,622.4.
The oversold market condition in a combination with key structure gives us a relatively strong bullish signal with goal 3,483.8 level.
P.S
Please, note that an oversold/overbought condition can last for a long time, and therefore being oversold/overbought doesn't mean a price rally will come soon, or at all.
Disclosure: I am part of Trade Nation's Influencer program and receive a monthly fee for using their TradingView charts in my analysis.
Like and subscribe and comment my ideas if you enjoy them!
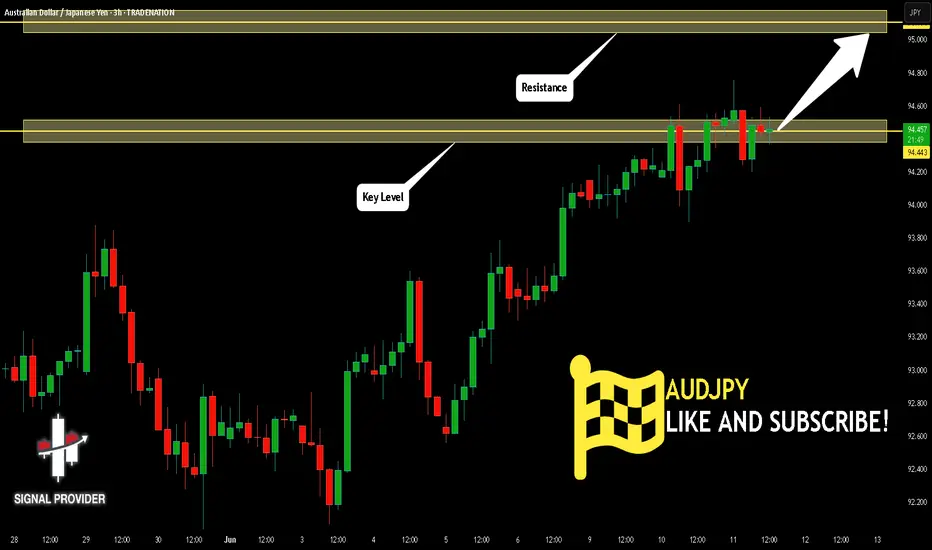
AUDJPY Is Bullish! Long!
Here is our detailed technical review for AUDJPY.
Time Frame: 3h
Current Trend: Bullish
Sentiment: Oversold (based on 7-period RSI)
Forecast: Bullish
The market is trading around a solid horizontal structure 94.443.
The above observations make me that the market will inevitably achieve 95.104 level.
P.S
We determine oversold/overbought condition with RSI indicator.
When it drops below 30 - the market is considered to be oversold.
When it bounces above 70 - the market is considered to be overbought.
Disclosure: I am part of Trade Nation's Influencer program and receive a monthly fee for using their TradingView charts in my analysis.
Like and subscribe and comment my ideas if you enjoy them!
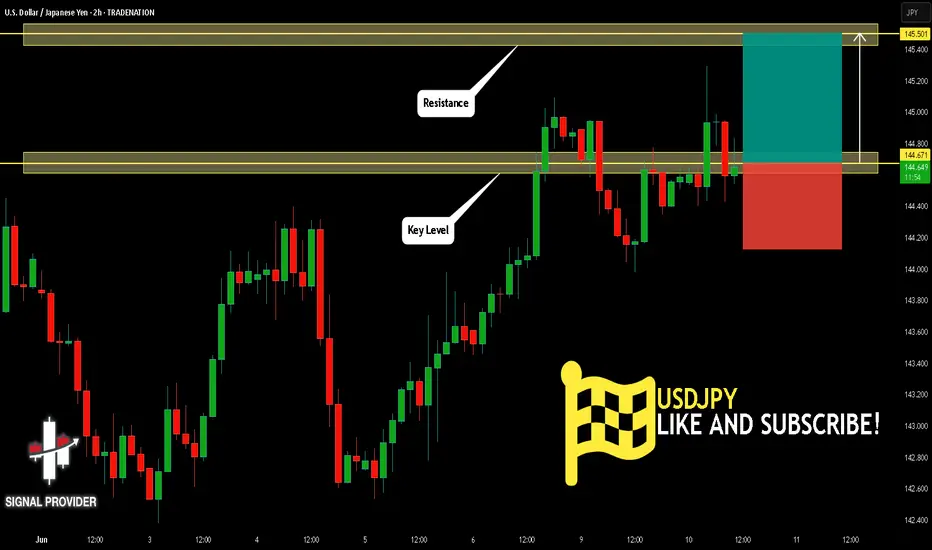
USDJPY Is Going Up! Long!
Here is our detailed technical review for USDJPY.
Time Frame: 2h
Current Trend: Bullish
Sentiment: Oversold (based on 7-period RSI)
Forecast: Bullish
The market is approaching a significant support area 144.671.
The underlined horizontal cluster clearly indicates a highly probable bullish movement with target 145.501 level.
P.S
The term oversold refers to a condition where an asset has traded lower in price and has the potential for a price bounce.
Overbought refers to market scenarios where the instrument is traded considerably higher than its fair value. Overvaluation is caused by market sentiments when there is positive news.
Disclosure: I am part of Trade Nation's Influencer program and receive a monthly fee for using their TradingView charts in my analysis.
Like and subscribe and comment my ideas if you enjoy them!
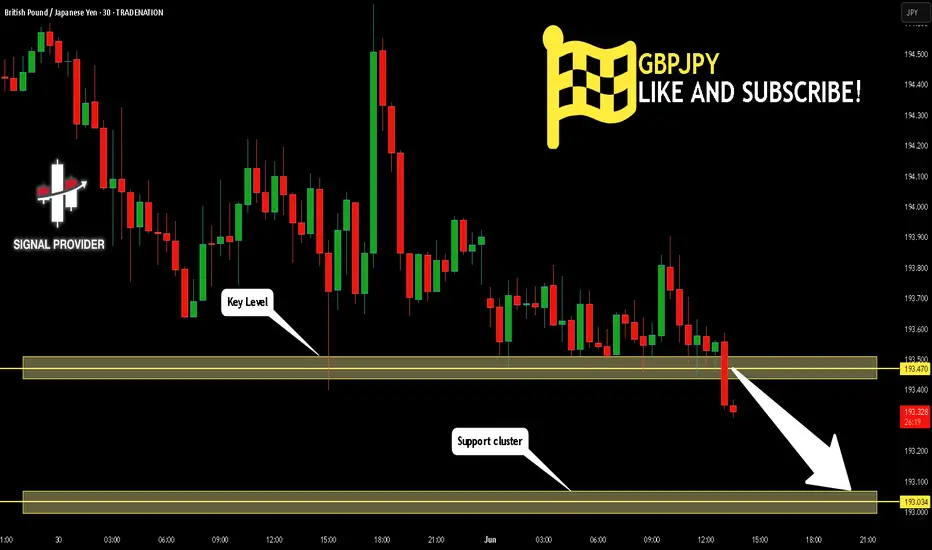
GBPJPY Is Very Bearish! Sell!
Take a look at our analysis for GBPJPY.
Time Frame: 30m
Current Trend: Bearish
Sentiment: Overbought (based on 7-period RSI)
Forecast: Bearish
The market is on a crucial zone of supply 193.470.
The above-mentioned technicals clearly indicate the dominance of sellers on the market. I recommend shorting the instrument, aiming at 193.034 level.
P.S
Please, note that an oversold/overbought condition can last for a long time, and therefore being oversold/overbought doesn't mean a price rally will come soon, or at all.
Disclosure: I am part of Trade Nation's Influencer program and receive a monthly fee for using their TradingView charts in my analysis.
Like and subscribe and comment my ideas if you enjoy them!
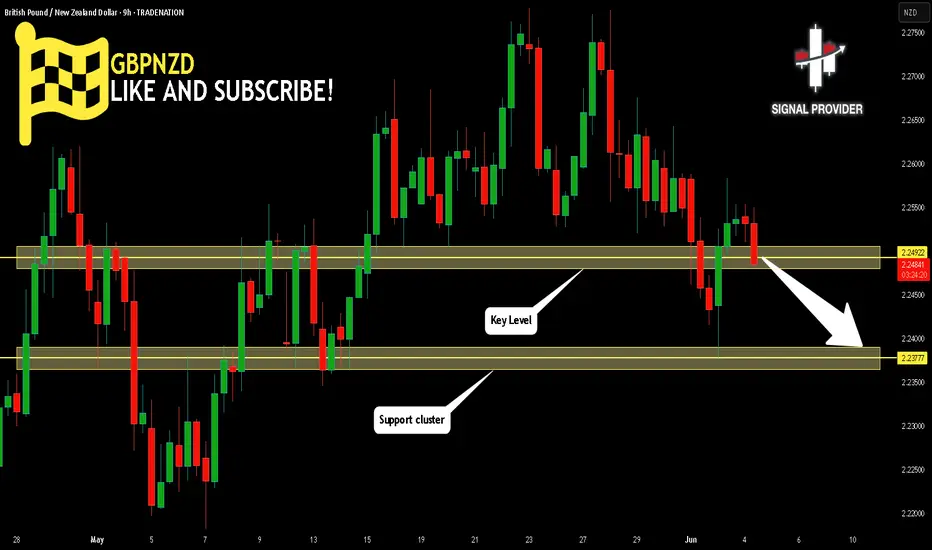
GBPNZD Is Going Down! Sell!
Please, check our technical outlook for GBPNZD.
Time Frame: 9h
Current Trend: Bearish
Sentiment: Overbought (based on 7-period RSI)
Forecast: Bearish
The market is approaching a key horizontal level 2.249.
Considering the today's price action, probabilities will be high to see a movement to 2.237.
P.S
Please, note that an oversold/overbought condition can last for a long time, and therefore being oversold/overbought doesn't mean a price rally will come soon, or at all.
Disclosure: I am part of Trade Nation's Influencer program and receive a monthly fee for using their TradingView charts in my analysis.
Like and subscribe and comment my ideas if you enjoy them!
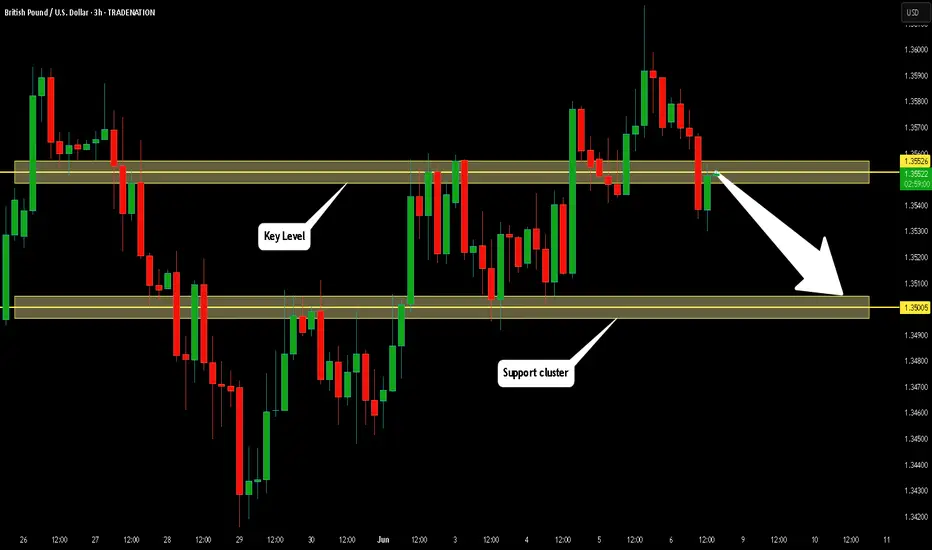
GBPUSD Is Very Bearish! Short!
Please, check our technical outlook for GBPUSD.
Time Frame: 3h
Current Trend: Bearish
Sentiment: Overbought (based on 7-period RSI)
Forecast: Bearish
The price is testing a key resistance 1.355.
Taking into consideration the current market trend & overbought RSI, chances will be high to see a bearish movement to the downside at least to 1.350 level.
P.S
Overbought describes a period of time where there has been a significant and consistent upward move in price over a period of time without much pullback.
Disclosure: I am part of Trade Nation's Influencer program and receive a monthly fee for using their TradingView charts in my analysis.
Like and subscribe and comment my ideas if you enjoy them!