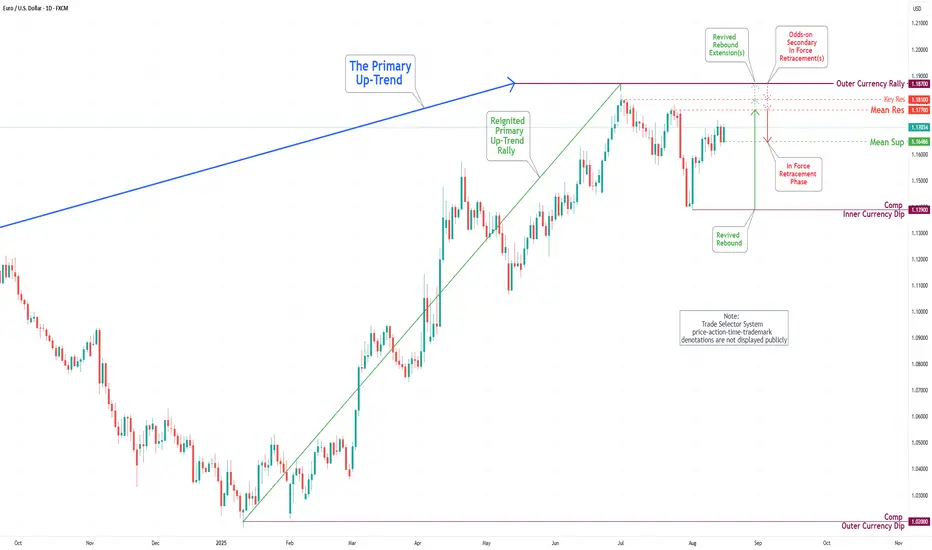
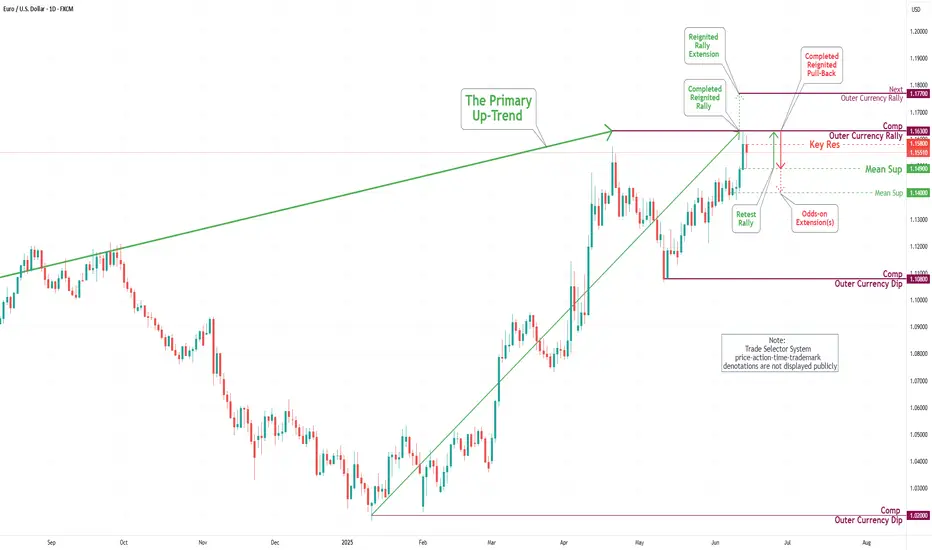
EUR/USD Daily Chart Analysis For Week of August 15, 2025Technical Analysis and Outlook:
During the last trading session, the Euro demonstrated a notable increase, retesting the Mean Resistance level of 1.169. Recent analyses suggest that the primary targets for the Euro are the Mean Resistance level of 1.177 and the Key Resistance level of 1.181, in addition to the Outer Currency Rally target of 1.187. Such movements may precipitate a considerable pullback before the upward trajectory resumes.
Currencytrading
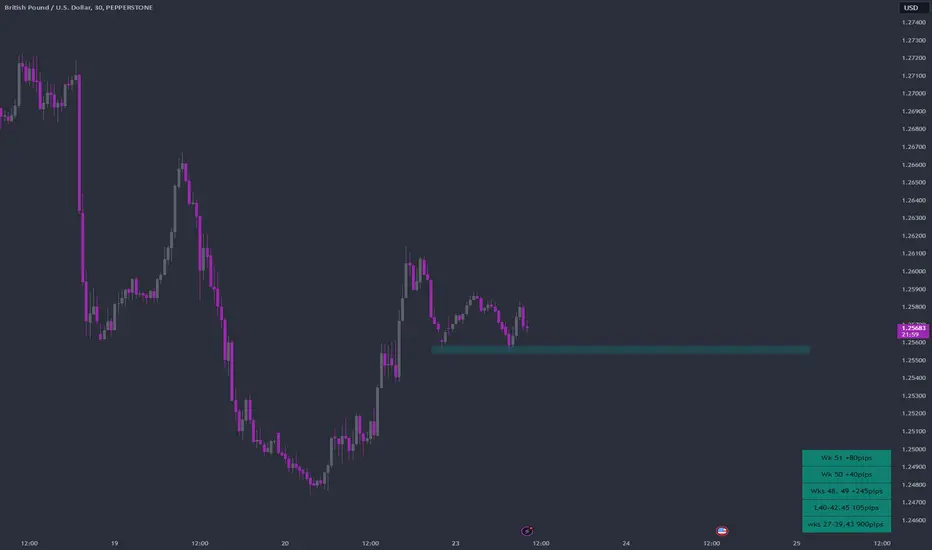
GBP/USD Professional Analysis – “Trap Trigger at Support”GBP/USD Professional Analysis – “Trap Trigger at Support”
📈 Market Overview:
• Pair: GBP/USD
• Timeframe: Likely 1H or 2H based on candle spacing
• Date: July 28, 2025
• Current Price: 1.33529
⸻
🔍 Technical Breakdown
🔴 Resistance Zone: 1.35800 – 1.36200
• Strong supply area where the last bullish impulse failed.
• Price got rejected hard, initiating a new downtrend.
• Sell-side pressure was confirmed with Supertrend turning red.
🟤 Support Zone: 1.32860 – 1.33400
• Major demand area where price previously reversed sharply.
• Currently being tested again after a clean sweep into the Trap Trigger zone.
⚠ Trap Trigger Zone (Liquidity Sweep Area):
• Price wicked just below support, tapping into a low-volume/high-liquidity area.
• This wick likely cleared sell-side liquidity and trapped breakout sellers.
• Followed by a bullish rejection wick, implying smart money accumulation.
⸻
🛠 Indicators & Tools:
• Supertrend (10,3): Currently red, indicating short-term bearish momentum.
• However, if price closes above 1.34032 (Supertrend level), it could flip bullish.
• Volume Profile (VRVP):
• Low-volume node under support suggests a quick “stop hunt” move, not genuine selling.
• High-volume acceptance area sits higher, near 1.34500–1.35000.
⸻
🎯 Forecast:
🔴 Bearish Invalidations:
• Price closing below 1.32860 with volume would invalidate this setup.
• That could signal continuation to deeper liquidity (1.32500 or below).
⸻
🧠 Smart Money Perspective:
• Liquidity engineered beneath support
• Trap Trigger activated — ideal for institutional reversal setups
• This is a classic “Stop Hunt → Reclaim → Expand” model

EUR/USD Daily Chart Analysis For Week of July 18, 2025Technical Analysis and Outlook:
In the current trading session, the Euro has continued its decline, completing our Mean Support level of 1.160. Recent analyses indicate that the Euro is likely to experience a sustained downward trend, with an anticipated retest at the Mean Support level of 1.159 and a possible further decline to reach a Currency Dip of 1.152. Nevertheless, it is crucial to consider the potential for a dead-cat bounce toward the Mean Resistance level of 1.167, which could trigger a significant reversal of the downtrend and target a Currency Dip of 1.152.

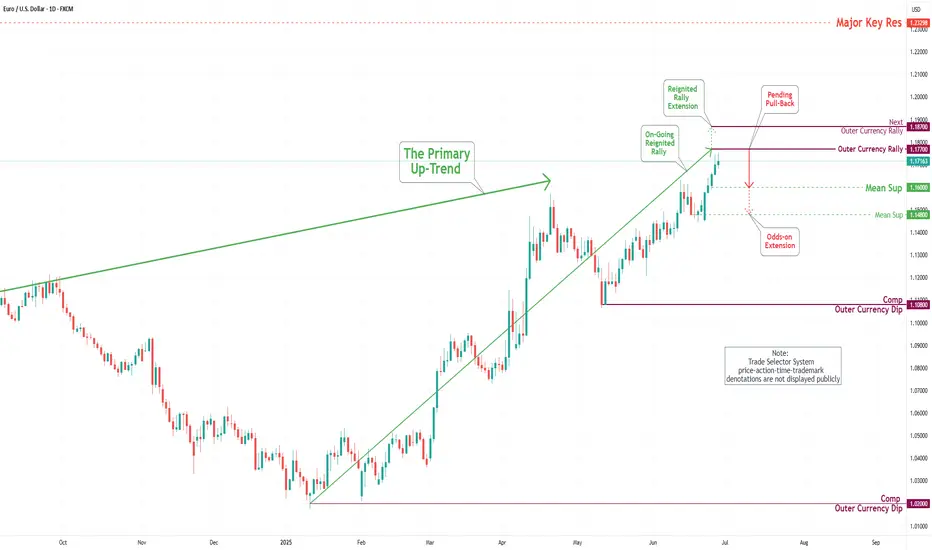
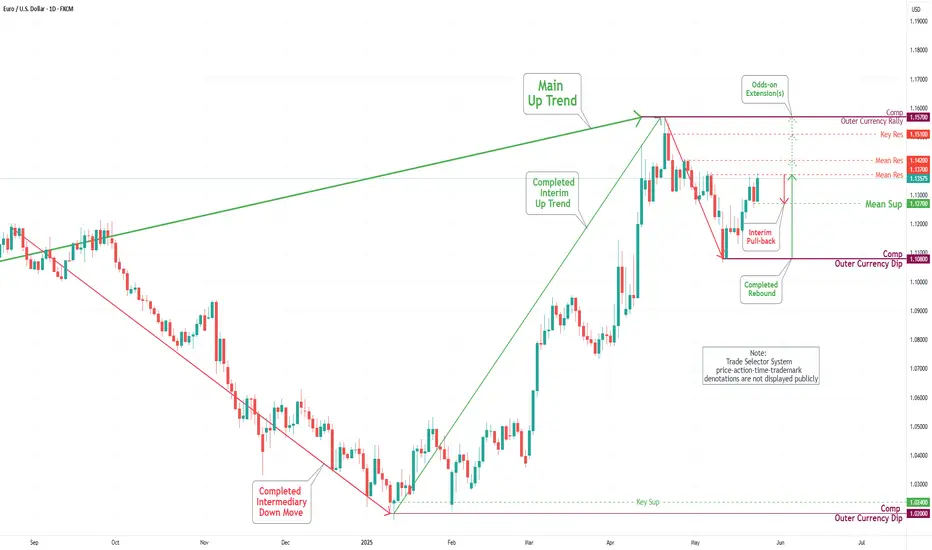
EUR/USD Daily Chart Analysis For Week of June 27, 2025Technical Analysis and Outlook:
In the course of this week's trading session, the Eurodollar has exhibited a strong rebound, successfully retesting and surpassing the Outer Currency Rally threshold of 1.163. Recent analyses suggest that the Euro is poised for further upward advancement, with the key target to reach the outer currency rally target of 1.177. Nonetheless, it is essential to recognize the possibility of a subsequent decline to the Mean Support level of 1.160 before a definitive upward movement.
EUR/USD Daily Chart Analysis For Week of June 20, 2025Technical Analysis and Outlook:
During this week's trading session, the Eurodollar has encountered a significant decline, dipping below the Mean Support level of 1.149; however, it exhibited a modest recovery on Friday. Recent analyses indicate that the Euro is likely to decrease further to the Mean Support level of 1.148, with the potential for extending its bearish trend to reach 1.140. Nevertheless, there remains a possibility that the current recovery will persist, which could result in price movements targeting the Key Resistance level at 1.158 and potentially leading to a retest of the Outer Currency Rally's 1.163 mark.
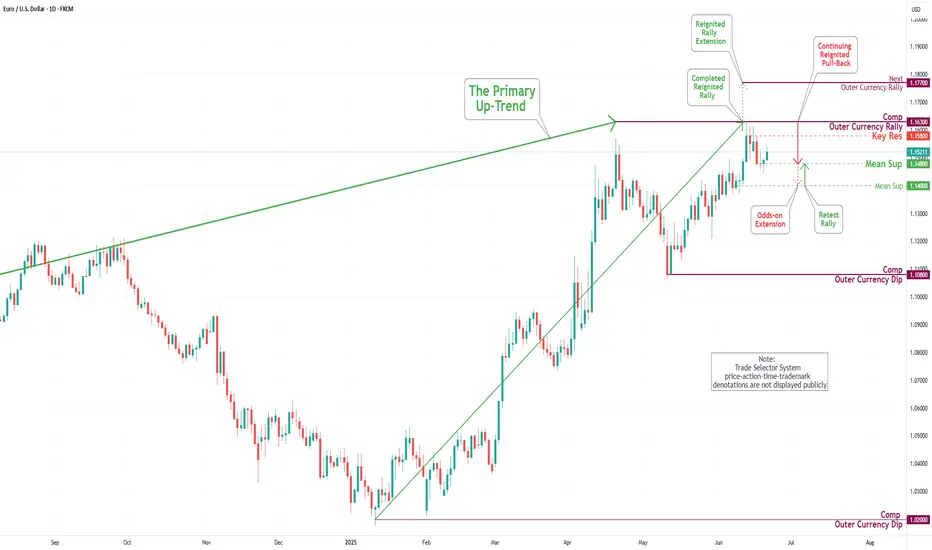
EUR/USD Daily Chart Analysis For Week of June 13, 2025Technical Analysis and Outlook:
During the current trading session, the Eurodollar has exhibited notable volatility, mirroring patterns observed in the preceding week. The currency has surpassed both the Mean Resistance level of 1.145 and the Key Resistance level of 1.151, subsequently retesting the significant completed Outer Currency Rally level at 1.157.
Recent analyses indicate that the Euro is likely to revisit both the Key Resistance and the completed Outer Currency Rally and expand further to the next Outer Currency Rally of 1.177 in the forthcoming trading session(s). However, there exists a potential for a continuation of the downward trend from the current level, which could lead to the price action targeting the Mean Support level at 1.149 and possibly a further extension to the Mean Support level at 1.140.
ETHUSD KEY LEVEL.This is the 4 hour chart of ETHUSD.
ETHUSD is currently consolidating in a well defined range.
If the lower boundary of the zone is sustainable ,then we see again higher prices in ETHUSD.
Thank you !!
EUR/USD Daily Chart Analysis For Week of May 30, 2025Technical Analysis and Outlook:
The Eurodollar has experienced significant volatility during this week's trading session. It reached a significant Mean Resistance level at 1.142 while also encountering Mean Support at a target of 1.122. Recent analyses suggest that the Euro is likely to revisit the critical target of 1.142, which includes Key Resistance at 1.151 and the completed Outer Currency Rally at 1.157. However, there is a potential for a downward correction from the current level, which could lead to prices retesting the Mean Support of 1.122. There is also a possibility for further declines, reaching the Outer Currency Dip at 1.108.

EUR/USD Daily Chart Analysis For Week of May 23, 2025Technical Analysis and Outlook:
The Eurodollar has demonstrated significant strength during this week's trading session, attaining a notable Inner Currency Rally at 1.129 and encountering Mean Resistance at 1.137. Recent analyses indicate that the Euro will likely progress towards the forthcoming target levels, specifically the Mean Resistance at 1.142 and the Key Resistance at 1.151. A retest of the completed Outer Currency Rally at 1.157 may facilitate this advancement. However, a potential downward pullback could emerge from the current price range, particularly in proximity to the Mean Resistance level of 1.137, with a possibility of declining to the Mean Support at 1.127.
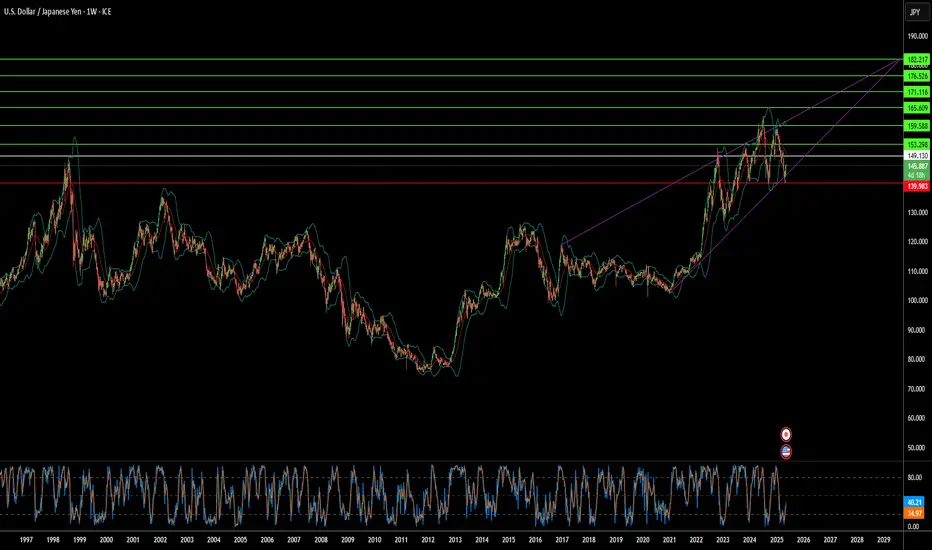
Global Calm, Fiscal Storm: The Yen's Challenge?The USD/JPY currency pair has recently experienced a notable surge, driving the Japanese Yen to its weakest level against the US Dollar in a month. This appreciation primarily stems from a significant improvement in global risk sentiment, sparked by a breakthrough trade agreement between the United States and China. This deal, aimed at reducing the US trade deficit, has bolstered investor confidence and diminished the traditional safe-haven appeal of the Yen. Adding to the dollar's strength is the Federal Reserve's continued hawkish stance, signaling no immediate plans for interest rate cuts and reinforcing the attractiveness of dollar-denominated assets amidst easing concerns about a US recession.
Simultaneously, internal economic pressures in Japan significantly weigh on the Yen. The nation's public debt has reached an unprecedented high, driven by persistent increases in defense spending and social welfare costs due to an aging population. Government subsidies for energy bills and the need to issue more bonds to cover rising expenditures exacerbate this fiscal strain. This challenging domestic backdrop contrasts sharply with the Federal Reserve's position, creating a widening divergence in monetary policy outlooks that favors the US Dollar through yield differentials, despite the Bank of Japan's cautious consideration of future rate adjustments.
Furthermore, reducing global geopolitical tensions has contributed to the shift away from safe-haven currencies. Recent ceasefires and prospects for diplomatic talks in key conflict areas have encouraged a "risk-on" environment in financial markets. This increased appetite for riskier assets directly reduces demand for the Japanese Yen, amplifying the impact of fundamental economic factors and monetary policy divergence on the USD/JPY exchange rate. The pair's trajectory remains subject to evolving global dynamics, upcoming economic data releases, and central bank communications.
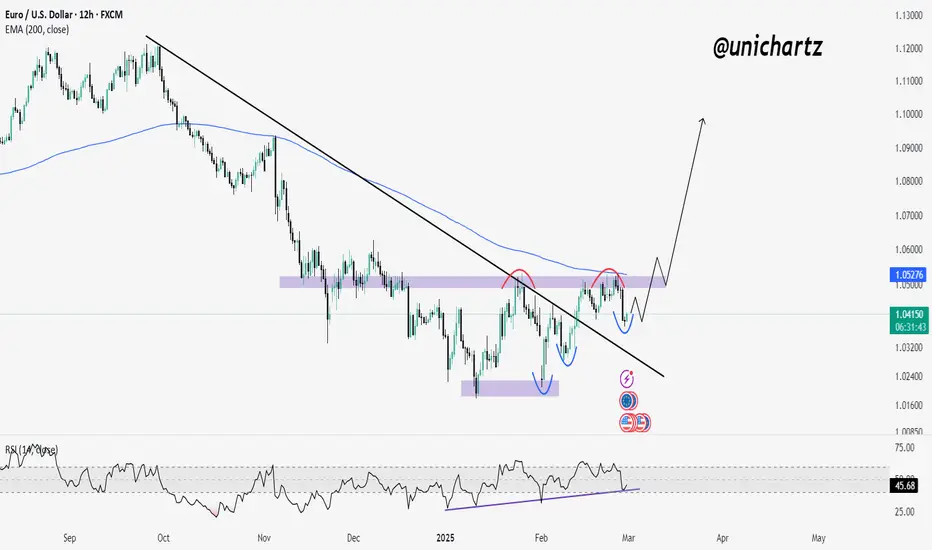
EUR/USD at a Pivotal Level – Will Bulls Push Higher?The EUR/USD pair is showing signs of a trend reversal after breaking above a long-term descending trendline. This breakout, coupled with an inverse head and shoulders pattern and RSI bullish divergence, signals strengthening bullish momentum. However, the price faces key resistance around 1.0500-1.0527, aligned with the 200 EMA.
A confirmed break above this level could push the pair toward 1.10+, while failure to do so may lead to a pullback before another attempt higher.
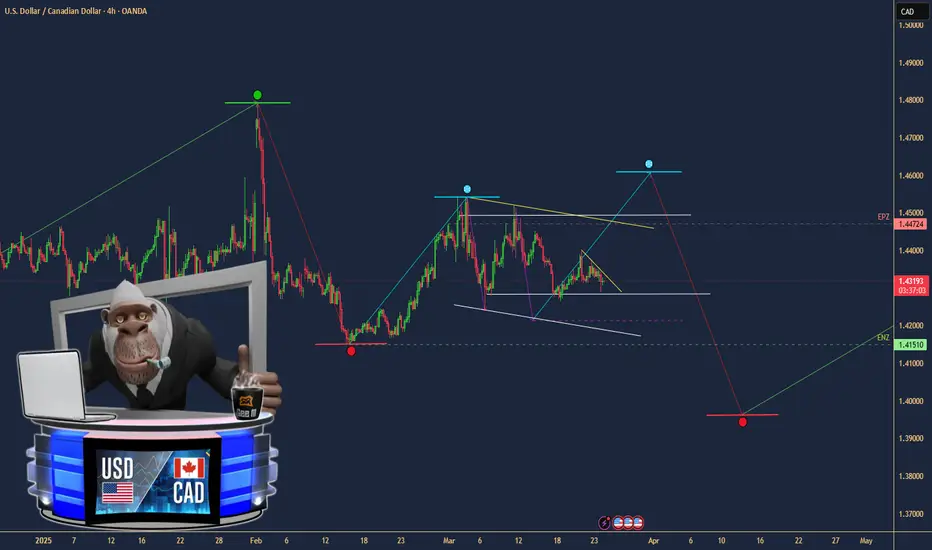
$USDCAD – Dollar Dominance or Canadian Comeback?(1/9)
Good evening, everyone! 🌙 USDCAD – Dollar Dominance or Canadian Comeback?
With USDCAD at 1.43180, is the US dollar’s reign continuing, or is the Canadian dollar poised for a resurgence? Let’s dive into the currency markets! 🔍
(2/9) – PRICE PERFORMANCE 📊
• Current Rate: 1.43180 as of Mar 24, 2025 💰
• Recent Move: Up from 1.3700 in Apr 2024, showing US dollar strength 📏
• Sector Trend: Currency markets volatile, driven by economic indicators and policies 🌟
It’s a dynamic market—let’s see what’s driving the dollar’s dominance! ⚙️
(3/9) – MARKET POSITION 📈
• Exchange Rate: USDCAD reflects USD value against CAD 🏆
• Coverage: Influenced by interest rates, economic growth, commodity prices ⏰
• Trend: US dollar strengthening, CAD weakening, per price movement 🎯
Firm in its position, but can the CAD make a comeback? 🚀
(4/9) – KEY DEVELOPMENTS 🔑
• Interest Rates: US rates higher than Canada’s, attracting investment to USD 🌍
• Commodity Prices: Potential drop in oil prices weakening CAD, per data 📋
• Economic Growth: US economy outperforming Canada, per reports 💡
These factors are stirring the pot! 🛢️
(5/9) – RISKS IN FOCUS ⚡
• Interest Rate Changes: Fed or BoC policy shifts can alter the landscape 🔍
• Commodity Market: Volatility in oil and other commodities affects CAD 📉
• Global Economy: Economic slowdowns or recoveries impact currency values ❄️
It’s a risky dance—watch your steps! 🛑
(6/9) – SWOT: STRENGTHS 💪
• US Dollar: Higher interest rates, safe haven status, strong economy 🥇
• Canadian Dollar: Supported by commodity exports, diversified economy 📊
Both have their strengths, but the balance tips towards USD currently! 🏦
(7/9) – SWOT: WEAKNESSES & OPPORTUNITIES ⚖️
• US Dollar Weaknesses: Potential overvaluation, trade tensions 📉
• Canadian Dollar Opportunities: Rising commodity prices, tech sector growth 📈
Can CAD turn the tables or will USD continue to dominate? 🤔
(8/9) – POLL TIME! 📢
USDCAD at 1.43180—your take? 🗳️
• Bullish on USD: 1.50+ soon, dollar’s dominance continues 🐂
• Neutral: Sideways movement, risks balance out ⚖️
• Bullish on CAD: 1.40 below, Canadian dollar rebounds 🐻
Chime in below! 👇
(9/9) – FINAL TAKEAWAY 🎯
USDCAD’s 1.43180 price reflects US dollar strength 📈, but CAD has its own aces up its sleeve. Strategic trading could be key to navigating this pair. Gem or bust?
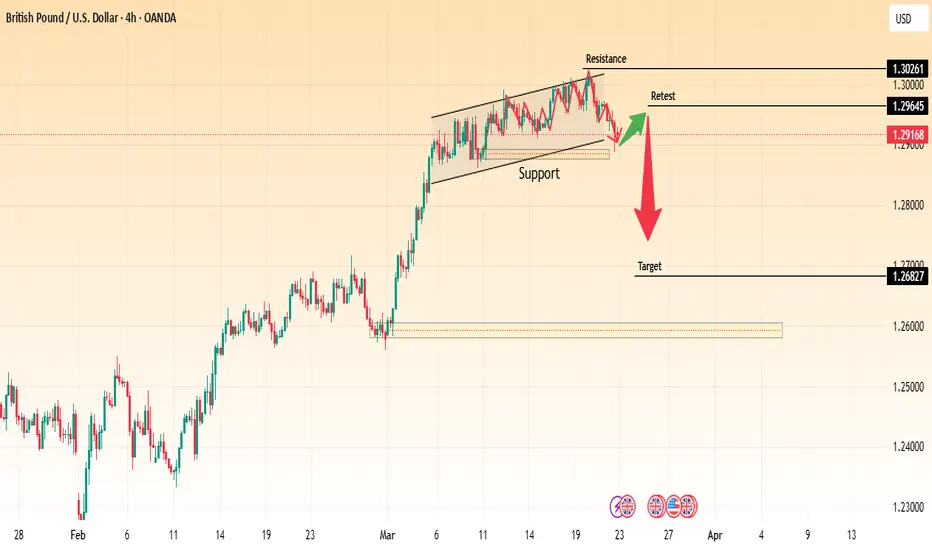
GBP/USD 4H Analysis – Bearish Breakdown SetupThis chart presents a bearish trading setup for GBP/USD on a 4-hour timeframe from OANDA.
Key Observations:
Ascending Channel Breakdown: GBP/USD was previously trading inside an ascending channel, but it has now broken below support, signaling a potential downtrend.
Retest Level: The price is currently retesting the broken support at 1.29645, which may act as a new resistance.
Resistance Zone: The key resistance level is at 1.30261, marking the last swing high before the breakdown.
Bearish Target: The expected downside target is at 1.26827, aligning with a previous demand zone and support level.
Trading Plan:
Entry: Consider short positions after rejection from the 1.29645 retest.
Stop Loss: Place above 1.30261 to avoid false breakouts.
Take Profit: First target at 1.26827, with the possibility of further downside.
Market Outlook:
If the price fails to reclaim the broken support and starts dropping, it could confirm a bearish trend continuation, making this a strong short setup.
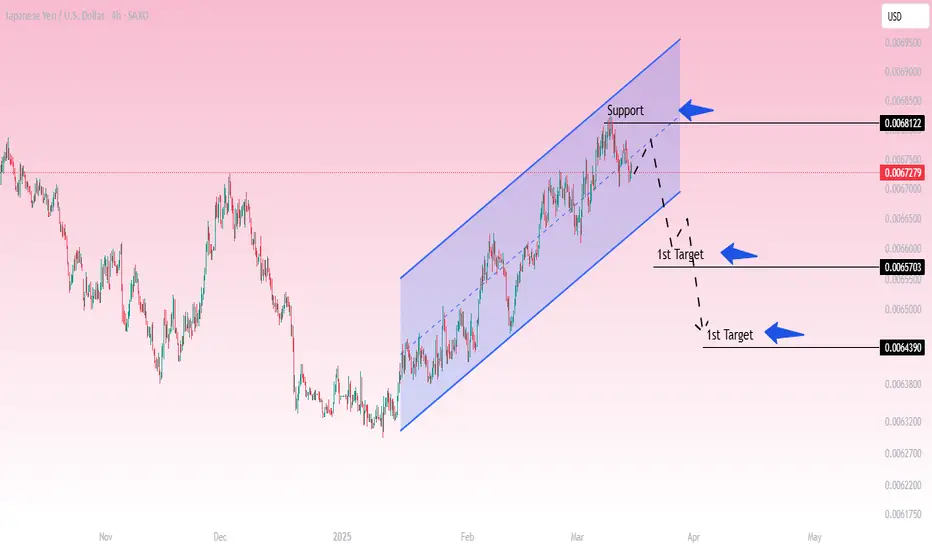
JPY/USD - Bearish Breakdown from Ascending Channel
📉 Market Structure:
The pair has been trending upwards inside a well-defined ascending channel. However, price is now testing the lower boundary of the channel, indicating a potential breakdown. A confirmed break below this support could trigger a bearish move.
🔍Key Levels:
Support Zone: 0.0068122 (Channel Support)
Current Price: 0.0067279
First Target: 0.0065703
Second Target: 0.0064390
📊 Trade Idea:
A confirmed break below the channel support could signal further downside.
If price rejects from this level and starts falling, a short opportunity may be considered targeting 0.0065703 and then 0.0064390.
Traders may look for bearish confirmation before entering short positions.
🚨Confirmation & Risk Management:
Bearish Confirmation: A strong break below 0.0068122 with volume.
Invalidation: A strong bounce from support and a move back inside the channel.
Risk Management: Stop-loss can be placed above 0.0068122 to protect against false breakouts.
This setup suggests a potential trend reversal if price fails to hold the channel support. Traders should watch for confirmation before executing trades.
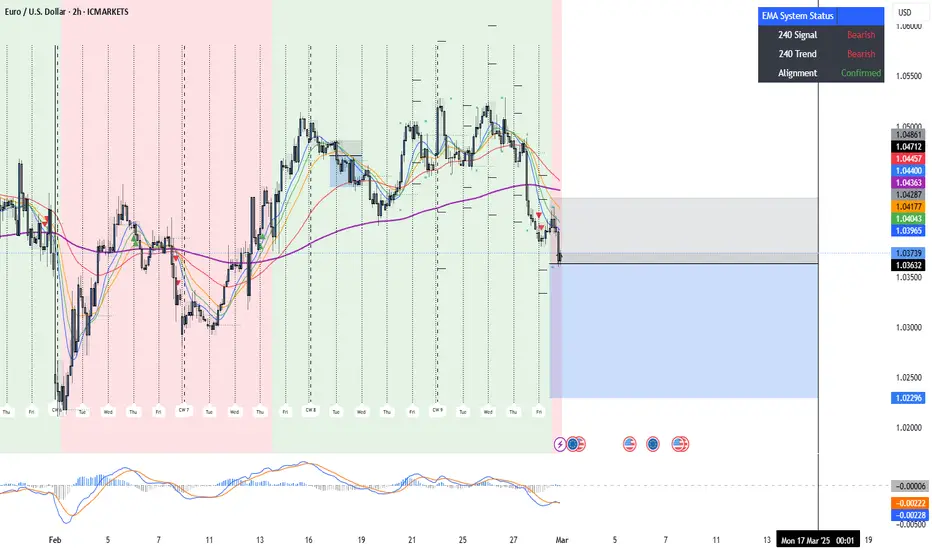
EUR/USD Technical Analysis: Bearish Momentum with 2.04R ShortEUR/USD Technical Analysis: Bearish Momentum with 2.04R Short Opportunity
Current Market Structure
The EUR/USD is displaying a clear bearish trend across multiple timeframes, with price action showing lower highs and lower lows since late 2024. Analysis of the charts reveals:
Daily timeframe: Sustained downtrend since October 2024, with price currently testing resistance near 1.0380
4-hour timeframe: "Confirmed" bearish alignment with both the 8 EMA and 21 EMA positioned below the 55 EMA
1-hour timeframe: Similar bearish configuration, reinforcing the short bias
EMA System Confirmation
The proprietary EMA System Status indicator demonstrates strong bearish conviction:
240 Signal: Bearish
240 Trend: Bearish
Alignment: Confirmed
This triple confirmation suggests high-probability conditions for short entries.
Key Technical Levels
Support Levels:
1.0300: Psychological round number
1.0230: Recent swing low and profit target
1.0200: Major psychological support
Resistance Levels:
1.0400: Key resistance zone with 200 EMA confluence
1.0430: Stop placement zone above recent swing high
1.0500: Major psychological resistance
Correlation Analysis
Supporting the bearish thesis, the DXY (Dollar Index) shows a complementary bullish structure with:
Confirmed bullish alignment on the 4-hour timeframe
Recent break above the 107.00 resistance level
Bullish momentum in MACD
This inverse correlation adds significant weight to the EUR/USD short setup.
Trade Parameters
Entry Strategy:
Short at 1.03632
Stop Loss at 1.04287 (65.5 pips)
Profit Target at 1.02296 (133.6 pips)
Risk/Reward Ratio: 2.04
Risk Management:
1% account risk allocation
0.5 lot position size
$500 risk per trade (on $50,000 account)
Potential profit: $1,019.85
Technical Confluence Factors
Several factors align to support this trade setup:
Price rejecting at 55 EMA resistance on multiple timeframes
MACD showing bearish momentum and alignment
Weekly and daily session boundaries reinforcing resistance zones
Recent higher timeframe rejection of the 200 EMA
Market Timing Considerations
The European and US economic calendars should be monitored for:
ECB monetary policy statements
Federal Reserve commentary
US dollar-impacting economic data releases
Conclusion
The EUR/USD presents a high-probability short opportunity with a favorable risk-reward ratio of 2.04. All key technical indicators align bearishly across multiple timeframes, with strong correlation confirmation from the DXY. This setup fits the criteria for a "Confirmed" signal within our trading system, meeting our standards for trade execution.
Trade management will follow our established protocol with potential scaling out at interim support levels and trailing stops implemented once price moves beyond the 1:1 risk-reward ratio point.
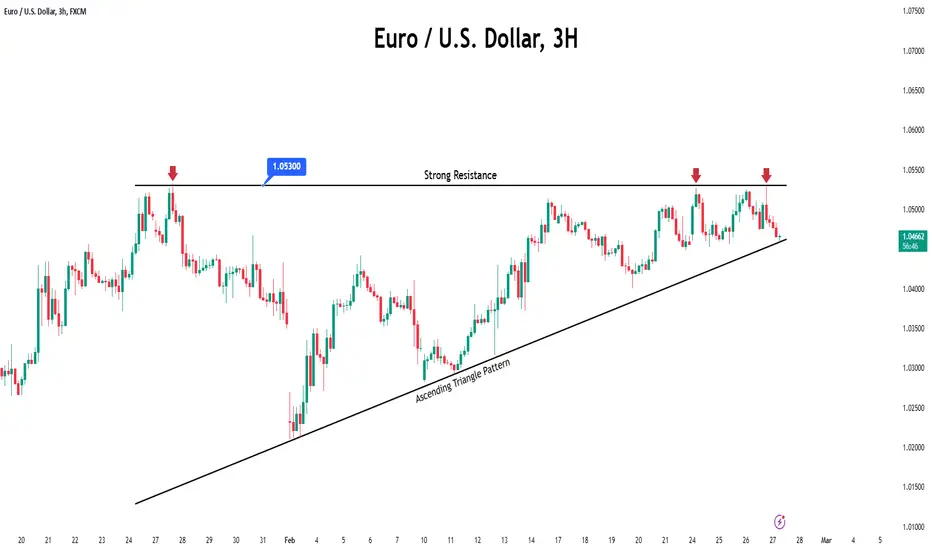
EUR/USD: Ascending Triangle Formation Points to Liftoff!● The EUR/USD pair tried to climb above 1.0530 but got pushed back, slipping lower.
● However, the charts are hinting at a potential breakout with an Ascending Triangle pattern forming.
● If the pair can finally break through 1.0530, it could spark a rally toward 1.0600.
● Stay tuned; the next move could be explosive! 🚀
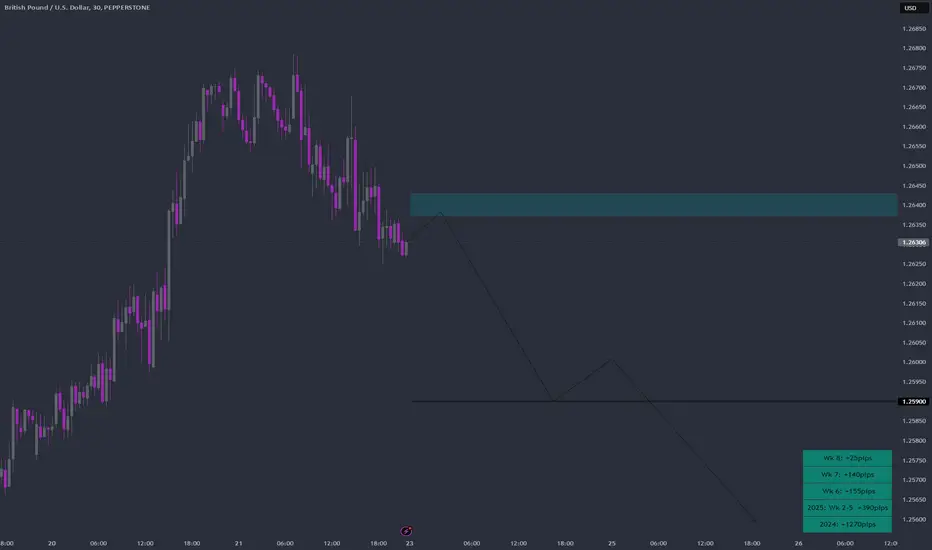
GBPUSD Week 9 Swing Zone/LevelsLast week saw a few pinched pips and also few losses. This highlights the benefit of having a good risk to reward ratio.
Weekly zone and levels are mapped based on previous week daily high-low relationship (ie Monday HL in relation to Tuesday in relation to Wednesday HL, etc). This generates a fairly accurate levels with actual price action determining trades.
SL, stoploss is usually btw 10-15pips
TP, Takeprofit is 5-10x that, with sl moving to BE, breakeven once trade pinches +20pips.
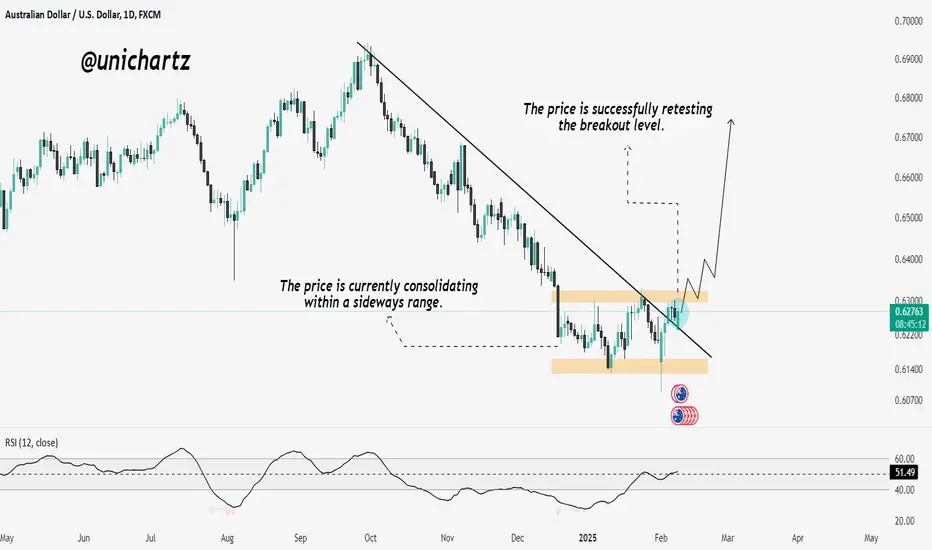
AUD/USD Breakout Watch: Bullish Continuation or False Alarm?The AUD/USD pair is trading in a consolidation zone after breaking above a key descending trendline, signaling bullish momentum.
The price has retested the breakout level, turning resistance into support, strengthening the outlook. With the RSI at 51.32, holding above 0.6200 could push the price toward 0.6400, with a target near 0.6700.
A drop below this level may trigger a pullback.
AR DAY TRADE!! (TALK ON BUSINESS OUTSIDE)BYBIT:ARUSDT.P
Yo I'm back with a mini-investment I'm going to go with this support zone the charts are at.. I've let it leak down at little to grab a bigger return. Otherwise, nothing else to report on.. ACTUALLY (yea I'm going to type on here like I'm talking because that's what I do) My wife and I have just purchased a commercial unit and are moving our detailing business into it this week! something exciting to look forward to and new adventures ahead!
Its not all about charts, We got business outside too.

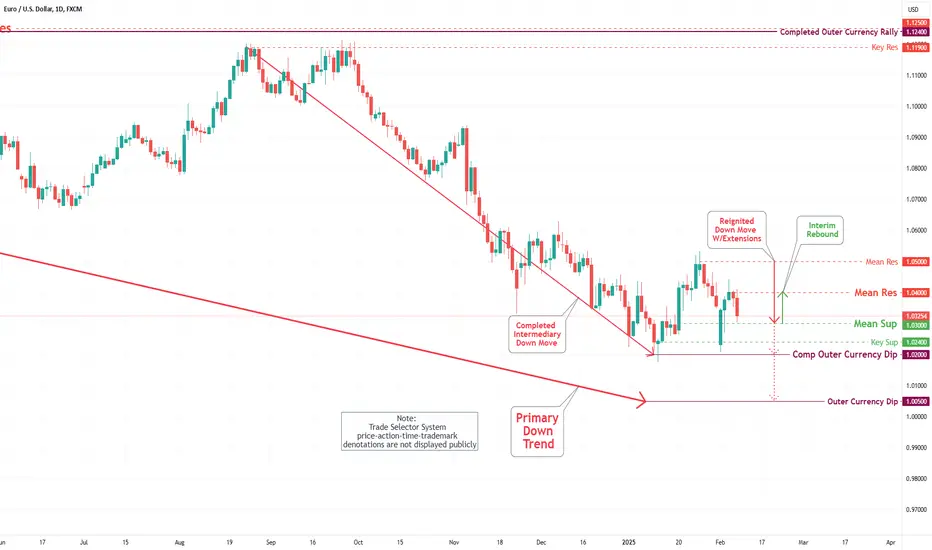
EUR/USD Daily Chart Analysis For Week of Feb 7, 2025Technical Analysis and Outlook:
During the trading session on Monday of the current week, the Euro reached the Key Support level of 1.024 and brushed off the completed outer Currency Dip at 1.020. This movement was followed by a significant rebound, establishing a new Mean Resistance level at 1.040, which is expected to be tested in the forthcoming trading sessions.
Conversely, the prevailing downward movement may prepare the price action for a subsequent decline if the anticipated rebound fails to materialize. This may lead to a revisit of the completed Outer Currency Dip at 1.020, further engaging with the Mean Support level at 1.030 and the Key Support at 1.024, ultimately progressing toward the specified outer Currency Dip target of 1.005.
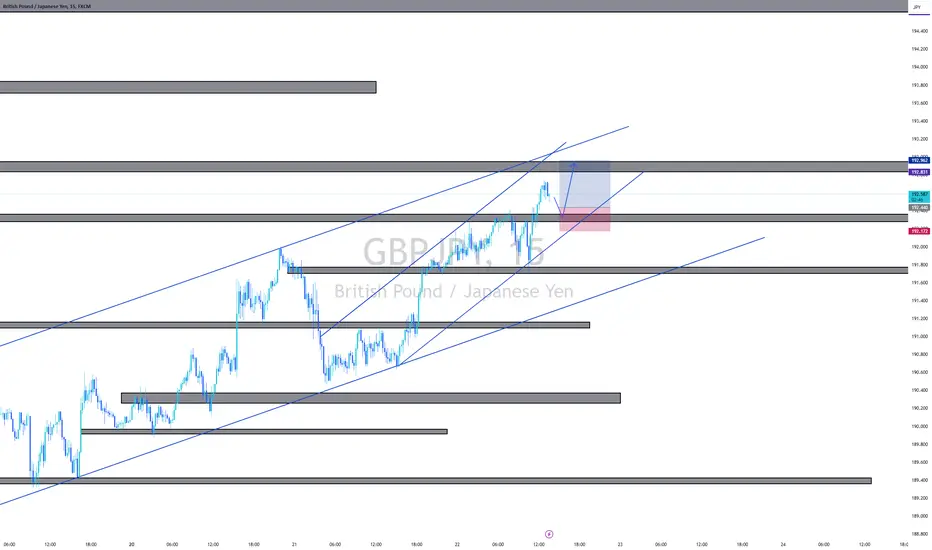
GBPJPY Trade IdeaWe have what could be a build up for a possible buy on GBPJPY. We have a short term bullish trend inside our overall bullish trend. There was a break above a key level, a pull back followed by a rejection on that key zone will be a confirmition of a buy, anticipating for the market to push to the upside
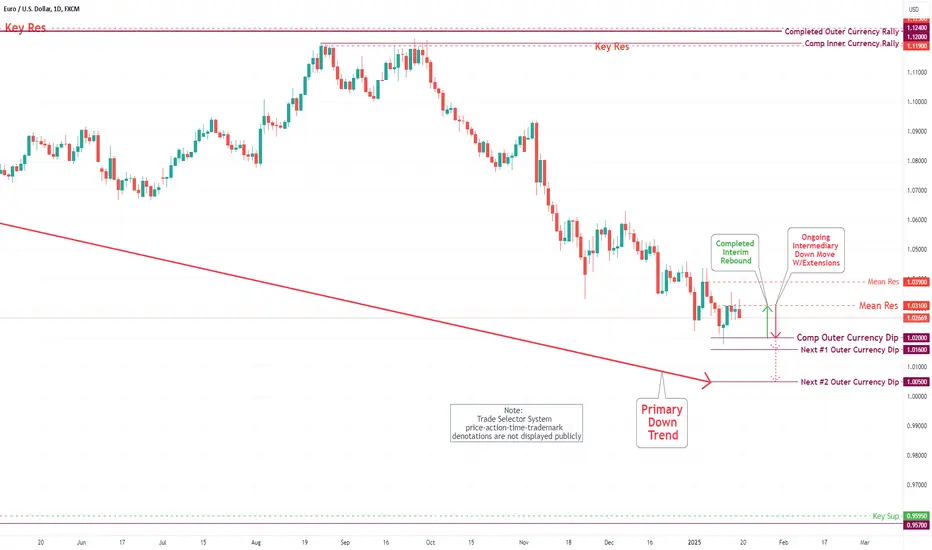
EUR/USD Daily Chart Analysis For Week of Jan 17, 2025Technical Analysis and Outlook:
The Eurodollar has seen a notable increase in volatility during this week's trading session after completing our significant Outer Currency Dip at 1.020. The interim rebound reached our target of the Mean Resistance at 1.030, as outlined in last week's chart analysis. We are now anticipating a retest of the completed Outer Currency Dip at 1.020, with additional extension levels at Outer Currency Dips of 1.016 and 1.005, respectively.
GBPUSD End of Year Swing ZonesLast trading week of the year.
SZ is calculated and set. Price already bouncing upward from SZ.
Entry @586
SL -10pips.