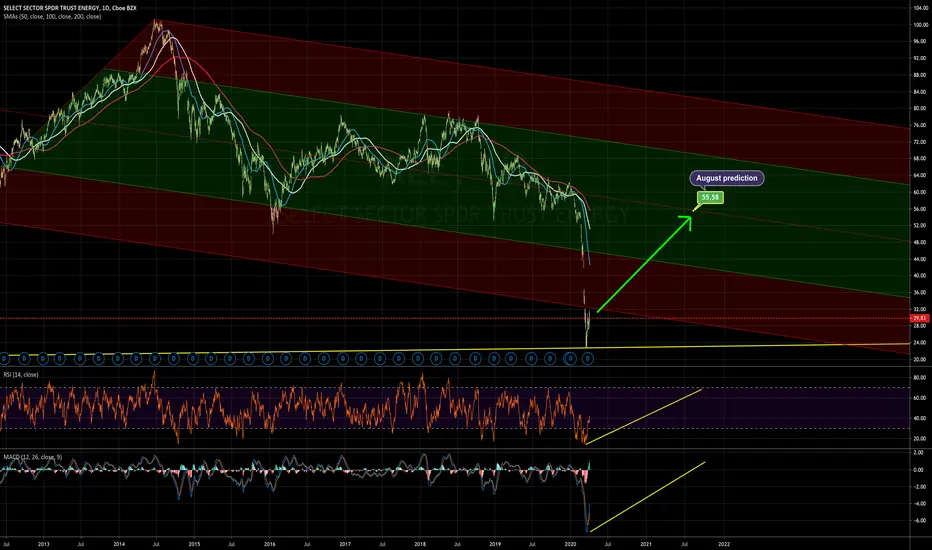
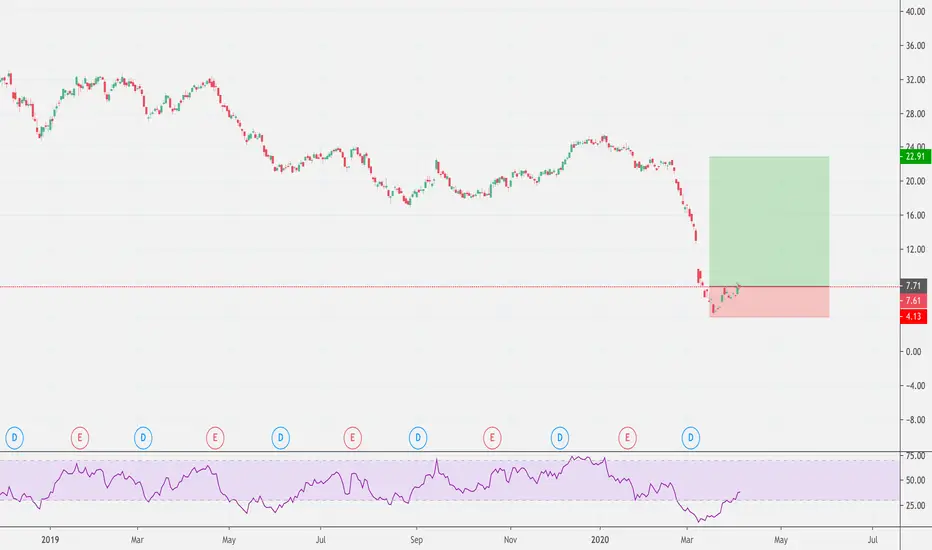
Market Rotation Into Energy (XLE) The past week there was rotation into Energy (XLE). There is precedent for rotations into energy marking tops and continuing as safe havens during corrections.
In the bottom chart, you see the rotation happening in September 2018, just before three months of market declines (21% on S%P 500 and 24% for Nasdaq).
Looking back further to the 2000 tech bubble, look at stocks like CVX, XOM and SLB. These stocks are going up or sideways while the market is crashing around them.
On the other hand, 2018 these stocks fell along with the market.
So the question is are we in a correction?
If so, is it more like 2000 or 2018?
Have energy stocks been held down while the tech bubble grew?
Will we see energy stocks climb over the next few months?
CVX

ExxonMobil :You ain't betting against the Rockefellers,are you ?You ain't betting against the Rockefeller's company, are you ?
Nice bounce off the 61.8 Fibonacci retracement . Send it !

CVX has 2 signals! I'm in. $95.44 is the top oneBased on our proprietary alert system, we've spotted some signals on CVX. $95.44 is our top one! I'm in with options and ready to go. will scoop up more on dips
NYSE:CVX
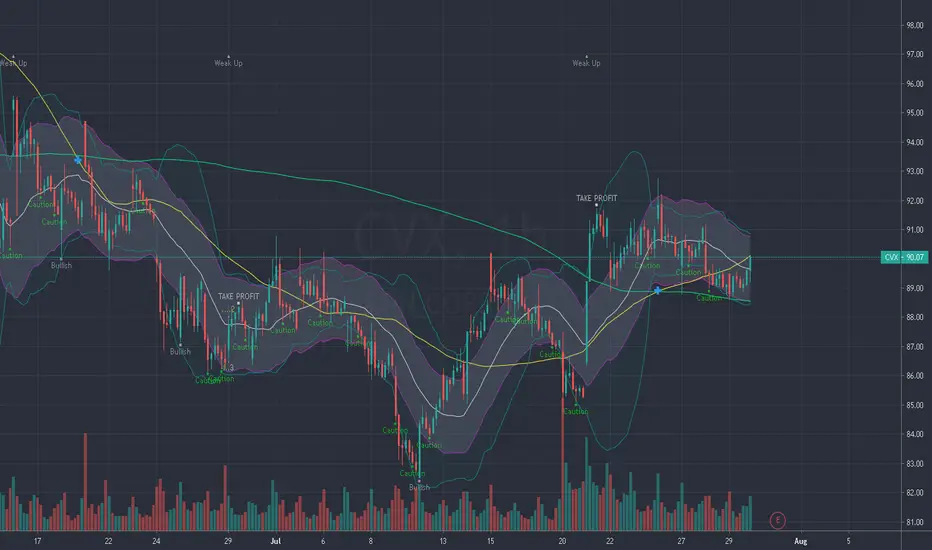

Chevron (CVX) Stock AnalysisSideways trend - the best option is to hold.
Prices might go upward or downward.
Chevron (CVX) – Chevron reported a quarterly loss of $1.59 per share, wider than the 92 cents per share that analysts were expecting. Revenue also came in below forecasts, amid lower oil and gas prices and the pandemic-related drop in fuel demand.

𝗖𝗿𝘂𝗱𝗲 𝗨𝗽𝗱𝗮𝘁𝗲: $CL_F Daily. Nice pop today over 200dmaComing into a resistance area I expect to hold (42.50-43.70) for a pullback. Could be a large one in August which is also when seasonality flips
$USO $XLE $XOM $CVX $XOP $GUSH $DRIP $SPY #Oil #CrudeOil #OOTT 🛢️

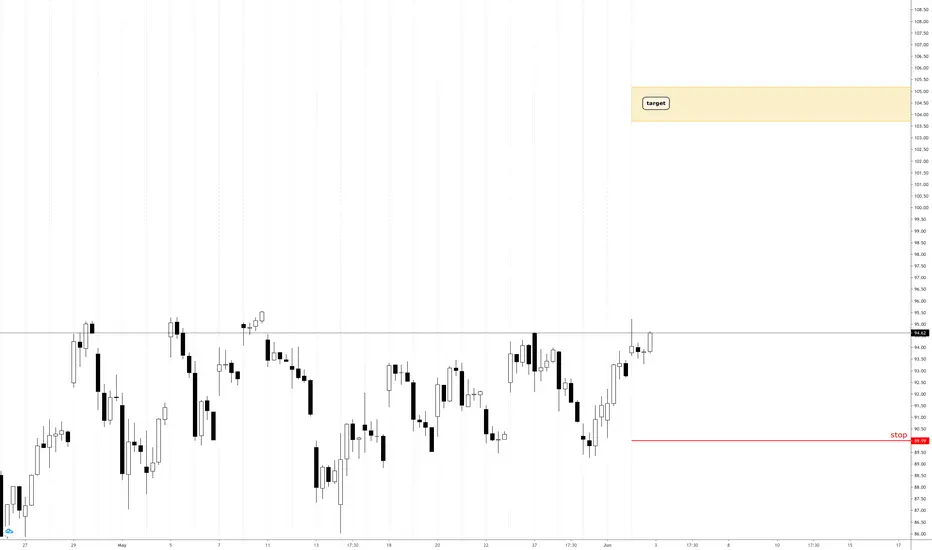
Chevron Corporation (CVX) long.All description on the chart.
Please, don't forget to like and follow.
Thank you.
CVX - Chevron Corporation Technical AnalysisNYSE:CVX
Wait the right time to get in this market with a long position.

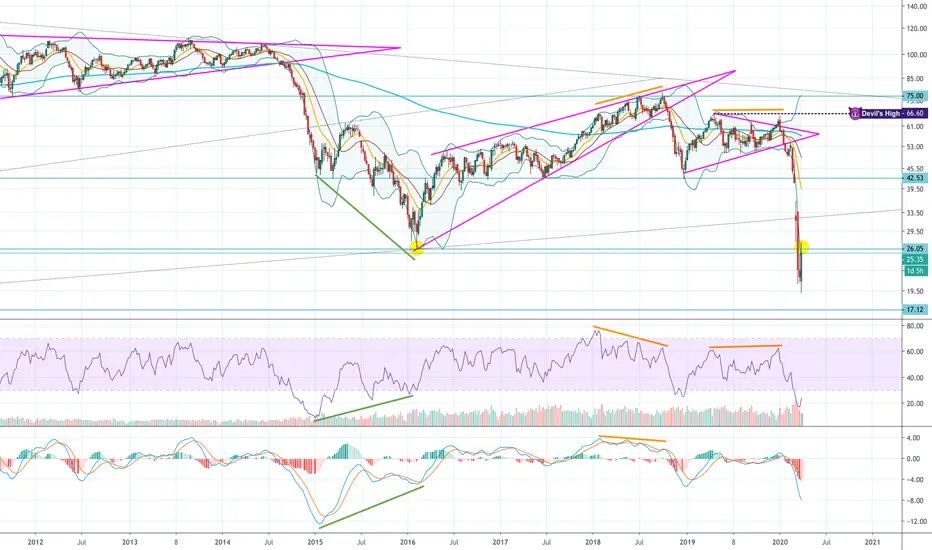
God Bless The Oil Industry. (CVX)50 year parallel channel shattered. It took 50 years to get there, how many will it take to come down?
Be patient. Give it some time to breathe.

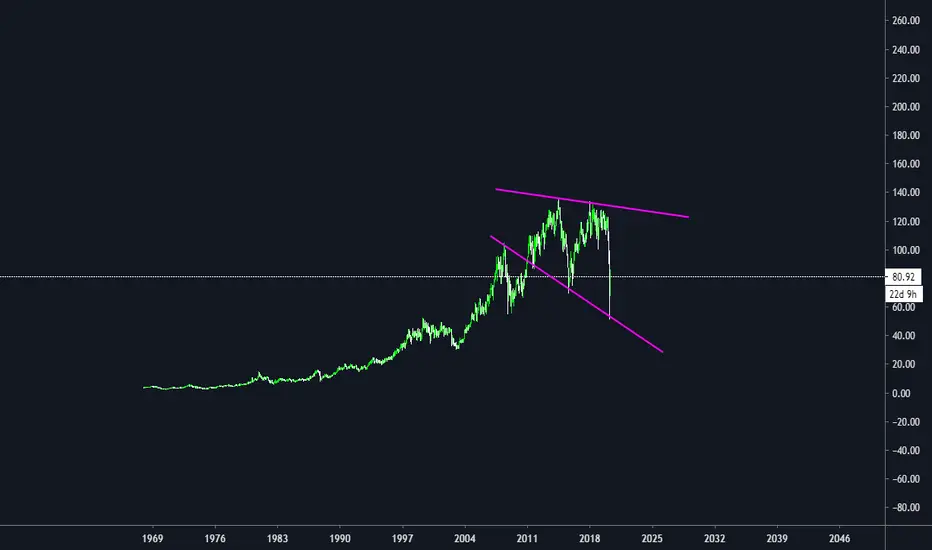
Should return to the middle channel by August.Collect dividends while you wait for a return to the mid channel which I am predicting to be in August.
Big Time Rewards - Longterm BUY and HOLD (Scared?)Not going to say nows the best time to buy - its probably not - but I'm willing to bet my left almond shares will be trading around $20 in a year or two.
Seems like an extremely safe yearish long buy and hold. Fun to let things build slow sometimes anyways.
Position size accordingly, look for dips to load up .
Adios,
Fishy
𝗖𝗿𝘂𝗱𝗲 𝗨𝗽𝗱𝗮𝘁𝗲: $CL_F Weekly. Backtest of 2016 lows ~26If holds below can't rule out a trip down to ~17 ...
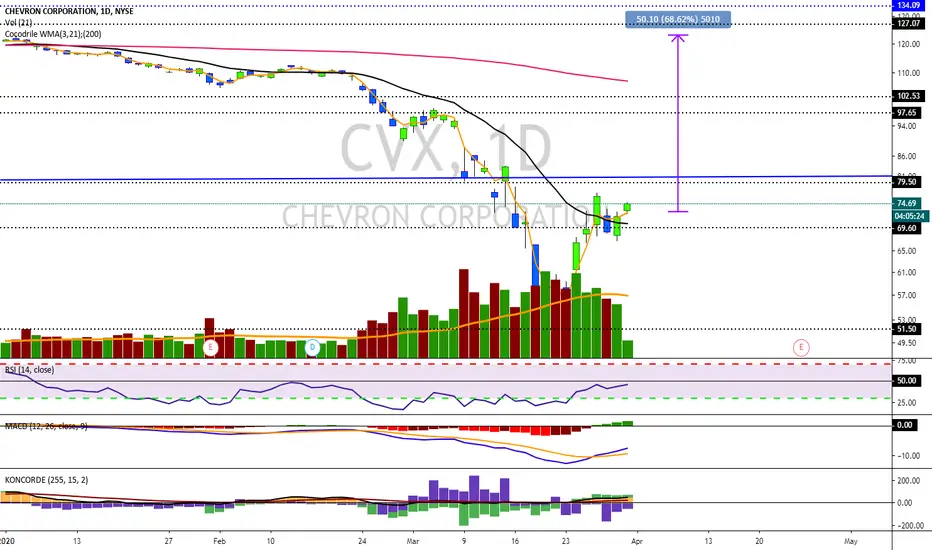
CVXCVX sigue en ascenso, MACD compra RSI casi en 50 pts, Koncorde muestra venta por ahora, este papel depende del oil en parte. pero esta muy barata y paga lindos div
CVX: short term long positionOn the hourly chart of CVX shares, the price has formed a bullish divergent bar. The signal is supported by double divergence on the AO indicator. Planning to go long using entry levels that are marked on the chart.

CVX weekly RSI reaches OversoldI'm not advocating the use of incomplete weekly candlesticks - BUT the 14 period Weekly RSI for Chevron (CVX) which makes up over 20% of the cap weighted S&P Energy ETF, has reached oversold territory for the 12th time in its history..

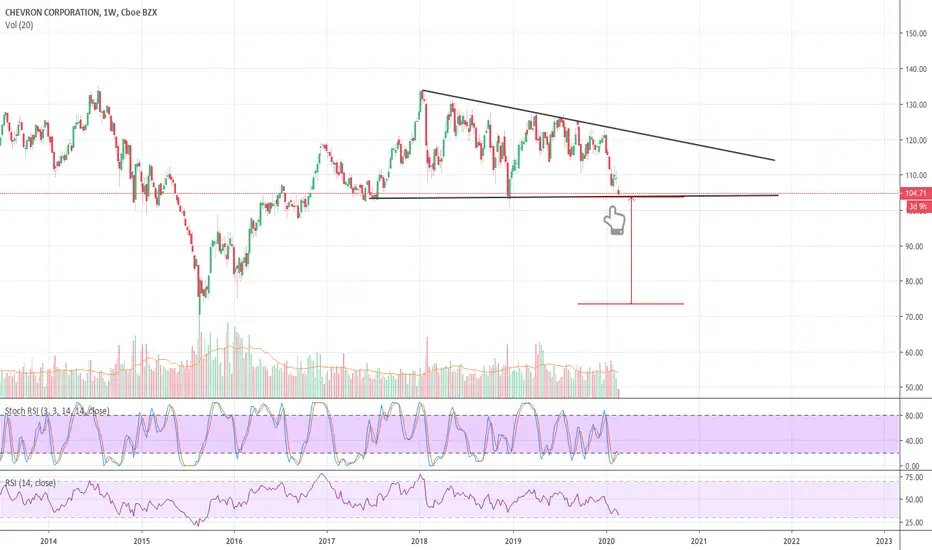
CVX: Chevron descending triangleI really don't like descending triangle for NYSE:CVX . I have fundamental analyst giving me a buy/hold signal but i am still cautious. This 139 weeks descending triangle might play out just be very careful and wait for confirmation before entry.
CHEVRON (CVX): Close To Key Structure
chevron is coming closer and closer to a key structure support level.
I would consider a buying opportunity from 103.0 level with a potential bullish reaction to 114 / 121 levels.
with a stop below the X the position will be protected against the volatility and occasional fluctuations!
good luck!

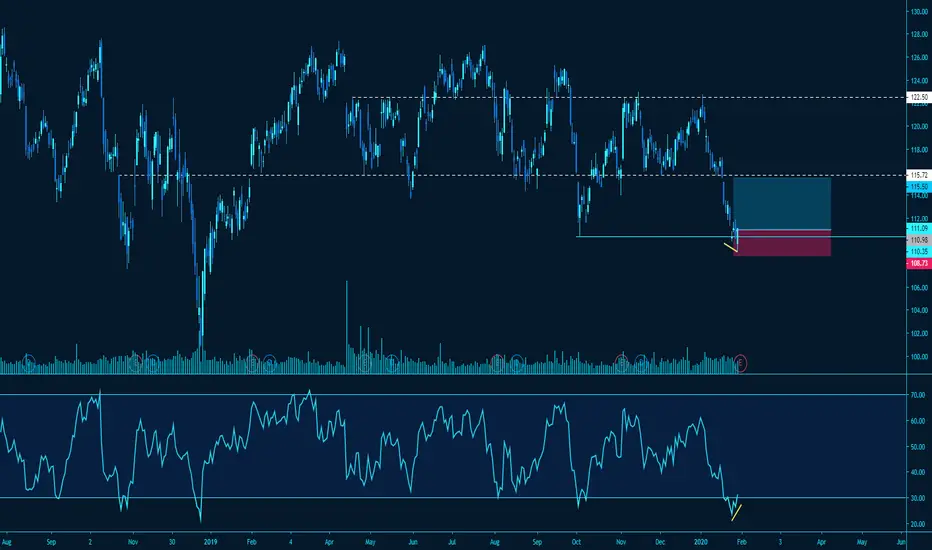
$CVX Long$CVX Long. Horizontal support + possible spring (stops taken) + RSI overslod + bullish divergence with RSI. Chevron Corporation is expected* to report earnings on 01/31/2020 before market open.
rig .. not a bad middle east conflict hedge.Rig in an interesting spot.. put some marks on the chart that show what i imagine may happen depending on outcome. Tuff saying how it all works out. appears rig will respond though.
Kinda fun game.. Calls were on sale today! maybe puts on sale tomorrow?

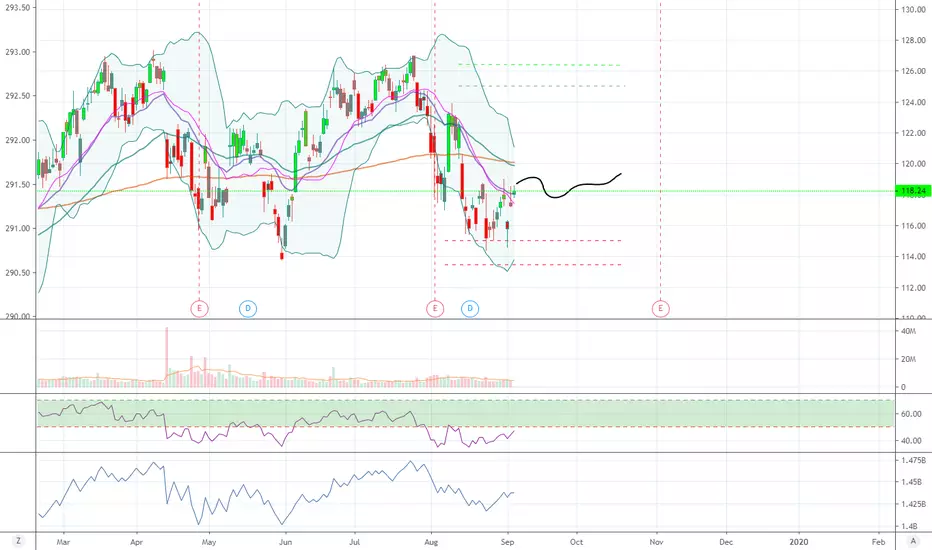
CVX Iron CondorCVX Iron Condor Strategy
110/115/125/130
Seems very lackluster in terms of the movement, rsi is rising but OBV is bearish.
Price movement is weak.
Credit is very nice on a condor. $1.53 Credit on this strategy
Looking to exit first week of October for $90 credit.
Max loss is $180.
CVX long setupCVX’s innovation outlook is trending down based on a current score of 77 out of 99, outperforming sector average. Jobs growth over the past year has decreased and insiders sentiment is negative. CVX is an Average Performer in terms of sustainability. It is most exposed to BP p.l.c. as its supplier. Over the past 4 quarters CVX beat earnings estimates 3 times and it pays dividend lower than its peers.
For more analysis and articles visit our website

CVX - Potential Short (Buy Put)CVX - Potential Short (Buy Put) - Looking to go short if I get the right trade entry signal.
