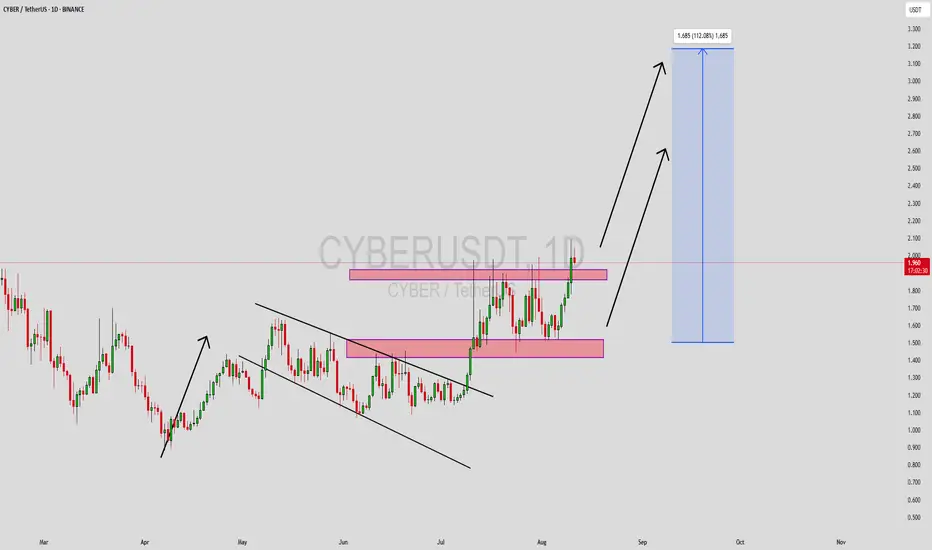
CYBERUSDT Forming Bullish PennantCYBERUSDT is forming a textbook bullish pennant pattern, a classic continuation structure that often leads to sharp upside moves. The pattern typically emerges after a significant price surge—known as the flagpole—and consolidates into converging trendlines before breaking upward. In the context of crypto, volume usually rises during the initial rally, tapers during consolidation, and then spikes again at breakout—confirming the pattern's validity
In CYBER’s case, this pattern aligns with the recent strong move higher and tightening price action. Supported by healthy trading volume, the setup points to a continuation of the bullish move. If volume confirms a breakout, we could see the pairing surge by 90% to 100%+, making this one of the most compelling setups on the chart.
On-chain activity and market attention for CYBER are also picking up—the asset has started forming higher highs and higher lows, indicating renewed bullish momentum. With broader investor interest rising and technical structure aligning, the conditions are ripe for a powerful breakout.
If you're scanning for continuation setups with strong technical and sentiment confluence, CYBERUSDT deserves serious attention. A clean breakout from the pennant on rising volume could pave the way for an explosive rally.
✅ Show your support by hitting the like button and
✅ Leaving a comment below! (What is your opinion about this Coin)
Your feedback and engagement keep me inspired to share more insightful market analysis with you!
CYBERBTC
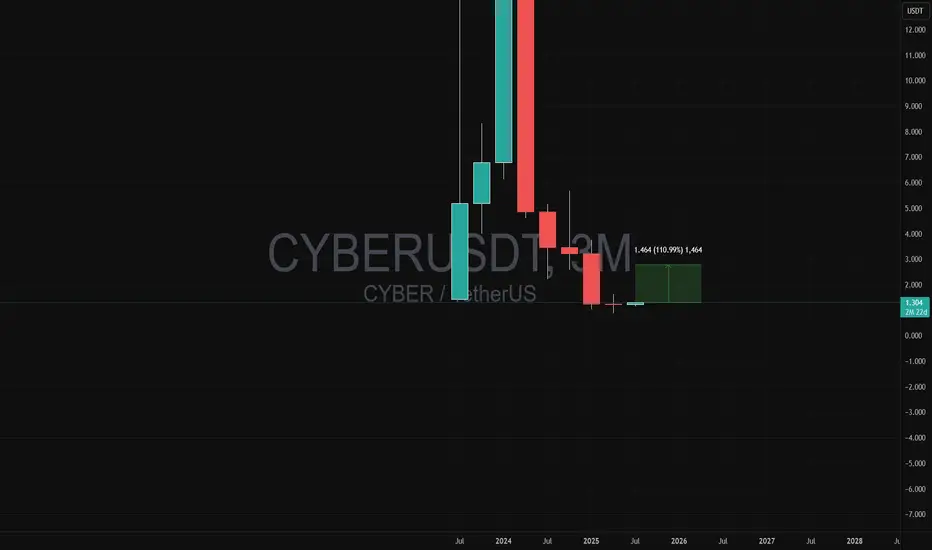
CYBER is ready to move higherAfter big dump, bottoming pattern formed succesfully and CYBER can go easily to the upside.
Expecting targets 40-110% in the mid term.
THIS IS NOT A FINANCIAL ADVICE
MANAGE YOUR RISK AND SET STOPLOSS ALWAYS
#CYBER/USDT#CYBER
The price is moving within a descending channel on the 1-hour frame, adhering well to it, and is heading for a strong breakout and retest.
We are seeing a bounce from the lower boundary of the descending channel, which is support at 1.46.
We have a downtrend on the RSI indicator that is about to break and retest, supporting the upward trend.
We are looking for stability above the 100 moving average.
Entry price: 1.52
First target: 1.587
Second target: 1.67
Third target: 1.67

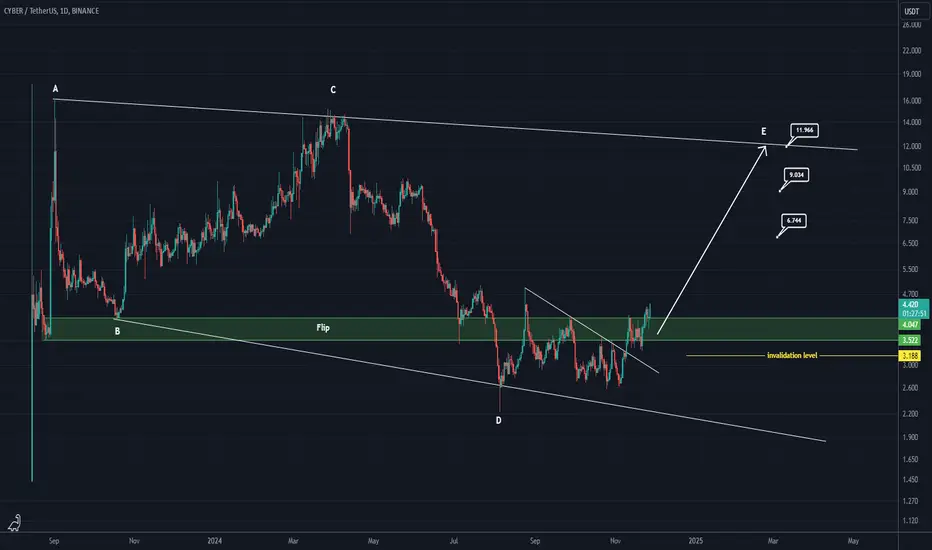
CYBER looks bullish (1D)It seems that CYBER has entered a bullish E wave. A significant trigger line has been broken, and it has stabilized around the flip zone. As long as the green support area is maintained, it can move towards the targets indicated on the chart.
Closing a daily candle below the invalidation level will negate this analysis.
For risk management, please don't forget stop loss and capital management
Comment if you have any questions
Thank You
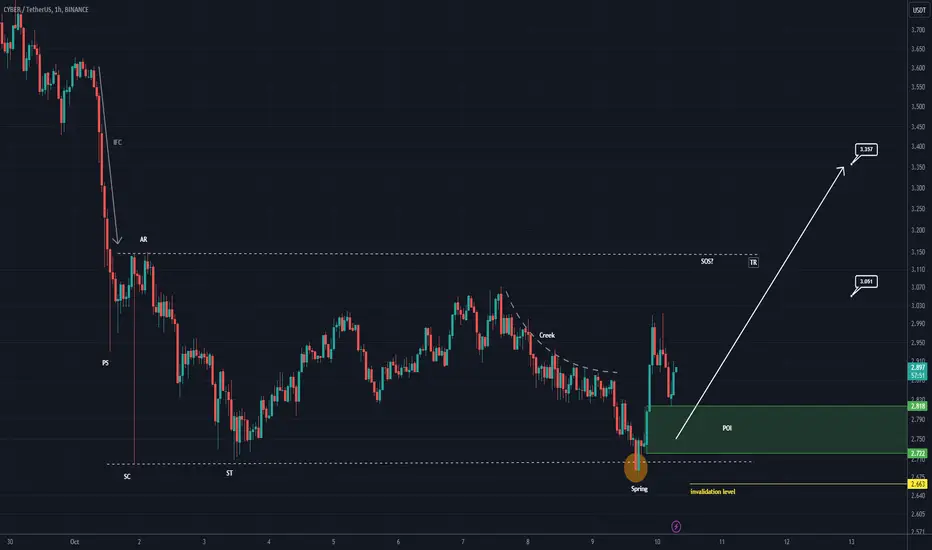
CYBER looks bullishCYBER appears to be in the "accumulation" phase. After the initial pullbacks, spring/hunt seems to be done.
A strong move/SOS can be expected from CYBER.
It has two targets ahead that we specified on the chart.
The green range is our entry range.
Closing a 4-hour candle below the invalidation level will violate this analysis
For risk management, please don't forget stop loss and capital management
When we reach the first target, save some profit and then change the stop to entry
Comment if you have any questions
Thank You
CYBER buy setupThe symbol CYBER is located within a large range. Within the ranges, the areas near the ceiling are suitable places for sell/short positions, and the areas near the bottom are suitable places for buy/long positions.
We have a good demand at the bottom of the chart. If the price reaches this strong demand, I will look for buy/long positions.
Closing a daily candle below the invalidation level will violate the analysis.
Note that the financial market is risky, so:
Do not enter any position without confirmation and trigger.
Do not enter a position without setting a stop.
Do not enter a position without capital management.
When we reach the first TP, save some profit and try to move the stop continuously in the direction of your profit.
If you have any comments please post them, comments will help us improve our performance
Thanks

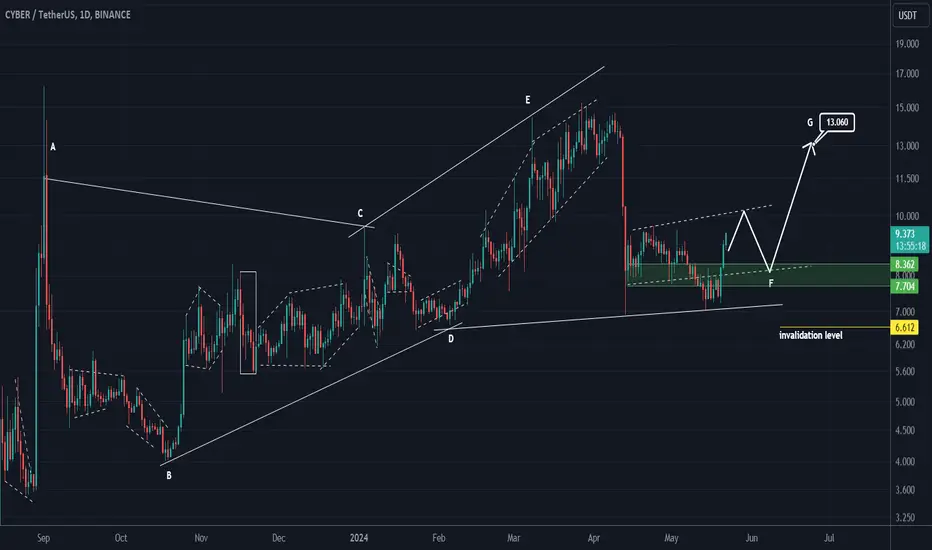
CYBER looks bullishWe have a large diametric on the chart. We seem to be at the end of the F wave.
The F wave looks like a triangle. Only wave E of the triangle remains.
If there is a pullback on the green range, we will look for buy/long positions.
The target is clear on the chart
Closing a daily candle below the invalidation level will violate the analysis
For risk management, please don't forget stop loss and capital management
When we reach the first target, save some profit and then change the stop to entry
Comment if you have any questions
Thank You
#CYBER/USDT#CYBER
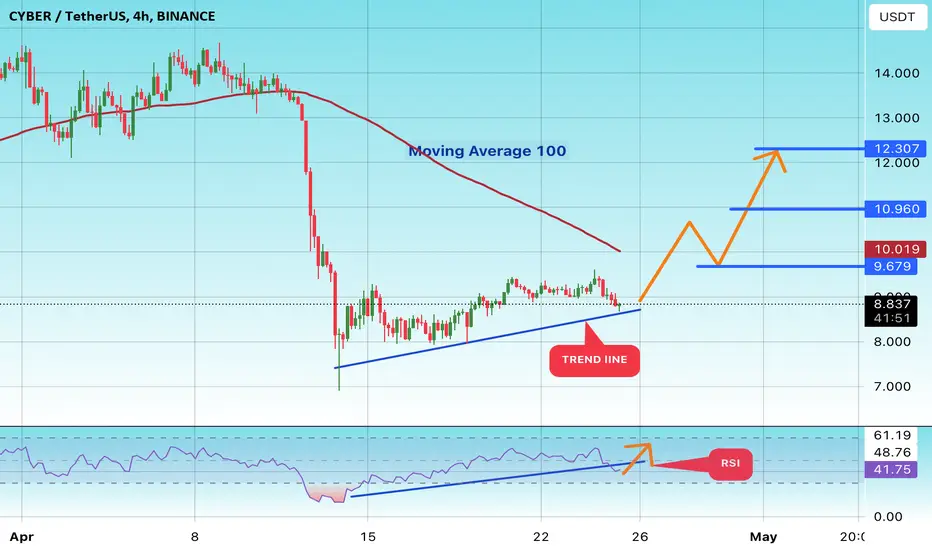
We have a bullish trend pattern on a 4-hour frame, the price moves based on it and adheres to its limits well
We have a tendency to stabilize above moving average 100
We have an uptrend on the RSI indicator that supports the price higher
Entry price is 8.80
The first goal is 9.67
The second goal is 10.96
the third goal is 12.03
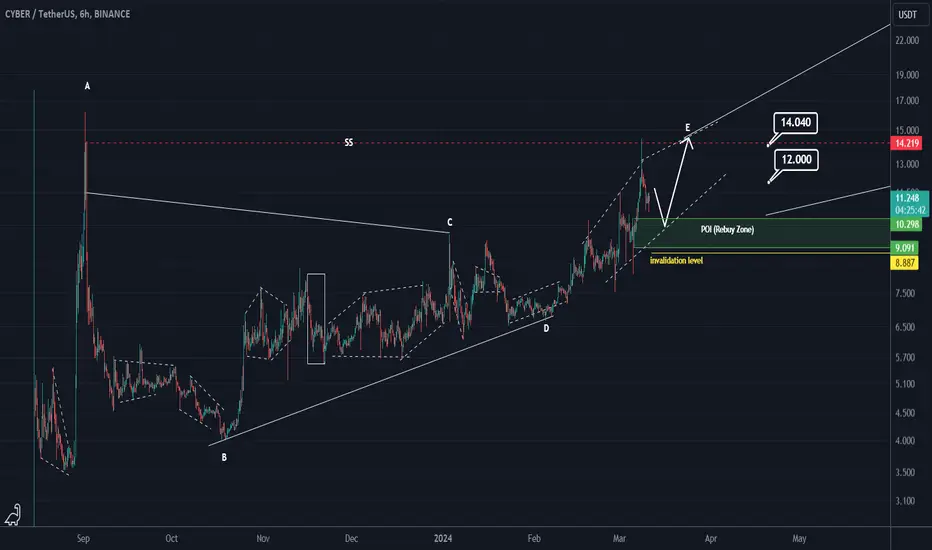
CYBER ANALYSISCYBER seems to be in a large symmetrical.
Now it looks like the inside of wave E is symmetrical.
Wave E appears to be a diametric.
If there is a pullback on the POI range, we can enter a buy/long position.
Closing a daily candle below the invalidation level will violate the analysis.
For risk management, please don't forget stop loss and capital management
When we reach the first target, save some profit and then change the stop to entry
Comment if you have any questions
Thank You
CYBERUSDT Ascending ChannelCYBERUSDT Technical analysis update
CYBER price has broken above its ascending channel resistance. This suggests potential upward movement in the coming days.
Buy zone : Below $12.15
Stop loss : $10.00
Regards
Hexa

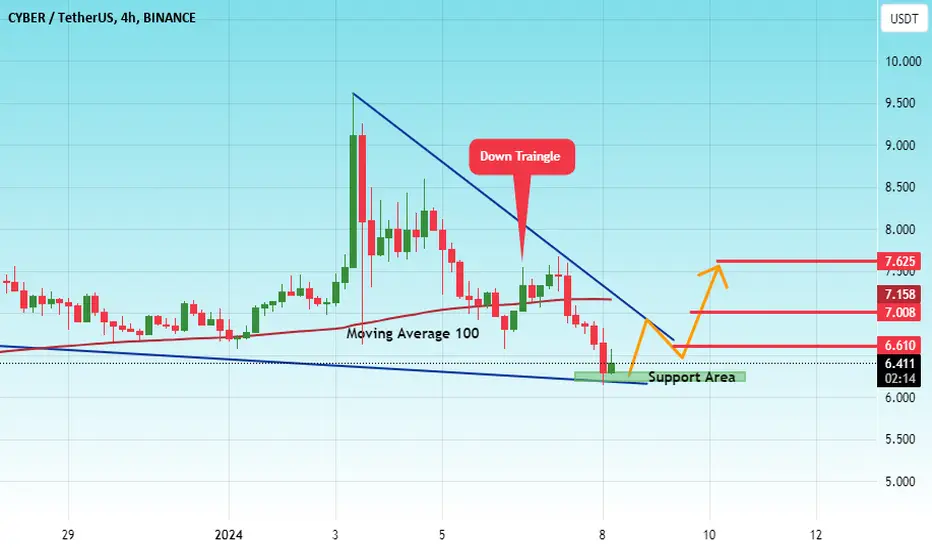
#CYBER/USDT LONG#CYBER
The price has reached the lower border of the reversal triangle
We are about to retest the boundaries of the triangle and break it upward
Current price 6.60
First goal 6.60
Second goal 7.00
Third target: 7.625
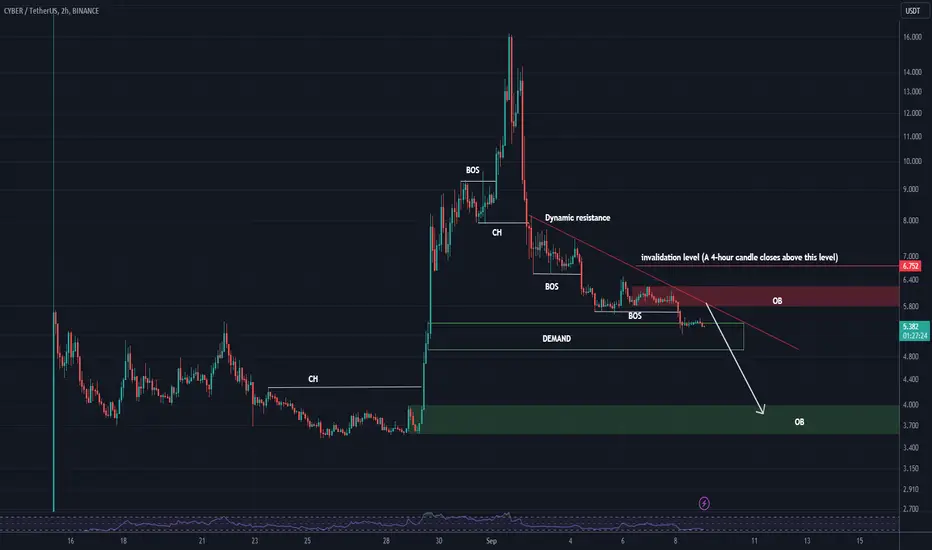
cyber will drop moreAfter the downtrend CH has had, it has entered a downward trend and then we have seen BOS
Continuously we can observe HL and LHs.
Also, the price is below a dynamic resistance.
It is now on a support that I expect to break to the downside.
Eventually I expect to reach the green area.
Ispecified the invalidation level that closing a 4-hour candle above this level will violate the analysis.
For risk management, please don't forget stop loss and capital management
When we reach the first target, save some profit and then change the stop to entry