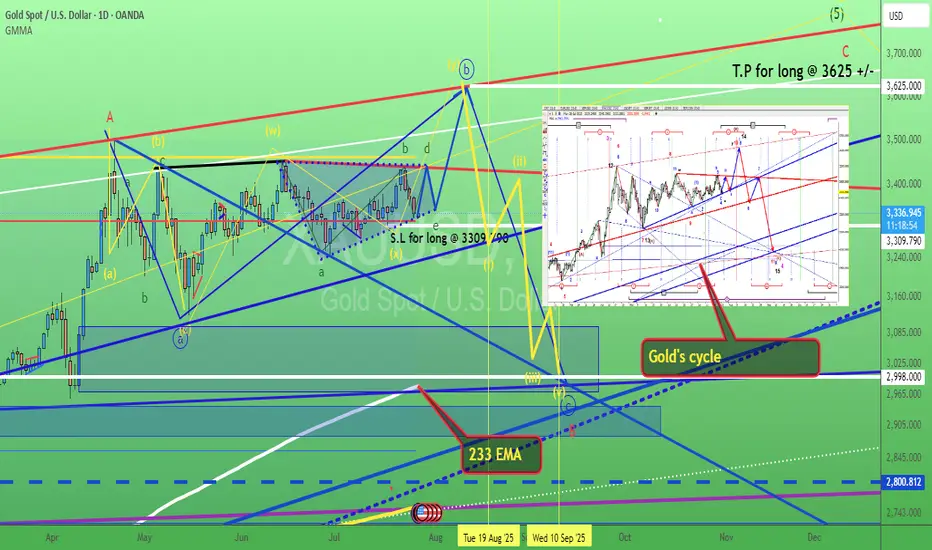
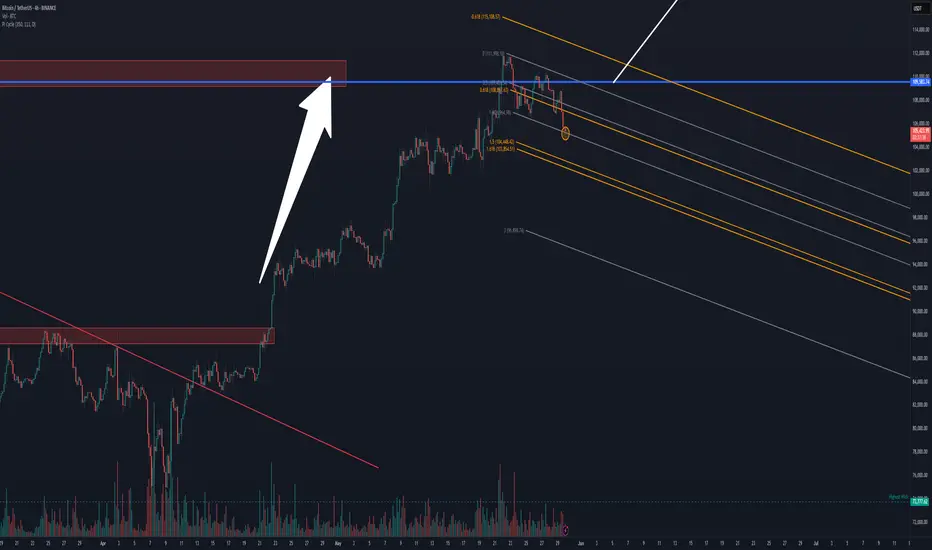
Gold. Bull Trap "triangle". 28/July/25XAUUSD, by checking gold latest speed of chart with its cycle. we might have a bull 'trap" triangle. A base for rallying to ATH again before a very deep pullback toward 233 Daily EMA which have not been "touched" for long time...
Cycleanalysis
TheKing Cycles- Nothing can be perfect in Life or in Trading, but you can always brighten up your day.
- Remember "Cycles are Cycles"
- Everything is in graph
- You can follow bears, predicting 10 years of recession, but we are in a big recession and for a long time already.
- You can fall in the deep and predict the darkness.
- i like to see the sunshine in the morning and i will always radiate warmth.
- Follow Hope, and always believe in your own judgement.
- Be Bold and do the opposite of what commons peoples think.
Happy Tr4Ding !
SMCI buy cycle in progress into yr endStrong buy rates on order flow indicating buy-side targets as follows
tp1 = 88
tp2 = 96
tp3 = 105
...by end of 2025
Still expecting strong sell wave sometime by mid-2026 all the way back to 20's as the semiconductor space continues dealing with growing bearish forces. Recent weakness should be seen as "shots across the bow" or warning shots. Next set of highs will be opportunities to EXIT and go short imo.

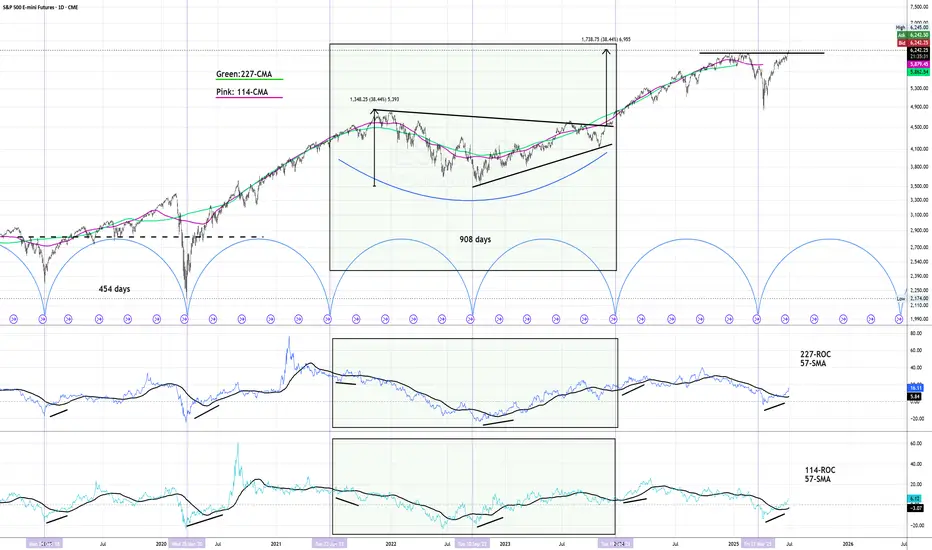
SP500 - Cycle Analysis; New V-Bottom24 Dec 2018 - V-Bottom Trough:
This marks a clean V-bottom. Both the 227-ROC and 114-ROC showed simultaneous positive acceleration after price reacing its low. Shortly after, both crossed their 57-SMA almost in sync — increasing the probability of a sustained bullish move. Price confirmed this by breaking resistance and forming a V pattern. This was further validated by the centered moving average crossover (114-CMA crossing above 227-CMA).
25 Mar 2020 - Deep COVID Crash Trough:
During this phase the priced broke below the support, creating a deep trough. Altough both ROC lines initially showed strong negative acceleration due to the COVID-19 crash, they soon reversed above their 57-SMAs, signaling a major shift in momentum. This coincided with the price breaking above the key resistance which was also crossed in 2019 when confirming the old V-pattern. After this breakout, a brief pullback followed before the uptrend resumed with increasing strength.
22 Jun 2021 to 19 Dec 2023 - Pattern
During the initial period a bearish divergence was visible in the ROC, nevertheless price and rate of change both declined making a low in early October 2022. A technical pattern began to form, which appears to align more closely with a symmetrical triangle; So when measuring its height and projecting it from the breakout point aligns with the new all-time highs that were reached on 27 June 2025.
21 Mar 2025 - New Cycle Trough
A new V-bottom formed shortly after the current cycle began. Both ROC indicators had already crossed their SMAs to the upside, showing early signs of positive acceleration, days before of price broke through the resistance and reached the new record high.
The 227-SMA is likely to cross from below the fast SMA while a possibility of a pullback increase.
Following that, the 114-CMA will probably has the chance to cross back the 227-CMA, with the price potentially confirming a new support level and resuming its uptrend - in line with the broader cycle timeline.
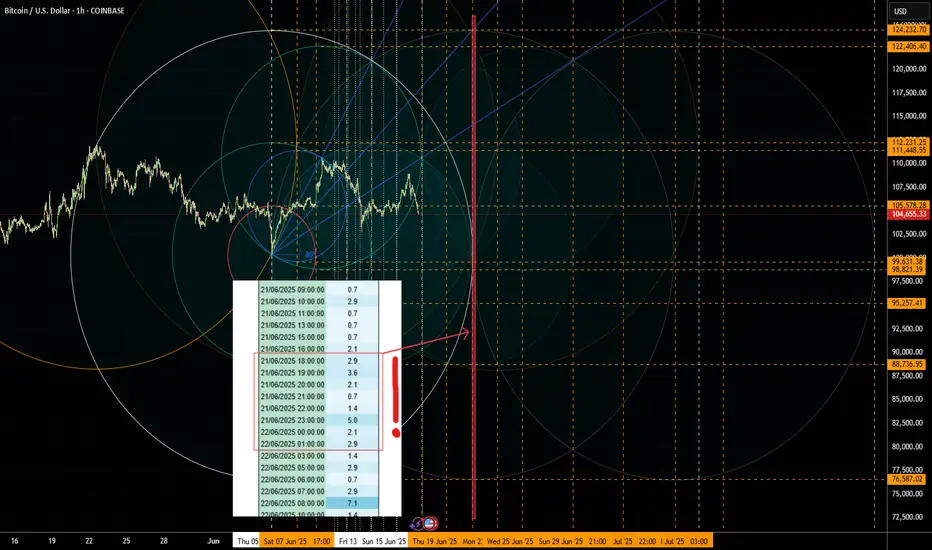
Critical Cycle Cluster 21st-22nd for BTCNote the geometrical confluences in the last hours of the 22nd (UTC-4).
A bigger swing is expected to influence the higher timeframes as well.
Notice the table, many consecutive hours with lower intensity can add up to a bigger cluster. It popped up because of the chart geometry; otherwise it may pass unnoticed.
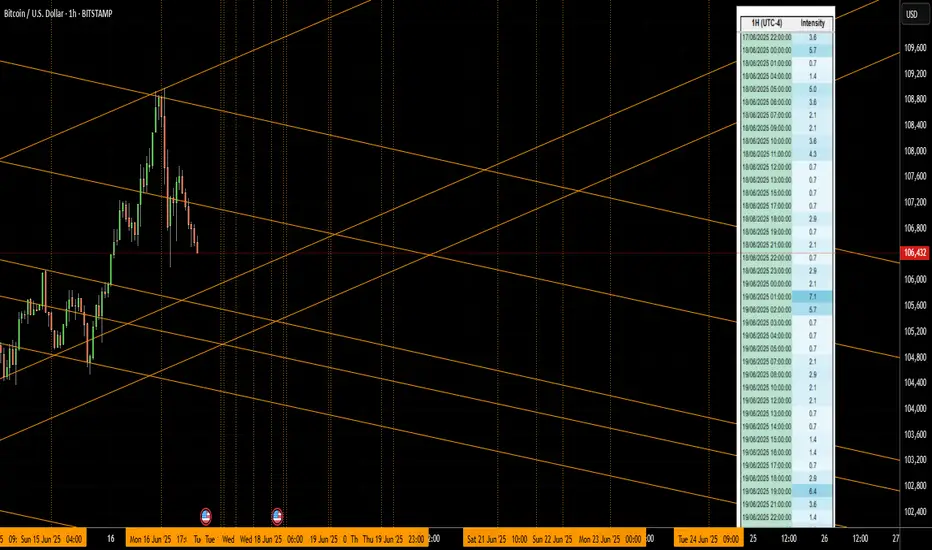
TIME and PRICE Structure for BTC (Intraday)Vertical lines represent cycle clusters.
The price tends to change direction or breakout/accelerate around these timelines.
The right-hand table shows cycle intensity for the next days.
Micron Technology - Starting the next +80% move!Micron Technology - NASDAQ:MU - perfectly respects structure:
(click chart above to see the in depth analysis👆🏻)
Starting back in mid 2024, Micron Technology created the expected long term top formation. We witnessed a correction of about -60%, which ultimately resulted in a retest of a confluence of support. So far, Micron Technology rallied about +60%, with another +80% to follow soon.
Levels to watch: $150, $180
Keep your long term vision!
Philip (BasicTrading)

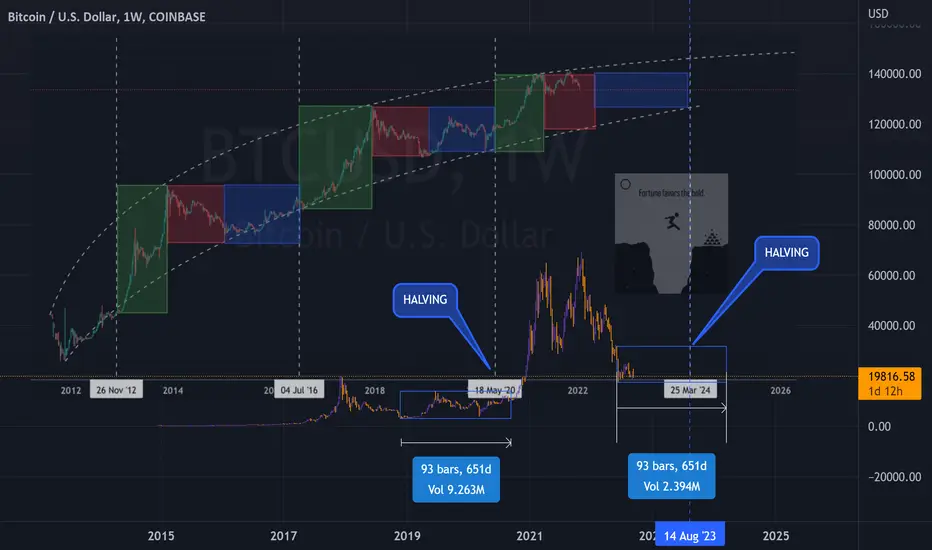
Bitcoin 4-Year Cycle Structure – Technical BreakdownBitcoin 4-Year Cycle Structure – Technical Breakdown
This chart examines Bitcoin’s historical 4-year cycle behaviour, focusing on the repeating market structure observed across the last three cycles: Bull Market → Bear Market → Accumulation/Recovery → Halving → Expansion.
Key Observations:
🔹 Cycle Timing Consistency
Each of the past three cycles has shown a consistent duration between the halving and the final bull market peak—typically between 500–550 days. Based on that timing, the current cycle suggests we are still ~100 days away from a potential macro top.
🔹 Post-Halving Correction is Expected
Corrections shortly after the halving have historically marked mid-cycle retracements, not macro tops. The current pullback is structurally aligned with the 2017 and 2021 expansions, where Bitcoin consolidated before pushing to final highs.
🔹 Altcoin Market Segments Lagging
TOTAL2 (Total Market Cap excluding BTC)
TOTAL3 (Excluding BTC & ETH)
OTHERS (Altcoins excluding top 10 by market cap)
All remain below their prior cycle all-time highs, which historically occurs before the full market cycle concludes. These segments often accelerate after BTC has established dominance, typically in the later stages of the bull market.
🔹 USDT Dominance Suggests More Upside
USDT.D is still trending down, which historically reflects increasing risk appetite and capital rotation into crypto assets. Prior cycle tops have aligned with much lower dominance levels, indicating further downside risk for USDT.D, and potential upside for crypto markets.
Conclusion:
Despite short-term volatility, the technical structure across Bitcoin and broader market indicators suggests the cycle remains in its expansion phase. Timing models, altcoin lag, and dominance signals all point to further upside potential before a full cycle peak is in.
1W:
1M:

Dogecoin - Don't forget the dog now!Dogecoin - CRYPTO:DOGEUSD - still remains quite bullish:
(click chart above to see the in depth analysis👆🏻)
Basically during every major bullrun on Dogecoin, we always saw a correction of at least -60%. Therefore the recent drop of -70% was not a surprise at all but rather a natural all time high rejection. If Dogecoin manages to now create bullish confirmation, the bullrun will continue.
Levels to watch: $0.2. $0.5
Keep your long term vision!
Philip (BasicTrading)

[4h] BTC forming bullish flag at ATHBitcoin will likely form bullish structure here at ATH as we near a breakout. A bull flag or a falling wedge will create significant momentum and push BTC towards 125k+ on initial wave. Cycle top remains ~150k.
Sells into support zone after fill of wedge channelCurrently in 2 sell orders. Setting my TP at the area shown. Current orders have SL in profits (safety blanket if I'm wrong, I can always re enter). Expecting new highs to be hit for BTC! Long term buy set up will have its TP set at 114K.

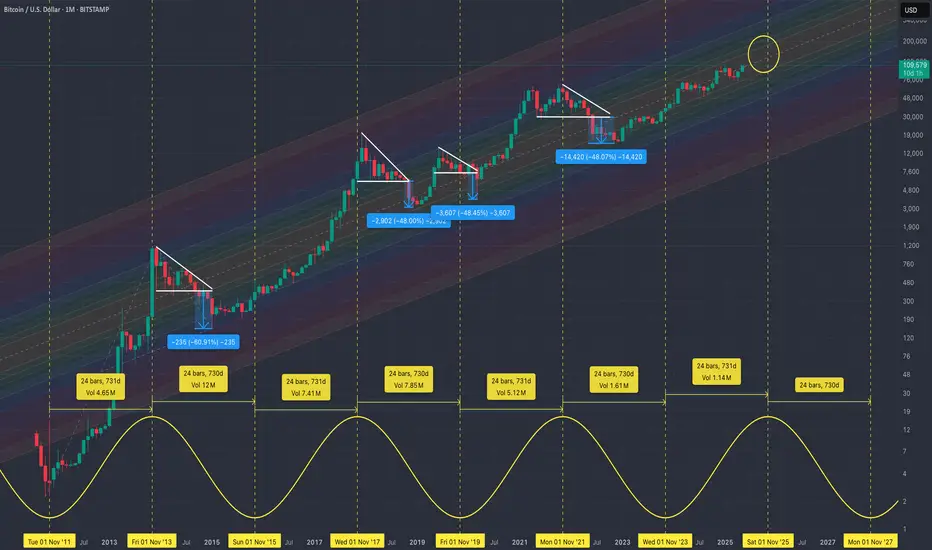
BTC/USD - Bull Market/Bear Market CycleApart from a few deviations, BTC/USD is still following its 731/730 day Bull Market/Bear Market Cycle.
After the next 6 Month Candle which starts July 2025, we may see an even crazier new ATH or we may start early into the inevitable 1 1/2 to 2 year downtrend before the next major BTC Bull-run, which according to this chart, should start around July 2027.
Be on the lookout for a new Descending Triangle Pattern on this one Month chart, this normally leads to a 48% breakdown drop from the bottom of the Descending Triangle Pattern as can be seen previously on this chart.
The 6 Month Chart:
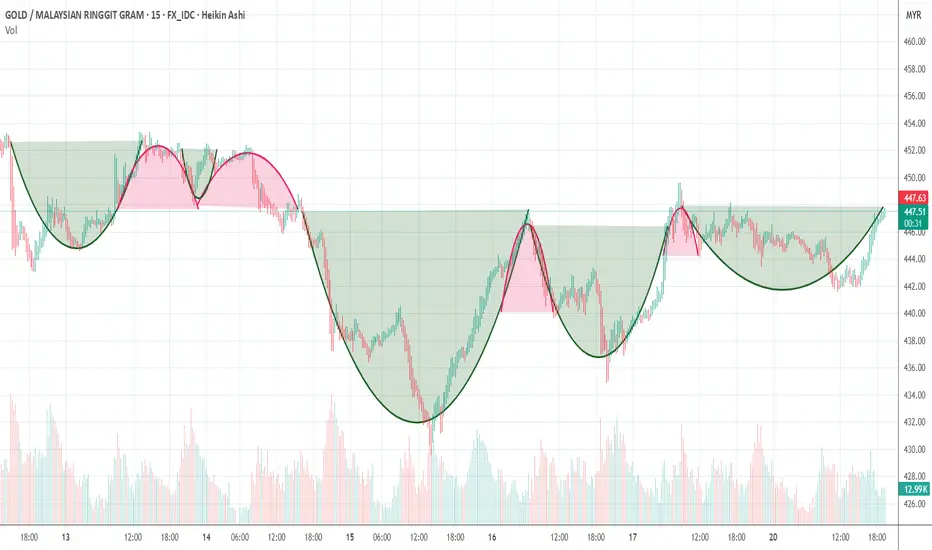
What pattern next?If we look at the chart, we will understand that every time a cycle occurs, it will form an arc. Each arc will return from where it started to complete 1 cycle. So this is where the knowledge of 1 cycle is important to understand the direction of the candlestick chart.

Dogecoin - This Candle Decides Everything!Dogecoin ( CRYPTO:DOGEUSD ) is about to close above support:
Click chart above to see the detailed analysis👆🏻
When we look at the chart of Dogecoin, we can again see that this bullish cycle was starting with a clear rounding bottom formation. This simply means that there is a 100% chance that a bullish parabolic rally will follow and this monthly candle might just be the beginning.
Levels to watch: $0.15, $0.5
Keep your long term vision,
Philip (BasicTrading)

Short Idea On GBPCADBased On :
- Cycles and quantitative analysis
- supply zone
- Small speculators buying at extremes so we do the opposite

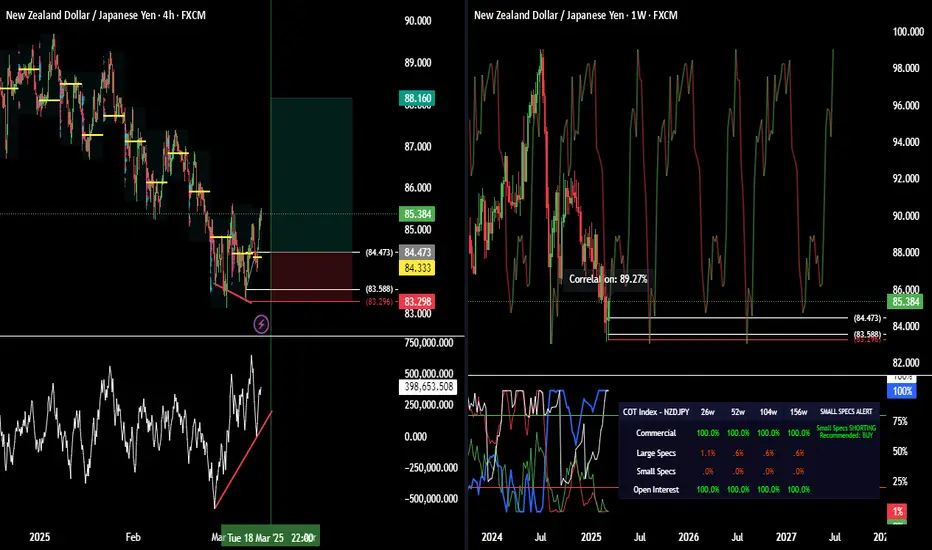
Buy idea on NZDJPYBased On :
- Cycle analysis and quantitative data
- Poiv divergence on 4H
- Demand zone created by engulfing candle
-All cot operators are in the 156 extremes giving strong buy signal and open interest as well
Buy idea on AMAZON (AMZN)Based On :
- Presidential cycle and quinquennial cycle
- quantitative data
- strong demand zone covered by weekly and 2w as well
- divergence on Poiv (open interest from Nq) and Progo
- Undervalued conditions on weekly timeframe

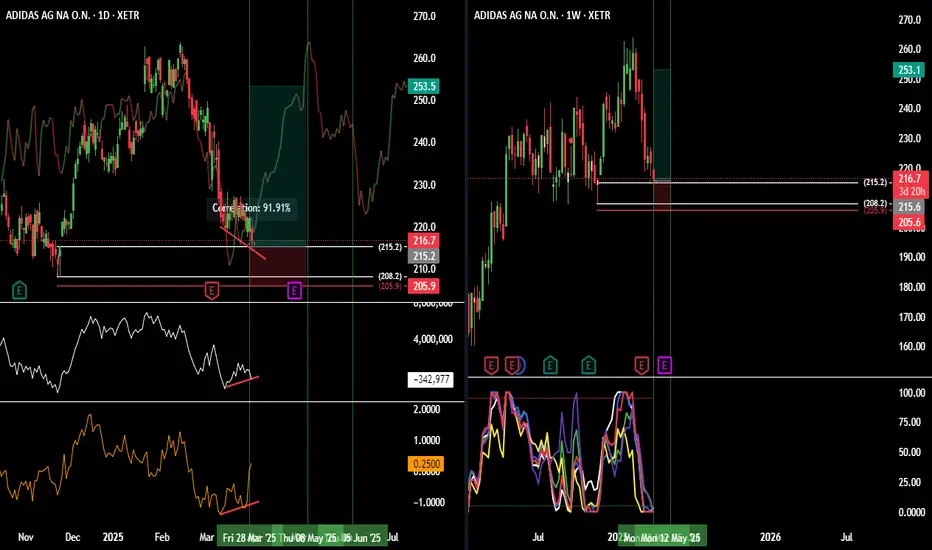
Buy Idea on ADIDAS (ADS)Based on :
- Quinquennial Cycle and other years with similar european monetary policies
- Quantitative data
- Divergence on POIV (with 6E open interest) and Progo
- Undervalued Conditions
- Strong Demand zone covered by weekly demand as well
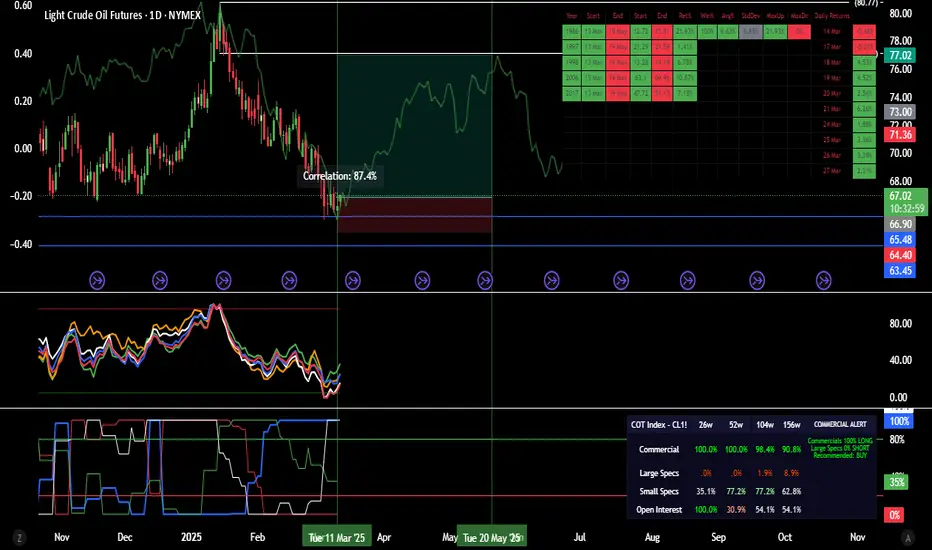
Buy idea on Crude Oil (CL1!)Based on
- Cyclical analysis and quantitative data
- Undervalued Conditions
- Commercials hedging higher
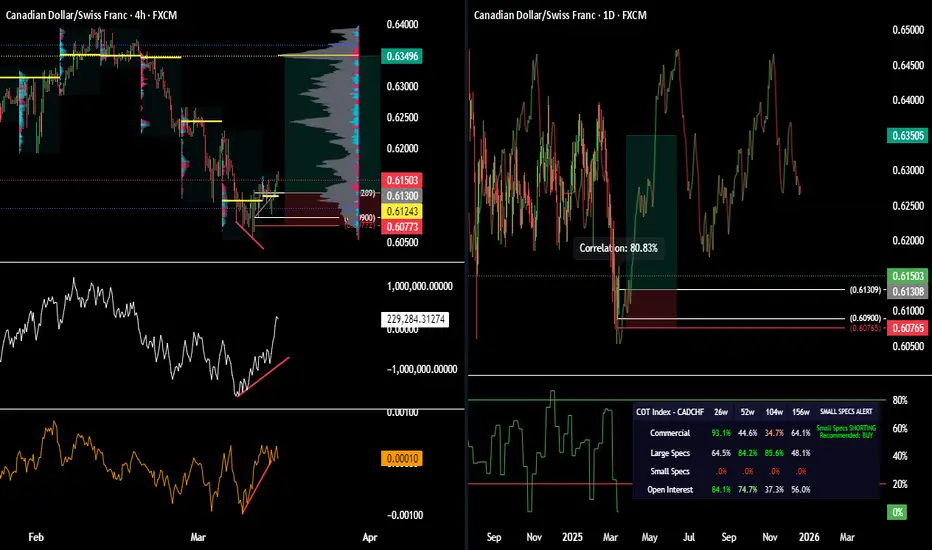
Buy Idea On CADCHFBased on :
- Cycles and quantitative analysis
- Demand zone created by engulfing candle
- Small speculators shorting are 156w extremes on weekly chart
- Divergence on Poiv and Progo
Short Idea on EURNZDBased On
- Williams POIV Divergence on 4H
- Interest rate and real rate differential increased
- Cycle analysis and quantitative data
- Overvalued Conditions

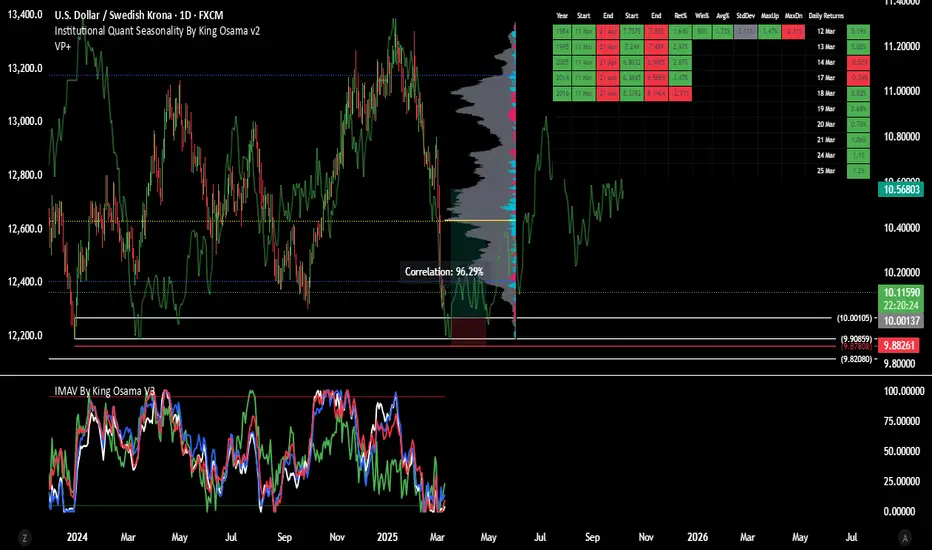
Buy idea on USD/SEKBased on
- Cycle analysis and quantitative data
- Strong Demand Zone
- Undervalued Conditions