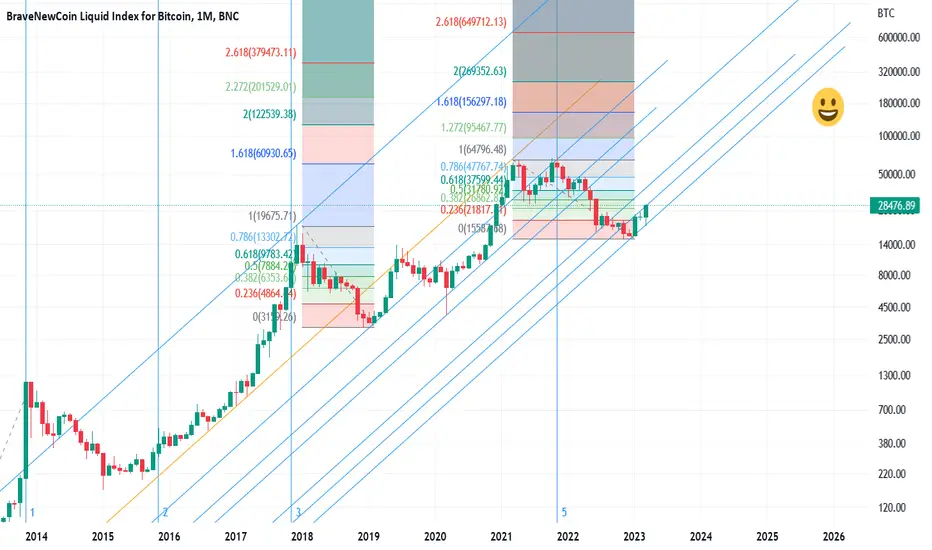
Trend until 2025? Bitcoin BLX macro trendlines and FibsAll lines are cloned from the orange trendline and seem to give nice medium- and long term support/resistance orientation.
Fibs in Log mode.
I guess, that in the coming months and years until my 4-year cycle target zone in Q4 2025, we might break below the lowest trendline in this chart.
Then, a new clone of the trendline might be applied.
"Happy Zone" end 2025 indicated :-)
Cycleanalysis
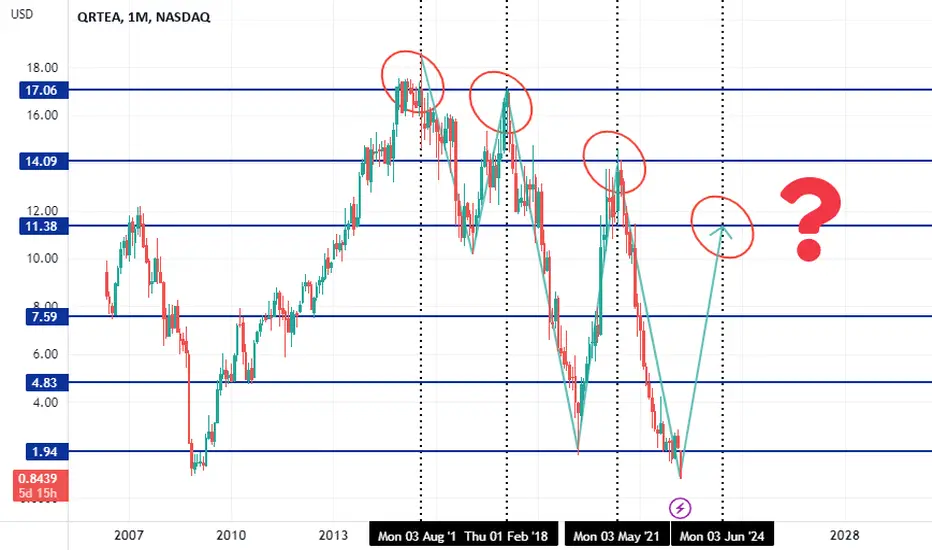
QRTEA, another cyclical peak?Since 2015 this stock has reached a peak every 3 years approximately, as it happened in 2018 and 2021, this time it could happen again around mid 2024 as the price has plumbed drastically, reaching an all-time low.
If this is true, then price could be around 7 to 10 dollars during 2024. If "Project Athens" is succcesfful and the company is able to regain profitability, generate cash, keep good levels of revenues and make a sound transition to streaming and ecommerce, then this stock could recover and gain a strong terrain as before.
How long do you think this downtrend will continue?
LINK - 4 Phases YOU Should Know 📉Hi Traders, Investors and Speculators of the Charts 📈📉
Ev here. Been trading crypto since 2017 and later got into stocks. I have 3 board exams on financial markets and studied economics from a top tier university for a year.
The markets are currently taking a breather after upside price action and this is typically where we expect altcoins to shine. Chainlink is particularly interesting to watch at this point since it has been trading range for an extended period of time. This is bullish according to the Wyckoff Method Analysis and other market cycle- or phase analysis'. This chart presents an easy guide to market cycles considering the moving averages and the macro perspective. Can you guess what phase we are currently in and what comes next? 🔥
Here's another altcoin with great upside potential that you may not have heard of : Shirtium
_______________________
📢Follow us here on TradingView for daily updates and trade ideas on crypto , stocks and commodities 💎Hit like & Follow 👍
We thank you for your support !
CryptoCheck

Bitcoin -> The Final DropHello Traders,
welcome to this free and educational multi-timeframe technical analysis .
On the weekly timeframe you can see that Bitcoin just recently perfectly created and also already confirmed a quite nice inverted head and shoulders with the neckline being exactly at the $25000 area.
From a weekly perspective everything seems quite bullish overall so I am now just waiting for a retest of the neckline before I then do expect the next push towards the upside.
On the daily timeframe you can see that over the past couple of days Bitcoin has just been trading in a sideways range so I am also on the daily timeframe waiting for a retest of the $25000 area and then the next impulse towards the upside.
Thank you for watching and I will see you tomorrow!
You can also check out my previous analysis of this asset:

The Realest Post You Will Read All YearWhy you should care to listen to this.
I first discovered crypto in 2013, but my initial encounter with Bitcoin dates back to 2009. At the time, I dismissed a considerable amount of Bitcoin as a trivial payment for a World of Warcraft private game server admin position. However, in 2011, I was reintroduced to Bitcoin and purchased a significant amount for $10. Unfortunately, after losing my father and misplacing the hard drive containing my Bitcoin during his eviction, I was filled with regret by 2013. Now, I can look back and laugh at those experiences, as they led me to see a much bigger picture. Bitcoin operates in cycles, and it's easy to get caught up in the present moment, listening to influencers claiming that it's all over for the sake of views on their channels. I'm here to explain the true nature of the market, hoping to provide you with a sense of clarity and liberation.
A few years ago, Warren Buffet's quote, "Buy when there's blood in the streets, even if the blood is your own," was as ubiquitous as the definition of insanity. Despite its overuse, the quote held true. However, when faced with reality, people still tend to act on fear. Market cycles are influenced by fear, as seen in the news, lunar cycles, and retrogrades' gravitational waves. It is fascinating how the market operates based on these factors.
There are two fundamental human emotions: fear and love. Everything can be traced back to these emotions in one way or another. Our minds are wired to respond strongly to fear, which is why our reality often revolves around it. Trading on higher timeframes can be easier for some because it doesn't require constant attention to the cyclical nature of the market.
I have previously mentioned that this recurring cycle will happen once more before the market undergoes a significant change. Currently, there is widespread fear of banks failing, but if we look at history, such events were never anticipated. The 2008 crash began just after reaching all-time highs.
In the market, traders often encounter psychological tactics employed by market makers to influence their actions. Emotionless trading is essential to navigate these tactics. By utilizing basic technical analysis one can anticipate market movements, as demonstrated in my earlier idea from last year (I will link to it for reference).
Many people in the market cannot afford to trade their $100 or $1000, but they would fare better if they identified promising opportunities and left their investments to grow while they worked on increasing their account balance. High-margin trading, is akin to gambling. I have lost significant amounts in high-margin trades, watching the market move to my liquidation point on one exchange while others remained unaffected.
It's crucial to understand that long-term investing generates wealth. Allocating 10% of your total balance to promising altcoins is a wise strategy. Focus on consistently investing in cryptocurrencies and stocks while working hard, and you'll see success. Betting on the unlikely scenario of the US dollar failing and causing societal collapse isn't productive.
I predict that Bitcoin will experience an upward wave for a few months, followed by a retracement of that wave, and then gradually work its way up to all-time highs, just like in previous cycles. This may be difficult to visualize amid the world's turmoil, but adopting a month-by-month approach rather than an hour-by-hour one can provide clarity.
Stay resilient and maintain a clear mind. You can't turn $100 into a million dollars in two days. Instead, work hard, save, and invest gradually in the market. The best advice is to earn $10,000 to $100,000 from the market and then start your own business.
Remember, this is just my opinion, and I hope it helps. Bitcoin has repeatedly defied predictions of continuous decline. While it's possible we could see a drop to $12,000 - $13,000 due to a black swan event, similar to March 2020, it's not worth waiting idly for that moment. Choose the long route; your life will still be here in two years, and impulsively risking everything won't bring lasting change.
If you're interested in learning how to trade like a pro and want access to unique tools, visit my website, as mentioned in the description. If you trade NASDAQ futures, you'll be thrilled with our recent release.
Take care and remember to invest wisely, focusing on long-term growth rather than seeking immediate results. Slowly add to your investments with each paycheck, and avoid waiting for the "perfect" price. If you listen to anything I have to say, remember this: the right time to start investing is now.

BTC drawdown with subsequent bull cycle - Peak to troughBTC Peak to trough showing bull markets and subsequent bear markets in percentage terms. It really is that simple, from a buy and hold strategy.

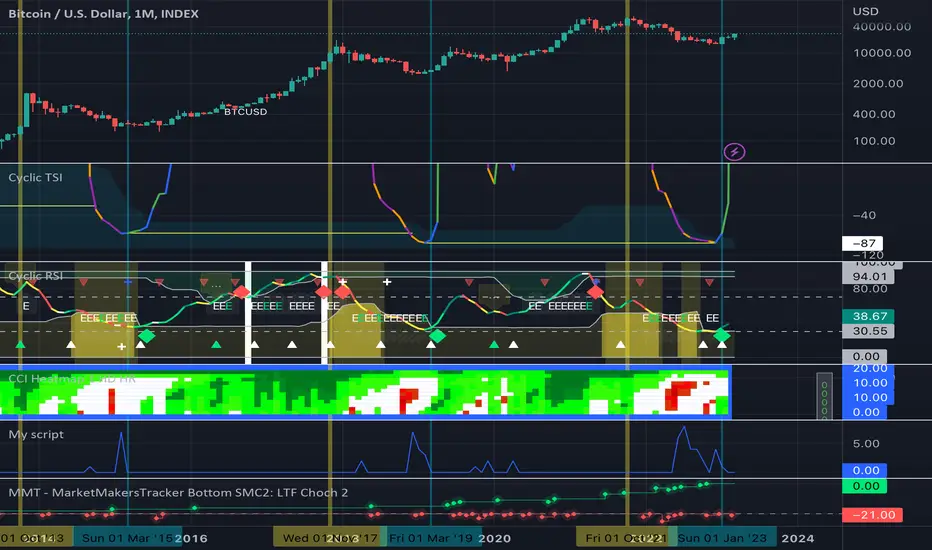
How to execute good DCA strategyINDEX:BTCUSD
DCA is a very good strategy to invest into "future" like bluechip or bitcoin/ethereum. However, one of biggest problem of DCA is "too soon" DCA period.
This chart shows you how to archive good DCA from the beginning using cyclic indicator based on dominant cycle idea.
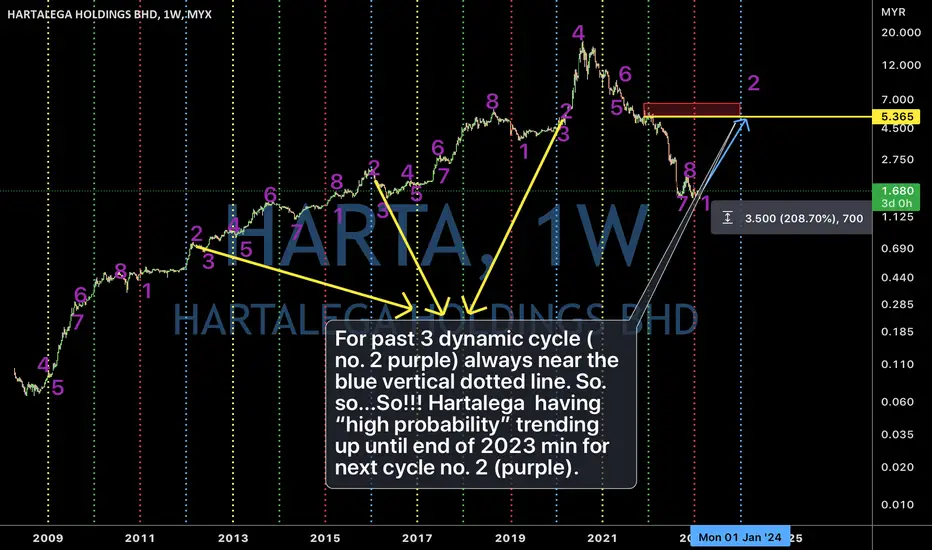
Hartalega. “Simple” dynamic cycle analysis. 21/Feb/23.Hartalega. For its past 3 dynamic cycle ( no. 2 purple) always near the blue vertical dotted line. So.so...So!!! Hartalega having “high probability” trending up until end of 2023 min for next cycle no. 2 (purple).
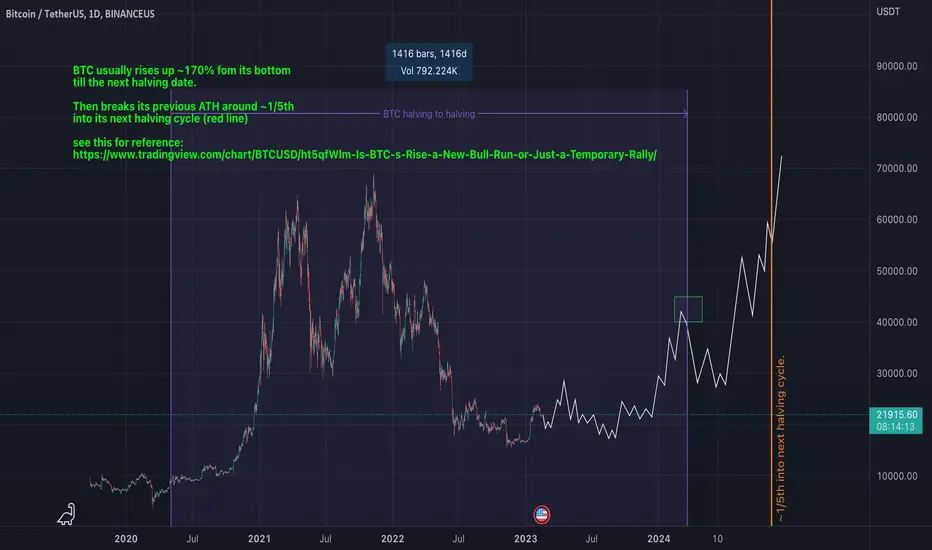
BTC halving based price predictionBTC usually rises up ~170% fom its bottom till the next halving date.
Then breaks its previous ATH around ~1/5th into its next halving cycle (red line)
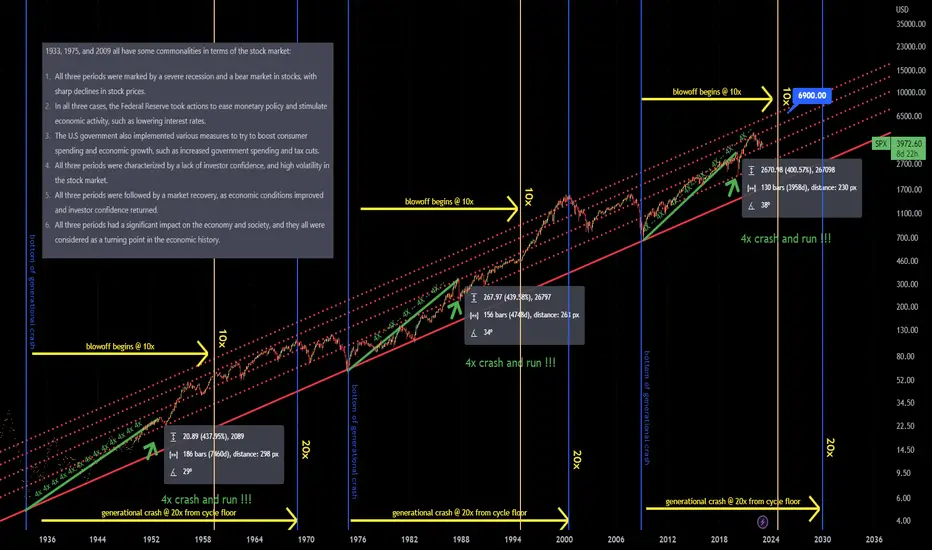
SPX - The Road to 6900 Begins “History never repeats itself. Man always does.”
A deep look into SPX History exposes the path of a market cycle and tells us the truth on where markets are headed.
Percentages don't lie.
See you guys at 6900!
VLTA looking juicy as it starts its Bottom bounce moveVLTA making its move.... watch the volume . Bottom bounce on TSV making all the right moves and volume 5x the avg.
iCantw84it
01.18.23

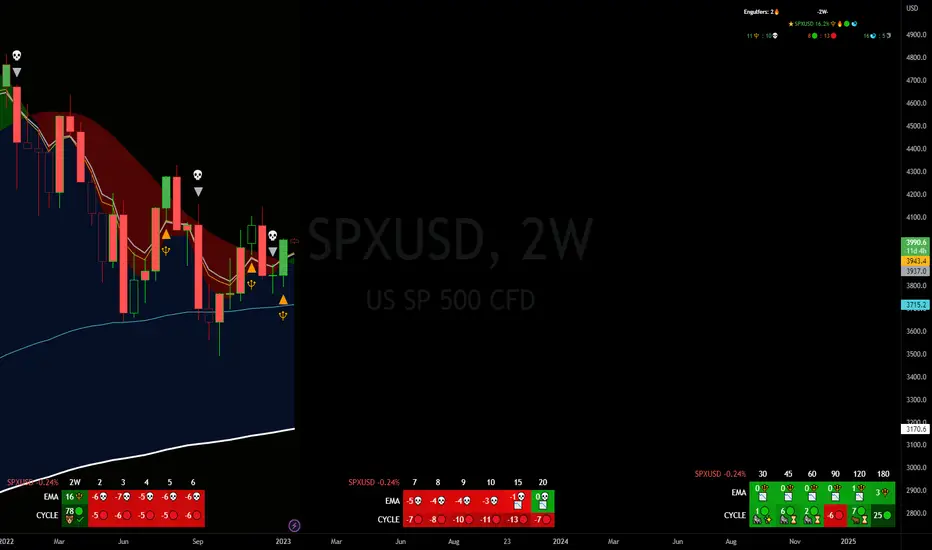
Potential start of the bull marketFOREXCOM:SPXUSD
As of 01/16/2023, I believe the birth, or first sign of a potential return to bull market to be today. In the process of reviewing ema, macd, and cycle based indicators, we should see uptrend begin to take off leading back into 4300 by February '23. This can all change with fed's taming of inflation, or any external circumstance. But if trajectory remains strong, we should have a confirmed uptrend by start of this February. Refer to the 2 weekly chart, as this is the core of my thesis for the return to bull market.
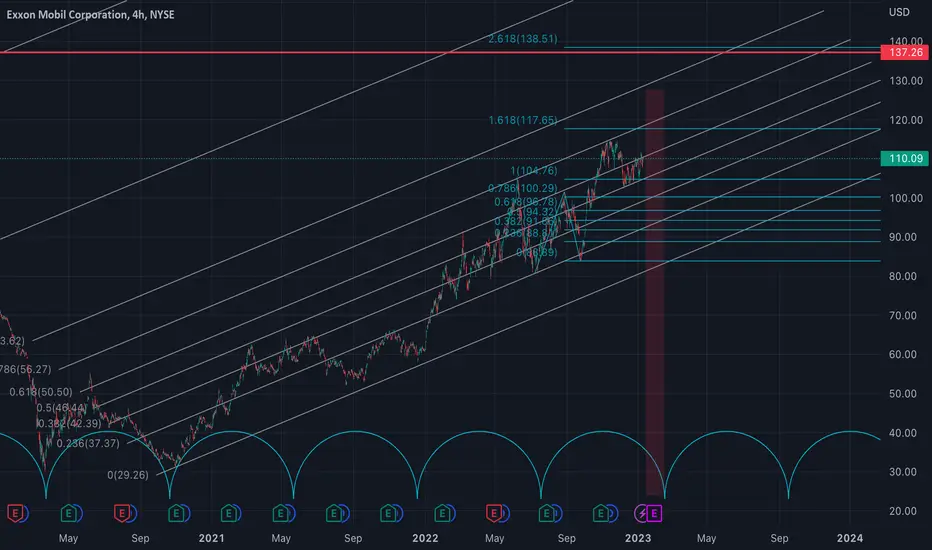
Exxon Mobil time cycle and pattern analysis**disclaimer: this post reflects my personal opinions from my own charting analysis and should not be used as financial advice of any kind. There are no guarantees in the market and I am just a guy on the internet***
This is a very brief analysis of XOM stock which is approaching a significant swing trading cycle trough (in blue) with a trough around February 16-17 as an estimate.
There is a fib channel and extension here, the 161.8 extension has not been hit (117ish). It might not get hit. Or it may exceed that and hit the fib channel just above it around 120. That is where I'm looking for a top - 117-120, HOWEVER; if the current part of the bubble that has grown here is just a bear flag after a top was already put in, we will know very soon as price will start making lower highs and lower lows on shorter time frames. In that case we could see a decline from HERE into that trough in the middle of February. In any case, I believe this chart has either topped, or is about to top.
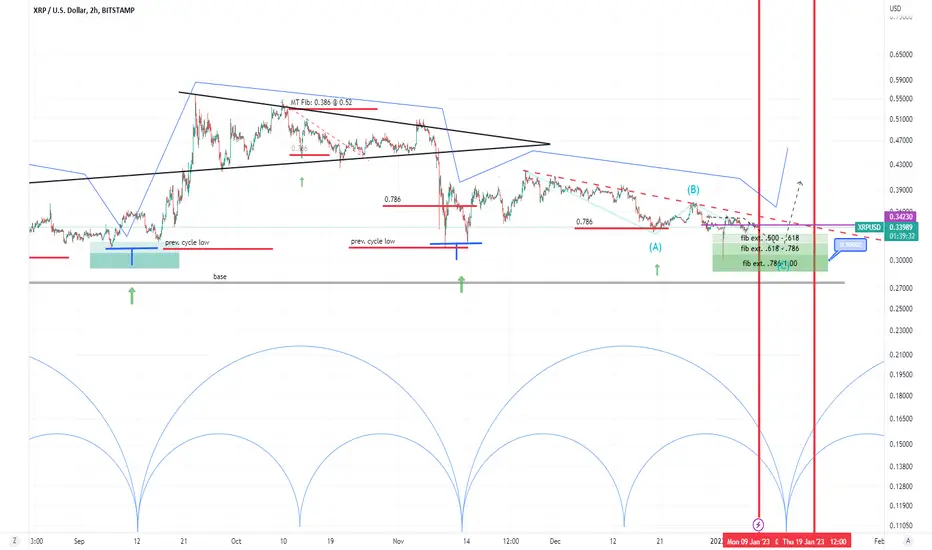
Get ready for Friday ;-)XRP is in corrective phase of nested cycles and this spike from 1'st of January indicates that there's more pain to come. I personally see this move as some speculative dump caused by 3'rd party with huge number of tokens and it can be potential "early" bottom of this cycle. Nevertheless, corrective phase is still not finished and by end of the week we might finally form a trough. Personally, I'm not expecting new lower-low, rather test of .30 spike.
Buy zones:
Fib ext: 0.618-0.786 @ $.32 - $.30
Fib ext: 0.786-1.000 @ $.30 - $.288
Buy timing:
Between 1/9 - 1/19, ideal cycle bottom Friday night!
Support with XRP: rNCUtwqnsKa3k5poB5WYDirhwhcoyr9W7D
BTC: One more month of sideways action?BTC is moving with 80 day long cycle, last cycle was negative ( late November ) and current cycle seems to be very weak, we already had rejection from 0.386 level and for now it's quite boring. Technically we are already in small 40-day cycle which should form a bottom between 2/9- 2/24. In the beginning of February, I'm expecting corrective phase of cycle and visit of Fib-extensions levels marked with 0-A-B.
Buy zones:
Fib ext. 500 - .618 @ 15335 - 14680
Fib ext. 618 - .786 @ 14680 - 13670
Regardless of price action pay attention to timing, second week of February should trigger some bullish impulse.
Support with XRP: rNCUtwqnsKa3k5poB5WYDirhwhcoyr9W7D

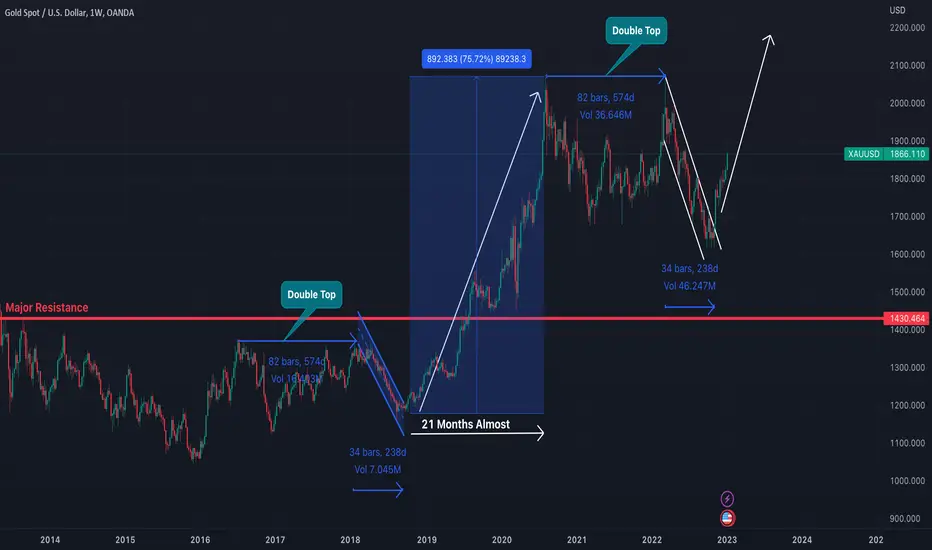
GOLD NATURE PREDICITON | 8-JAN-2023By looking at the week TF chart I analyzed the following things that I want to share:
1. Duration of the first double top was 567 days
2. Duration of descending channel was 238 days
3. Formed a bullish rally (approx 76% up) of 21 months by breaking a major resistance level
4. Duration of the second double top was 574 days
5. Duration of descending channel was 238 days again
So the market manipulators (Big Boys) hopefully will move the market upside
Let's see what happens
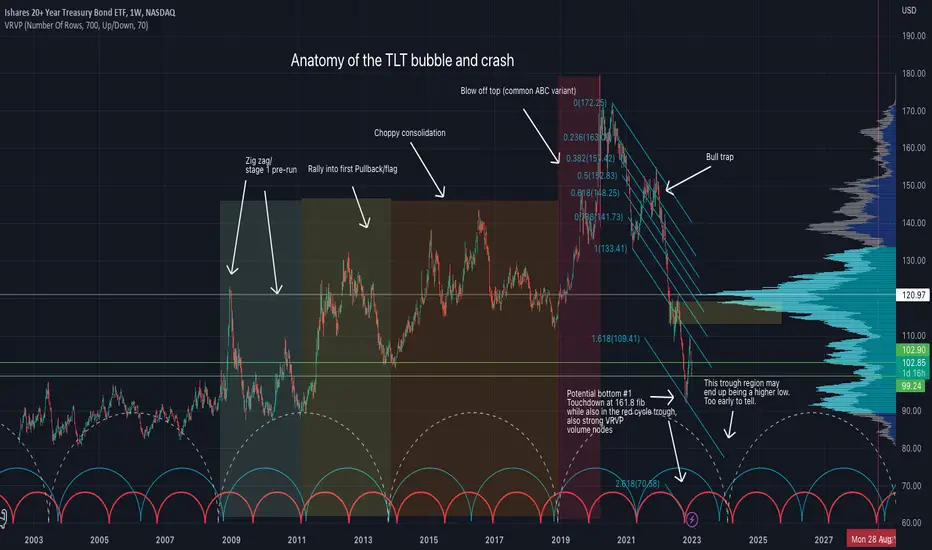
The Anatomy of the TLT; Cycle analysis by ThestructuredThis is my dissection of the TLT chart into the classic stages of a bubble, with time cycles. Each stage is present and the TLT appears to be in a bottoming process. I'm a big fan of using Fib channels combined with time cycles, because with fib channels, you are looking for a certain line to get hit, wherever that may be, as opposed to traditional fib retracements and extensions where you are looking for exact numbers. I find that with regular fibs, price often overshoots or undershoots them, whereas using a channel, it is more so a time based touch of a line, which si why it works so well with time cycles.
Last year I had used these fib channels and cycles to find the current bottom on the TLT, which was an exact touch of the 161.8, right at a (red) time cycle trough region, and also at a strong volume profile node.
There are larger, converging cycle troughs shown which should be somewhere in the September area of 2023. It is unclear at this time whether that region will be a higher low, or 'the bottom' (assuming that the 92 area wasn't already 'the' bottom, which it might have been.
In any case, I am planning on investing this fall in that major trough zone, regardless of if price is higher or lower than it is now, when that timing region comes.
Disclaimer: These charts and posts are a reflection of my own analysis and opinions based on my own analysis. I could be wrong, nothing is guaranteed, and my posts are for educational purposes only, as they are my own pure speculation, and should not be taken as investment advice of any kind. Do you own DD!
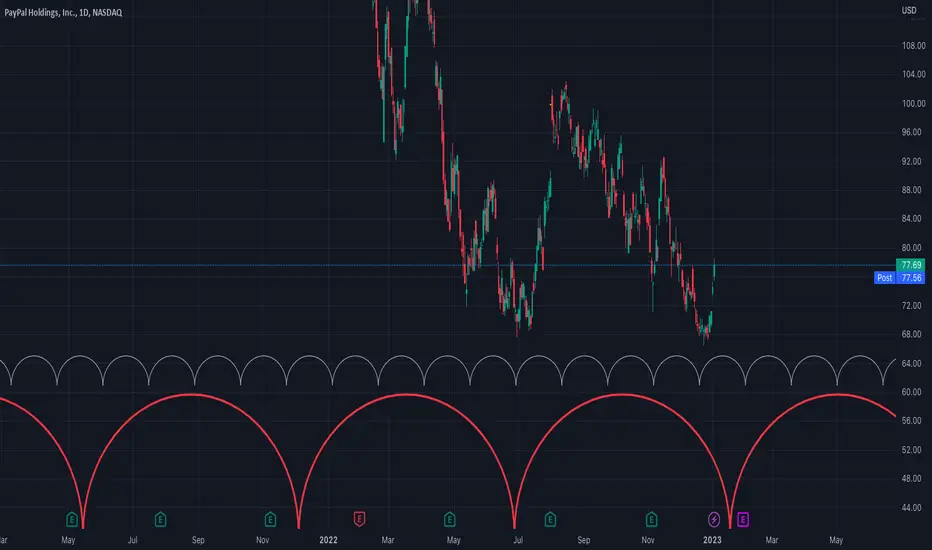
Paypal stock in a final bottoming processPaypal stock appears to be in the final bottoming process of its bubble crash pattern. While I personally have not owned or traded this stock since July of 2022, the time cycles on the chart have not been changed since that time, and yet continue to show accuracy.
The larger red cycle is a zone, and if the stock pulls back a bit just before earnings, I will be tempted to average in since I missed the smaller white cycle trough that just passed which led to a $10 parabolic squeeze already.
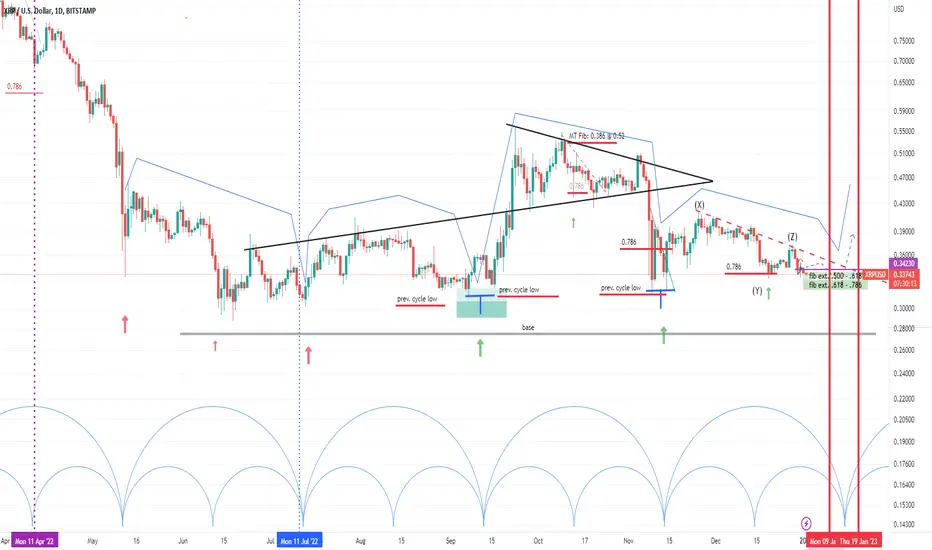
10 more days of consolidation.XRP is quite cyclic in past few months, we can clearly see 61 day dominant cycle. Previous trough formed in mid Nov is quite important right now, we are still 12 days away from ideal next trough and 0.786 was already violated what indicates that we can expect test of that low. I personally expect rather sideways action in next week or two with potential buy zone taken from fibonacci extensions levels between XYZ.
Timing: Trought should be formed between 9'th and 19'th of Jan.
Buy zone 1: between 0.33-0.34
Buy zone 2: between 0.32-0.33
Support with XRP: rNCUtwqnsKa3k5poB5WYDirhwhcoyr9W7D
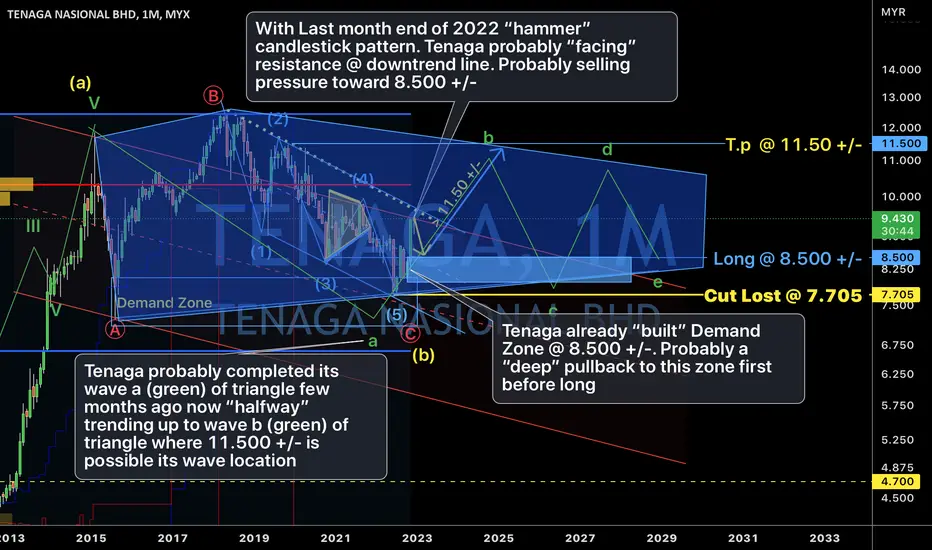
Tenaga. Probably “bottomed” few months ago. 30/Dec/22Tenaga, as “main contributor” of KLCI Index probably “bottomed” so as KLCI. It’s wave a (green) of triangle already done few months ago and now “halfway” trending up to wave b (green) of triangle where 11.500 +/- is possible its wave location..
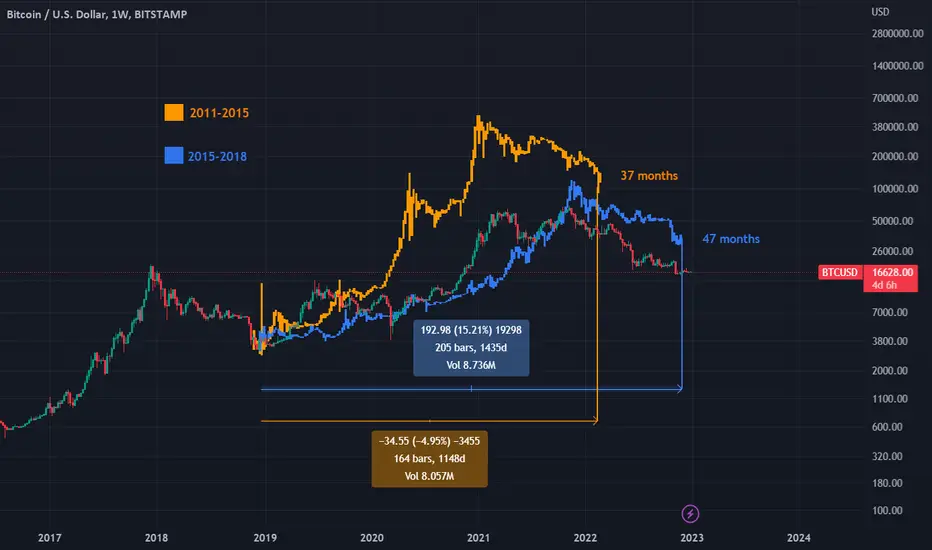
(BTC-USD) Bottom to Bottom - (2011/15 - 2015/18)Period of each previous cycle from bottom to bottom:
2011 cycle (orange line) - 1148 days to reach the bottom.
2015 cycle (Blue line) - 1435 days to reach the bottom.
Current cycle - 1470 days...
BITSTAMP:BTCUSD
BINANCE:BTCUSDT
The Exit - How to take profitsToday’s content:
1. Why each exit is within 3 months?
2. Why I turn from investing to trading the US markets since Jan 2022 and onwards
If you have been following, today’s is the 6th tutorial in our Trading Series:
1. “The buy strategy”
2. “The sell strategy”
3. “Developing long & short-term view”
4. “Choosing between the time frame”
5. “The entry”
6. “The exit”
Refer to the links below or check the previous 5 videos.
E-Mini Nasdaq Futures
Minimum fluctuation
0.25 point = $5
1 point = $20
10 points = $200
100 points = $2,000
Disclaimer:
• What presented here is not a recommendation, please consult your licensed broker.
• Our mission is to create lateral thinking skills for every investor and trader, knowing when to take a calculated risk with market uncertainty and a bolder risk when opportunity arises.
CME Real-time Market Data help identify trading set-ups in real-time and express my market views. If you have futures in your trading portfolio, you can check out on CME Group data plans available that suit your trading needs tradingview.sweetlogin.com

Crude Oil Cycle Analysis 12-16-22 This is a crude oil series I'm doing as of late.
In this video, I go over the Weekly & Daily cycles, look at the Elliott wave count, and some statistics for the month of December.
I'm looking at how this week is going to close, positive or negative.
Let me know your thoughts on what you see playing out in November for crude oil.
