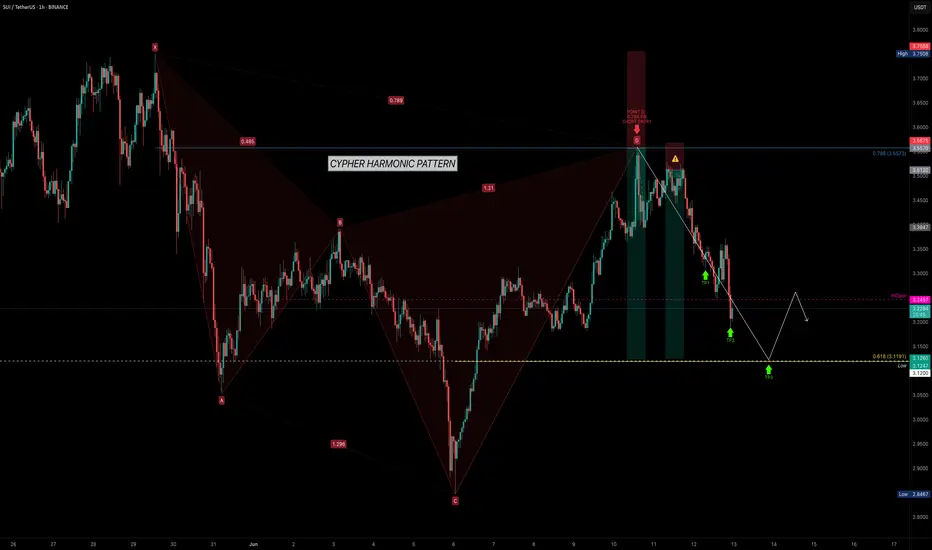
SUI — Trading with Geometry: Why Harmonics Work So WellSUI has been respecting technical levels with remarkable consistency. After bouncing from the $2.8467 low, it surged sharply — completing a clean Cypher Harmonic Pattern. This led to a high-probability short setup at the 0.786 Fibonacci retracement (Point D) around $3.5573.
🎯 Trade Setup Breakdown
Pattern: Cypher Harmonic
Entry (Point D): $3.5573 (0.786 retracement of XC)
Target: $3.1191 (0.618 retracement of CD)
Stop-Loss: Above Point X
The 0.618 fib retracement of the CD leg coincides with a significant key low from May 6, 2025, adding structural confluence. This is an ideal level to monitor for absorption, reaction, or potential reversal behaviour.
🧠 Educational Insight: How to Trade Harmonic Patterns Like a Pro
Harmonic patterns aren't just visually appealing — they represent high-probability setups based on market structure, Fibonacci geometry, and behavioural cycles. The most critical part of every harmonic pattern?
You enter at Point D.
Whether the pattern is bullish or bearish, Point D is your trigger:
In bearish patterns (like this Cypher), you short from Point D.
In bullish patterns, you long from Point D.
This works because Point D marks the exhaustion of the corrective leg, where trapped traders and liquidity often sit. The structure often aligns with supply or demand zones, order blocks, or FVGs (Fair Value Gaps).
💡 Important: Harmonic patterns are most effective on higher timeframes — 4H and above. On lower timeframes, noise increases and reliability drops significantly. For clean execution and meaningful structure, stay with mid to high timeframes.
Here’s how to trade it effectively:
✅ Wait for the full pattern to form — don’t front-run
✅ Use fib levels and structure confluence to validate Point D
✅ Use order flow tools (like Exocharts) to confirm absorption or volume shift
✅ Enter on Point D with your stop-loss just beyond X
✅ Take profits at common retracement levels like the 0.382 or 0.618 of the CD leg
Patience is key. Harmonic traders wait for the market to complete the cycle — then strike with a plan.
📌 Final Thoughts
SUI is delivering clean harmonic respect, and this setup is no exception. Whether you're already short or waiting for further confirmation, keep an eye on volume, liquidity zones, and reaction levels around $3.1191. If this zone holds, it may serve as a pivot for the next move.
Pattern. Precision. Patience. That's how you catch high-probability trades like this.
_________________________________
💬 If you found this helpful, drop a like and comment!
Want breakdowns of other charts? Leave your requests below.
Cypherharmonics
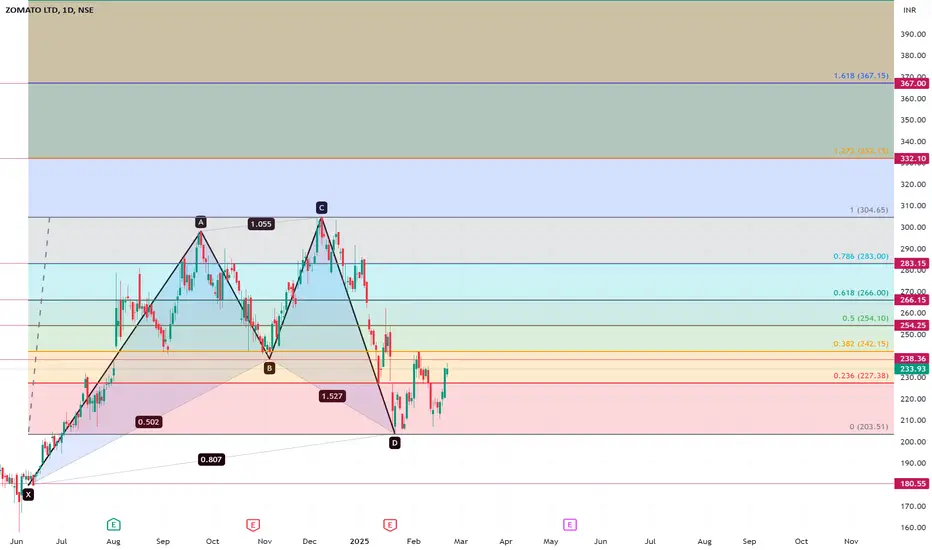
Zomato short to Medium ready for 300 - 350Zomato has formed a cypher pattern on weekly time frame.
On short to medium, it has potential for following targets.
254 / 266 / 280 / 305 / 330 / 350
242 & 254 is a strong resistance, weekly close above this will have above potential.
Consider 200 to 180 as SL. or It could be considered as buy on dip stock.
Hindalco Short to Medium term target 900Hindalco forming Cypher pattern. It will have a resistance at 665.
Weekly candle close above 665 will have potential upside with following targets
Target1: 665
Target2: 700 & 725
Tagrte3: 775, 830 & 900
At current state SL: 550
At 665, SL: 640

Classic Cypher PatternTatacomm made made cypher pattern on daily charts wih decent oi.
All indicators (MACD,RSI & ADX) positive.
Risk:Reward = 1:3

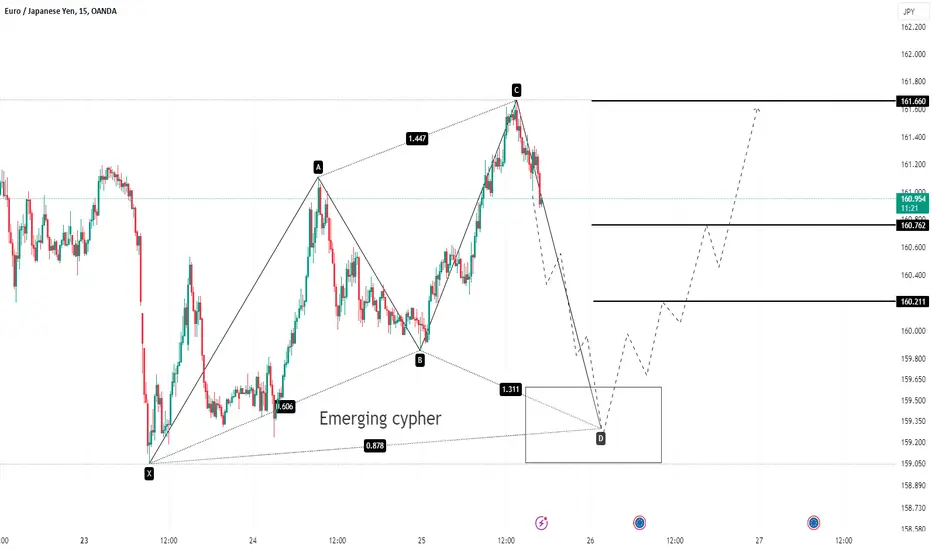
Emerging Bullish Cypher on EURJPY Signals Rally ContinuationHello Traders,
Below is my short-term outlook of EURJPY.
An emerging bullish Cypher pattern has been identified on EURJPY (M15 timeframe). This pattern signals a brief market correction, allowing new buyers to join the EURJPY rally. Completion of this pattern is expected around the 159.592–159.060 region, followed by a likely bullish continuation.
Price targets are 160.21, 160.762, and 161.660, with the outlook being invalidated if the price closes below 159.050.
Do let me have your take on this pair in the comment below.
Cheers and Happy Trading.
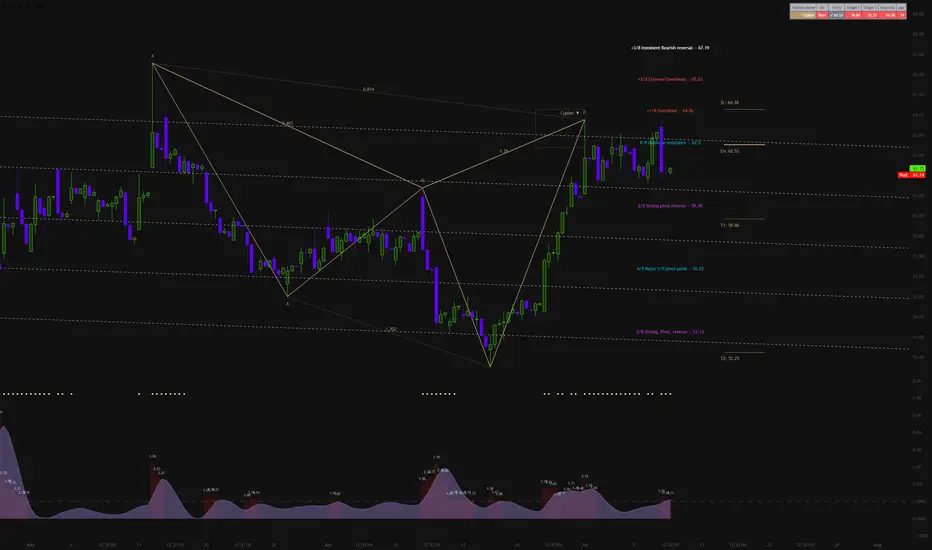
Cypher Bearish Pattern on ROKU (3H Timeframe)🔍 Overview:
Spotted a bearish Cypher pattern on ROKU's 3-hour chart. This setup looks promising for a short trade! 📉 The RVOL average is increasing, which gives us a bearish confirmation. However, be cautious as the "High Volatility" dots indicate potential for drastic and unpredictable moves. 📊
📉 Chart Analysis:
1️⃣ The Cypher pattern indicates a potential reversal from the recent uptrend, with resistance around the $64.28 level.
2️⃣ The increasing RVOL average supports the bearish sentiment, suggesting more sellers are entering the market. 📈
🎯 Trade Setup:
Entry Point: Look for confirmations as the price approaches the resistance level.
Target 1: $58.86 💰
Stop Loss: $64.28 🚨
📝 Why I'm Interested:
The combination of the Cypher pattern and increasing RVOL provides a strong bearish signal. The "High Volatility" dots highlight the need for caution but also present an opportunity for quick profits if managed carefully. 📊📉
📅 Timeframe: Monitoring this setup on a 3-hour chart, so keep an eye on shorter-term price movements. ⏳
🔔 Stay Updated: Be ready to adapt your strategy as the price action unfolds. Let's get it! 🤑✌️
#ROKU #CypherPattern #RVOL #HighVolatility #Trading #StockMarket #TechnicalAnalysis #TradeTalkFarsi 📉🐻
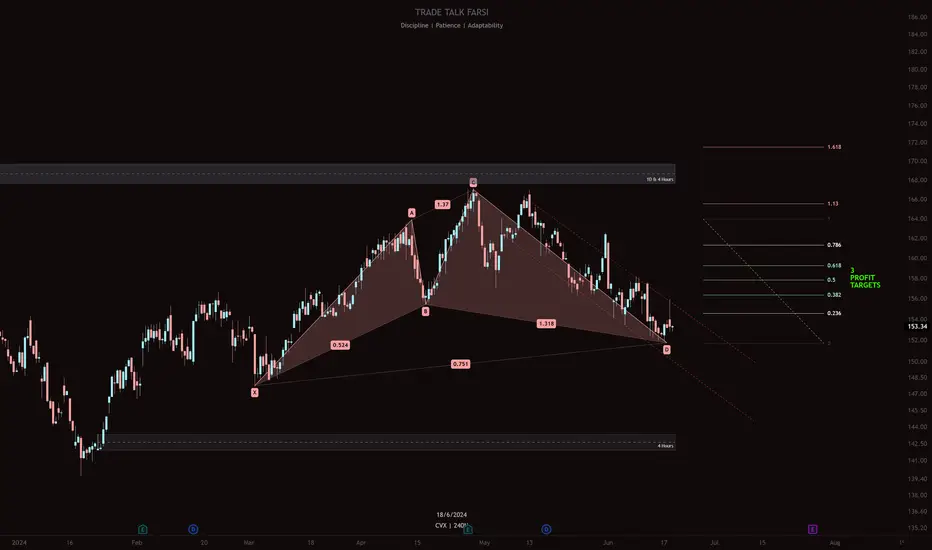
CVX making bullish Cypher Harmonic PatternCVX is in the process of making a bullish Cypher Harmonic Pattern. We are in a zone that could possibly become the bottom, but first we have to establish the bottom. And then we can aim for 3 green fib zones for taking profits. Please note that we are in a downward channel move, so for sure, breaking out from this channel can be very bullish.
PYPL making bullish Cypher Harmonic PatternPYPL is in the process of making a bullish Cypher Harmonic Pattern. We are in a zone that could possibly become the bottom, but first we have to establish the bottom. And then we can aim for 3 Golden fib zones for taking profits.

HindalcoHello & welcome to this analysis
In this chart we can see
a diagonal breakdown which bought the stock down to 380
where it went into form a bullish harmonic cypher
to be followed by a bullish RSI divergence
It could now attempt further upside till 425, then 440 & 455 as long as it sustains above 400.
Good set up for momentum at the moment.

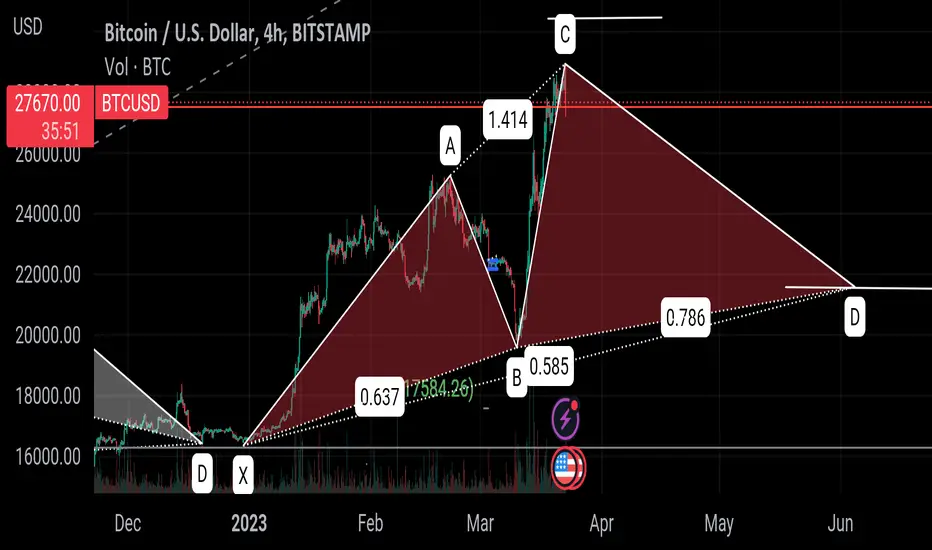
Perfect cypher? Looking good for a cypher setup?
Perfect so far 👀 perhaps we wont hit my target range of 16500-18500 after all 🤷♂️
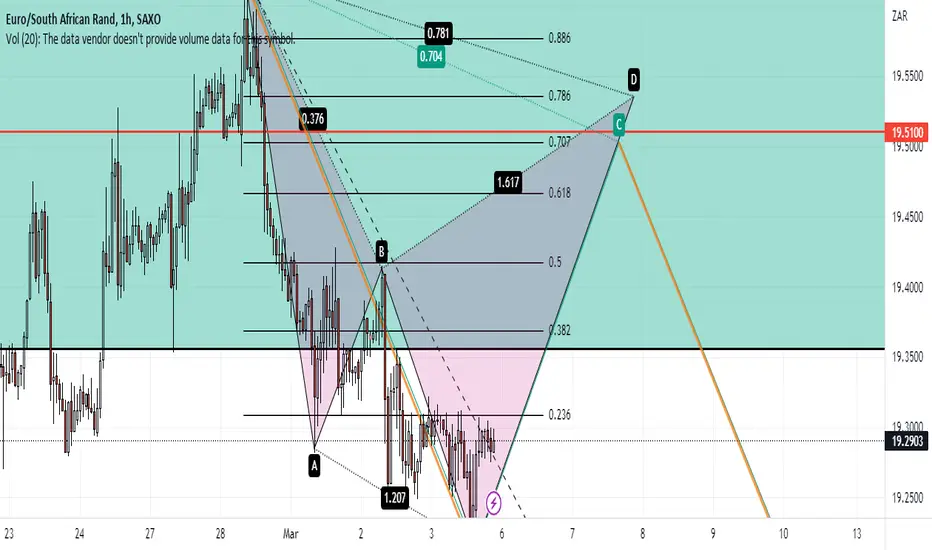
EURZAR H1 Bearish Cypher EURZAR is currently in a Weekly order block. We have vector candles showing a decisive three pushes to the current low. RSi and TDI should read lows and Shark Fins in this region. Look for a Head and shoulder pattern to enter long toward the 70.7Fib retracement of the XC leg. Usually pattern failure may occur around the Fib level around the 19.5100 level. If failure occurs then we look to go short at this region until an ABCD pattern is formed as shown. If price manages to breakthrough to complete the cypher pattern then we are looking at minimum two pins to this region before we enter short. M15 may show significant divergence and a close ofprice below EMA 13 would signal a good entry.
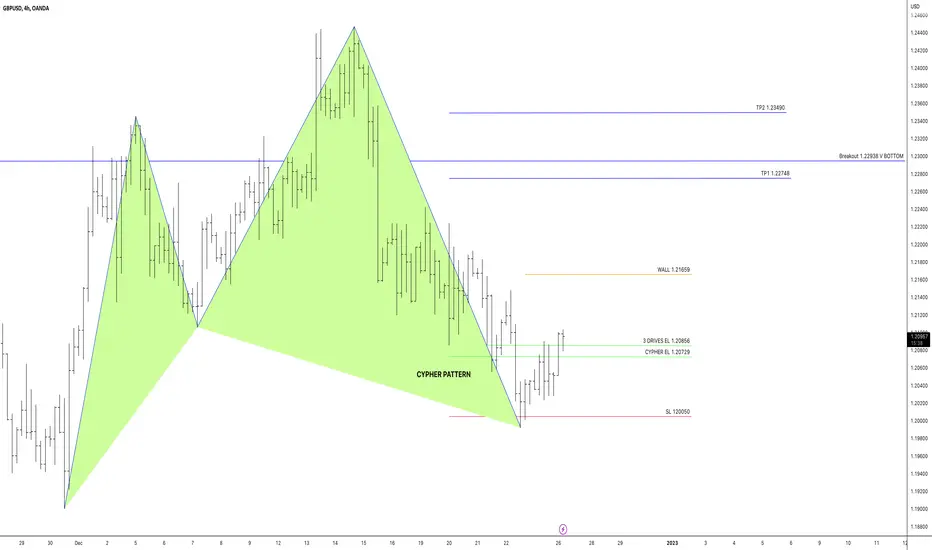
GBPUSD ADVANCE HARMONICS PATTRN GPUSD has formed an Advance Harmonics pattern on its hourly chart.
The price is trading the entry level
CYPHER EL 1.20729
WALL 1.21659
TP1 1.22748
TP2 1.23490
SL 120050
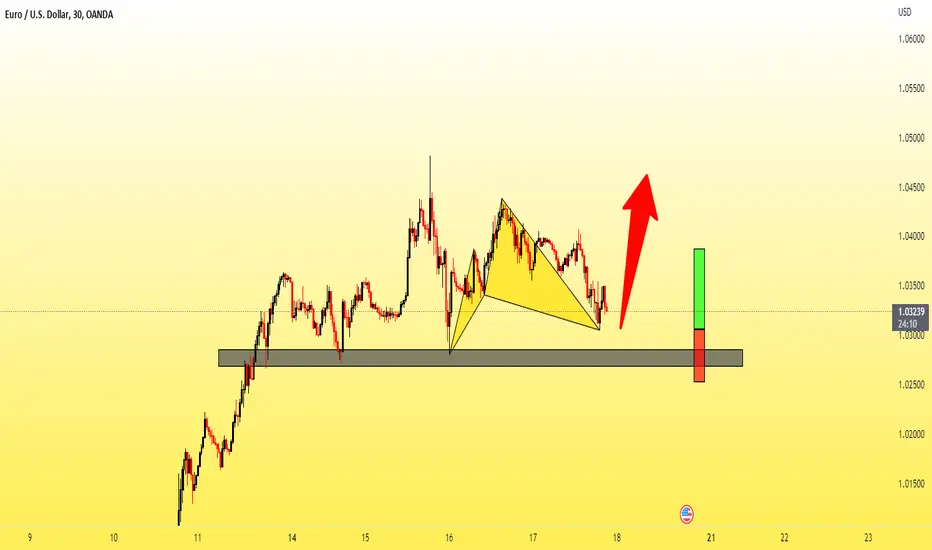
EURUSDHi traders, EURUSD watch price action with your own according strategy and look for a short term long position opportunity GOOD LUCK.
CYPHER Harmonic Pattern - Made Easy For Everyone !The Cypher harmonic pattern is a technical analysis indicator used by traders to identify valuable support and resistance levels based on the Fibonacci sequence of numbers and detect trend reversals.
Here, in this article, we explain how the Cypher harmonic pattern works, identify it, and trade it.
What is the Cypher Harmonic Candlestick Pattern?
The Cypher harmonic pattern is a technical analysis formation indicating a price-action reversal.
The pattern was discovered by D. Oglesbee and is known as a relatively advanced pattern formation. In structure, the Cypher pattern is similar to the butterfly harmonic pattern; however, the Cypher is not a very common chart pattern due to its unique Fibonacci ratios.
The Cypher pattern, which can be either bullish or bearish, has five points (X, A, B, C, and D) and four legs (XA, AB, BC, and CD). Like any other harmonic pattern, the theory behind the Cypher chart pattern is that there is a strong correlation between Fibonacci ratios and price movements.
Eventually, the market is expected to reverse from point D after the four market swing wave movements
How to Identify and Use the Cypher Harmonic Pattern in Forex Trading?
Much like any other harmonic chart pattern, several conditions must occur so you can identify the Cypher pattern:
B point retracement of the primary XA leg ranges between 38.2% to 61.8% Fibonacci levels
C point is an extension leg with a Fibonacci ratio that should be between 127.2% to 141.4% of the primary XA leg
D point should break the 78.6 retracement level of XC
Let’s see what the Cypher harmonic pattern looks like on a trading chart.
Cypher Pattern – Set a Stop Loss
A reasonable stop-loss level when trading the Cypher pattern is simple and does not necessarily require the combination of Fibonacci retracement.
All you need to do is to place the stop loss somewhere below the D level because if this level breaks, the entire Cypher pattern is invalidated. So, the stop would be placed at the next support or resistance level, which is the X-point
Cypher Pattern – Set a Take Profit Target
The simple Cypher pattern trading method is using its points as profit targets, meaning the A and C levels.
How accurate is the Cypher harmonic chart pattern?
The Cypher harmonic pattern has been historically proven to be a fairly reliable and accurate chart pattern. According to various studies, the pattern has an accuracy rate of around 70%.

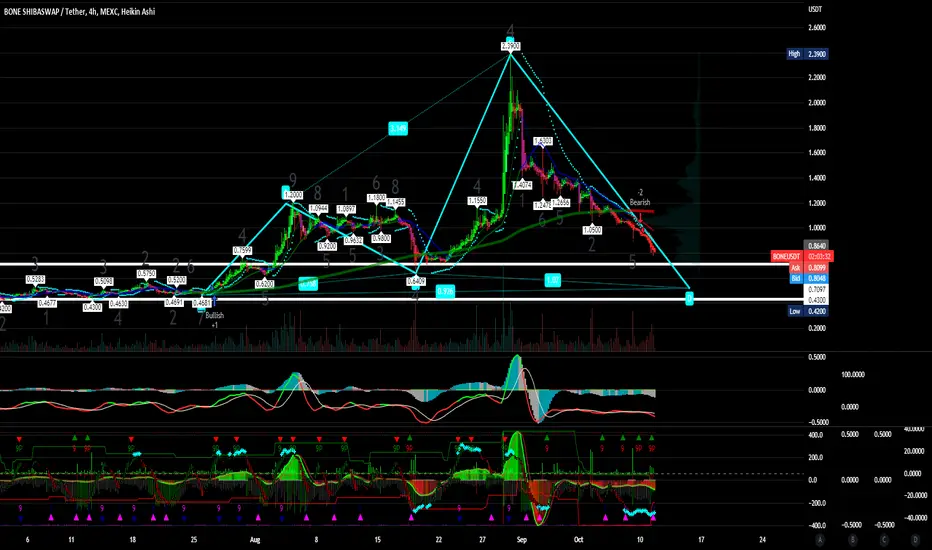
$BONEUSDT Bone ShibaSwap entry PTs .43-.47 Target PTs 2,000What is BONE?
BONE is a governance token of Shibaswap ecosystem which will allow the #ShibArmy to vote on upcoming proposals. The more BONE the user holds, the more weight of their vote carries in these future endeavors. BONE has 250,000,000 tokens, and is designed to fit perfectly between the previous two tokens in regards to circulation supply.
What makes BONE Unique?
From its inception, Shiba Inu has done things differently. Starting with a supply of 1 quadrillion, our founder, Ryoshi, locked 50% in Uniswap, then “burned” the other half to Ethereum co-founder Vitalik Buterin for safekeeping. To help reverse the devastating spread of Covid-19 in India, VB has since utilized SHIB in the largest crypto donation in history, and then actually burned 40% of its total supply to a dead wallet, ensuring our long-term success and stability. In the words of Ryoshi, “Thank you to the woofmeister for enabling true decentralization. Now we truly begin.”
SHIB, LEASH, and BONE, come together to create ShibaSwap, the next evolution in DeFi platforms. ShibaSwap gives users the ability to DIG (provide liquidity), BURY (stake), and SWAP tokens to gain WOOF Returns through our sophisticated and innovative passive income reward system. Our platform also allows the ShibArmy to access upcoming NFTs and additional tools, such as portfolio trackers, to make navigating the crypto world simple and intuitive.
BALRAMPUR CHINI - Cypher PatternBalrampur Chini, daily chart had cypher pattern formation and we did see a bounce from its prz zone.
Now sustaining 370 levels, we could see it moving towards 390- 410 levels in the coming sessions.

Bearish Cyphery Pattern - Elliott Wave Analysis Bearish Cypher Pattern , in Elliott Wave Analysis is
Irregular Flat Correction or Running Flat Correction
Rules
The B point stands at the end of the AB leg, which is a retracement of the XA leg. The B point must lie between a 0.382 and 0.618 retracement of the XA leg;
The C point lies at the end of the BC leg and should be a 1.272 to 1.414 projection of the XA leg;
Point D should be a precise 0.786 retracement of the line between X and C (XC). The D point is the end of the pattern.

Bullish Cypher Pattern - Elliott Wave Analysis Bullish Cypher Pattern , in Elliott Wave Analysis is
Irregular Flat Correction or Running Flat Correction
Rules
The B point stands at the end of the AB leg, which is a retracement of the XA leg. The B point must lie between a 0.382 and 0.618 retracement of the XA leg;
The C point lies at the end of the BC leg and should be a 1.272 to 1.414 projection of the XA leg;
Point D should be a precise 0.786 retracement of the line between X and C (XC). The D point is the end of the pattern.

$GLG Next Target PTs .50-.75 Long term PT 2.25 and higherTD Holdings, Inc. engages in commodities trading and supply chain service businesses in China. Its commodity trading business engages in purchasing non-ferrous metal products, such as aluminium ingots, copper, silver, and gold, from upstream metal and mineral suppliers and then selling to downstream customers. The company's supply chain service business covers a range of commodities, including non-ferrous metals, ferrous metals, coal, metallurgical raw materials, soybean oils, oils, rubber, wood, and various other types of commodities. It serves as a one-stop commodity supply chain service and digital intelligence supply chain platform integrating upstream and downstream enterprises, warehouses, logistics, information, and futures trading. TD Holdings, Inc. has a strategic agreement with Guangzhou Wensheng Blockchain Technology Co. Ltd. to apply blockchain technology in the supply chain financing and development of cloud-based warehouse. The company was formerly known as Bat Group, Inc. and changed its name to TD Holdings, Inc. in March 2020. TD Holdings, Inc. was incorporated in 2011 and is based in Beijing, the People's Republic of China.

ADAUSDT Long || Cardano Cypher Harmonic PatternAfter I publish ADABTC trade (still valid) for long with same pattern I saw ADAUSDT making same pattern here (already is formed but I publish this from low to ATH).
Cardano already reach possible support but I think we can see more down. Keep eyes on confluence 0.786 fib with Cypher harmonic pattern and possible tap to bottom of large wedge.

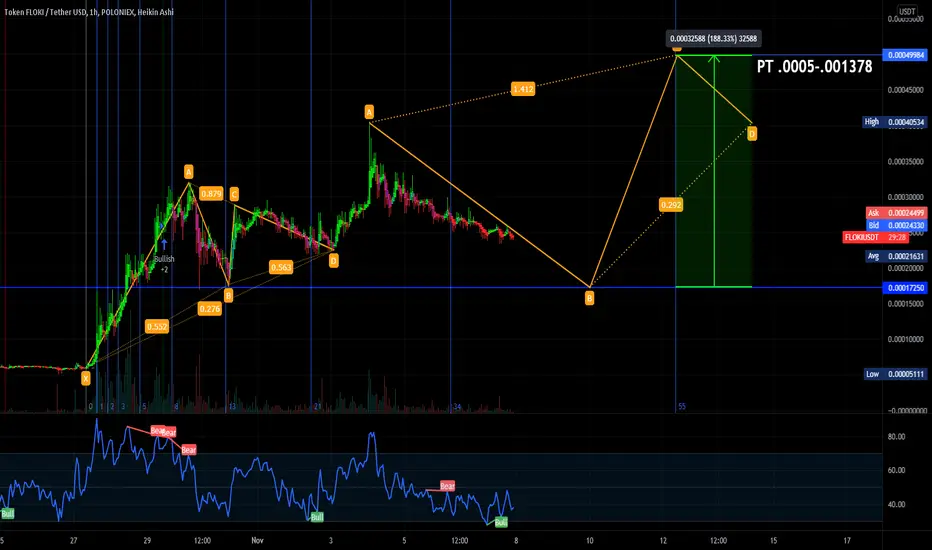
$FLOKIUSDT Cypher PatternFloki Inu Coin Price & Market Data
Floki Inu price today is $0.00023525 with a 24-hour trading volume of $34,127,064. FLOKI price is down -8.9% in the last 24 hours. It has a circulating supply of 0 FLOKI coins and a total supply of 10 Trillion. If you are looking to buy or sell Floki Inu, PancakeSwap (v2) is currently the most active exchange.
Floki is the name Elon Musk wishes to give to his future pet Shiba. Floki Inu has a token burn of 1% each transaction, transaction fees of 5%, and a transaction redistribution to holders of 5%.
SUNTVIt has activated a Bullish Harmonic Cypher which is suggesting a pullback till 500-520 as long as it does not breach 470

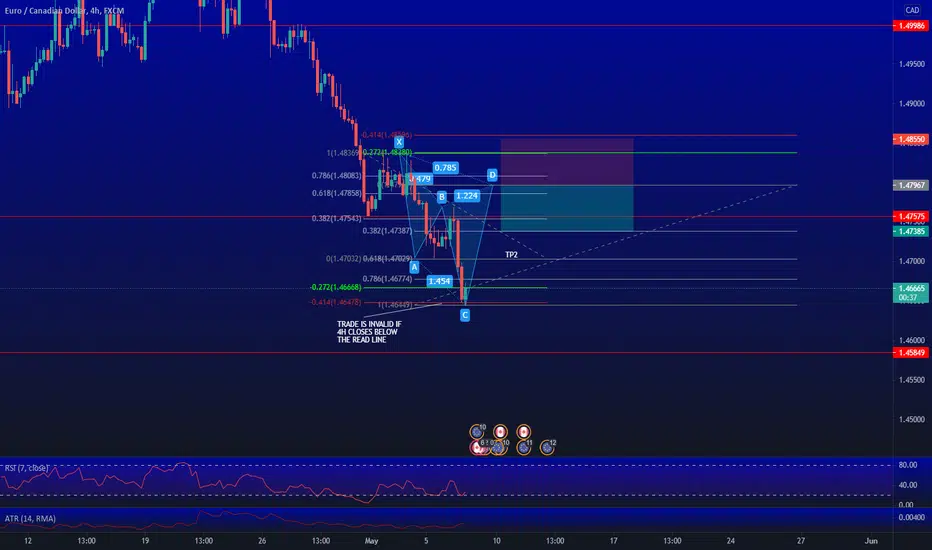
POTENTIAL BEARISH CYPHER ON EURCADWAITING FOR TRADE TO TRIGGER AT THE %78.6 LEVEL OF THE X to C LEG. TP1 = %38.2 OF C to D TP2= %78.6 OF C to D (TARGETS WILL MOVE HIGHER IF D PUSHES ABOVE ENTRY STOPLOSS= 1.13% OF A to X STOPLOSS MOVES TO BREAKEVEN ONCE TP1 IS HIT AND HALF THE POSITION IS REMOVED