TRX: HUGE 40+ PERCENT GAINS WITH A 7.25 RISK REWARDDisclaimer : Anything that I say is my own opinion. I have been doing my own personal research and believe that TRX is an excellent investment. After following it for a few weeks I made a small investment. Any money that you invest is your responsibility. Do some research and learn about the currency yourself before putting your hard earned money into it. This is not a "pump and dump" , it is just a friendly investor sharing his insights.
As you may know, I charted TRX a few days ago and we saw incredible surges in price. At one point I was up around 150% my money! With all highs there are lows and I soon saw TRX slowly come crashing down. After watching the charts, and holding, I now see a potential for TRX to explode again.
Let's get started!
Firstly, I wish you could see the 1 minute chart that I have created. Tradingview won't allow me to publish the 1 minute chart, but if you could, I would try to change it so you can understand my predictions.
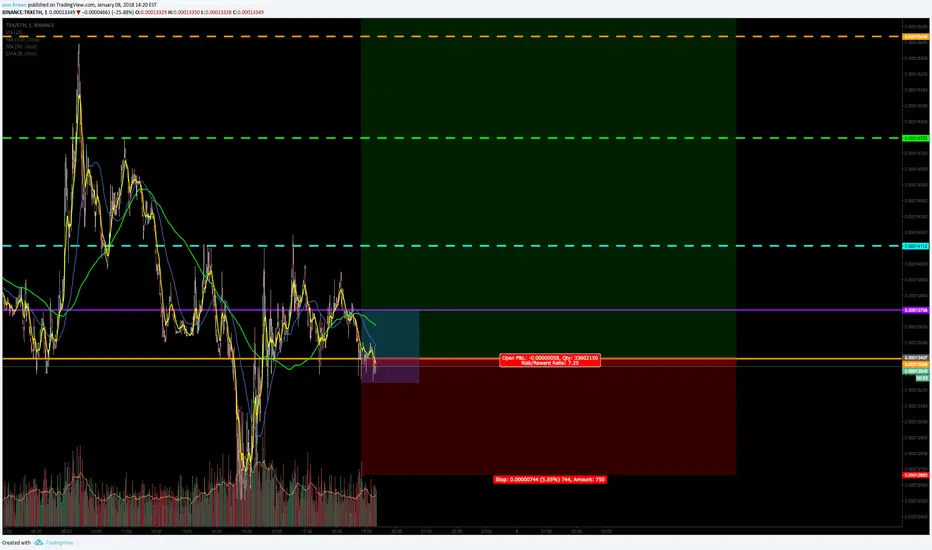
To start off, I put an orange line to indicate the support line . For the past day I have been seeing TRX fall back on this number giving me the prediction that it is a good time to buy more stock .
The resistance line that TRX must break through to see a surge is around 0.00013704 (Purple line)
Like always, I put a blue rectangle to indicate where you should buy . This range is between the support and resistance lines. This would be around 0.00013703 and 0.00013248
I will be putting milestones in the chart, but you do not have to follow them.
1st milestone : 0.00014112
I would not advise to sell anything at this milestone. If you are skeptical about trading and want to ensure you come out of this trade then take a small percentage out.
2nd milestone : 0.00014795
I believe, even if you want to hold for longer, you should sell a small portion here (10 percent) Ensure you have some profit from this trade.
3rd milestone : 0.00015436
This is a huge milestone. If TRX hits this milestone we can easily see it surge to the fourth.
4th milestone : 0.00018843
In the next few days I believe that TRX as the capability to easily surge to this milestone. That would ensure a 40% return with a 7.25 risk reward.
Thanks for looking at my charts. If you have any questions or pointers regarding TRX or trading in general let me know. Happy trading!
Cyrpto
REQ: NEXT PAYPAL SHOWING GREAT UPWARD TREND AND HUGE POTENTIAL!Disclaimer : Anything that I say is my own opinion. I have been doing my own personal research and believe that REQ is an excellent investment. After following it for a few weeks I made an investment. Any money that you invest is your responsibility. Do some research and learn about the currency yourself before putting your hard earned money into it. This is not a "pump and dump", it is just a friendly investor sharing his insights.
I have been following REQUEST NETWORK for a while now and I believe it is one of the few cryptos that actually has a very strong foundation regarding technology. If you didn't know, the Request Network is trying to essentially be the next Paypal service. It is very interesting and if you want to invest in it I would look it up and do your own research.
Let's get started!
REQ reached it's all time high on New Years Day and has been showing upward trends today. (Yellow Line)
Firstly, I put an orange line to indicate the support line (0.00075250). When REQ corrected after New Years Day it fell back to this line (January 5th) and has done the same today.
The purple line indicates the line in which REQ must break through. After doing so, I expect a sharp explosion.
If you can zoom out of the chart and look at my previous charting of this chart (Around December 29) you can see that REQ actually showed a very similar trend and then it exploded.
So let's get started!
Buy in (Blue Box) :
0.00088318-0.00081981
1st Milestone : (0.00093341)
Take some profits (10%) to ensure you get something out of the trade. REQ has been very jumpy and, as we can see from the past few days, has many highs and lows. Treat yourself.
2nd Milestone : (0.00100468)
I expect to see this one reached shortly after hitting the 1st milestone. REQ seems to shoot up very quick and have a short correction. Keep that in mind when looking into this trade.
3rd Milestone (0.00107445)
This milestone seems like a resistance line for REQ. In that case I would put a sell order in at this line so just in case it does hit this milestone you can still get the sell.
4th Milestone (0.00117648)
This milestone will take a few days. Put a sell order, just like the 3rd milestone, because it may only be there for a few minutes.
If you have any questions or input I would love to hear it. I am learning about the crypto-universe just like you. Thanks for reading and happy trading!

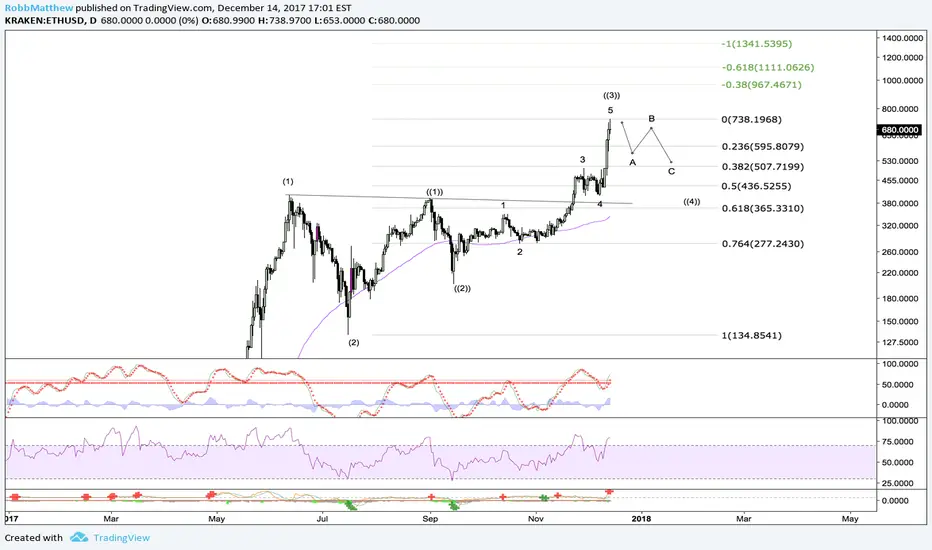
ETHUSD Looking for a 3 wave pullbackLooks like another wave 4 correction is possible here, but plenty more on the upside after a correction. $500 or so is my target to the 38 retrace.
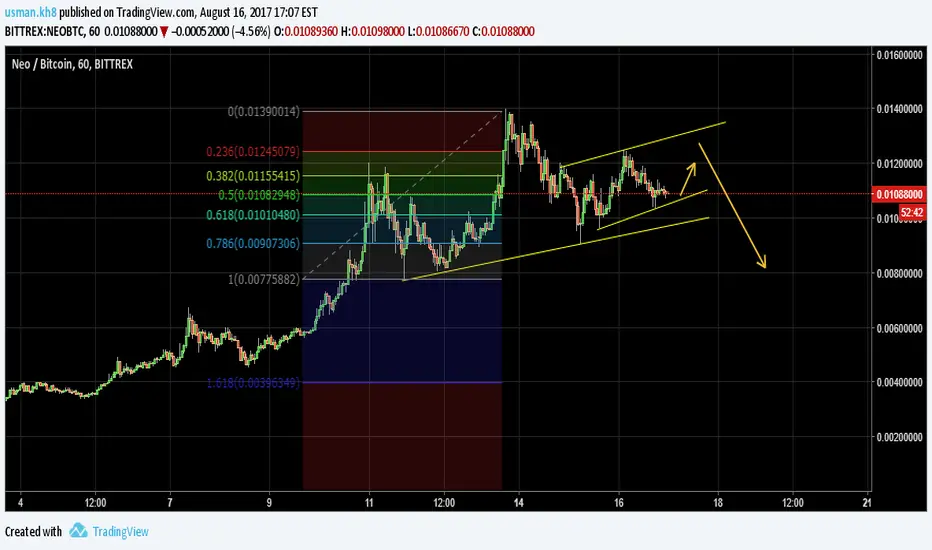
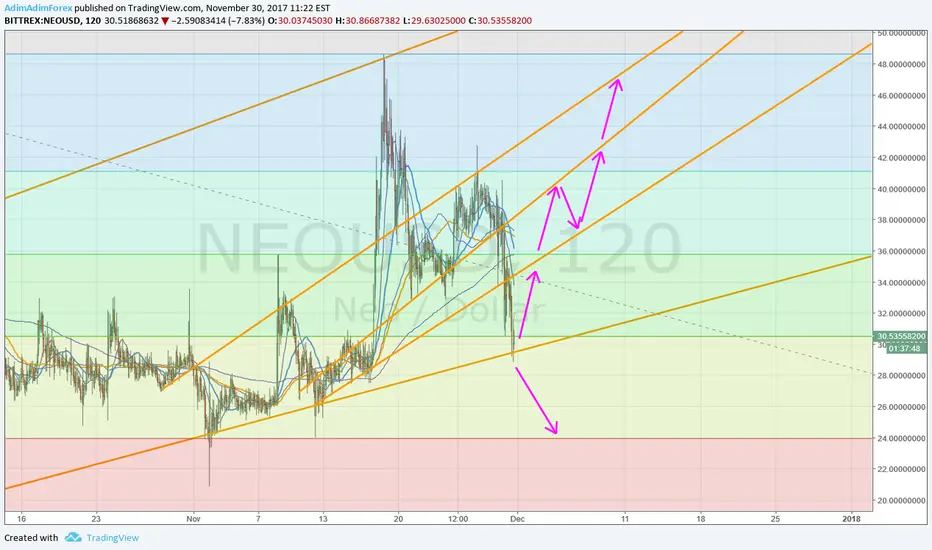
NEO Long TradingThere are some active resistance and support lines occured for #NEO coin. We are at the bottom support line. Here is really important. If it turns back from this line we can see impressive rally. If it cross below this line, it goes down for next level. Hope have a good one!
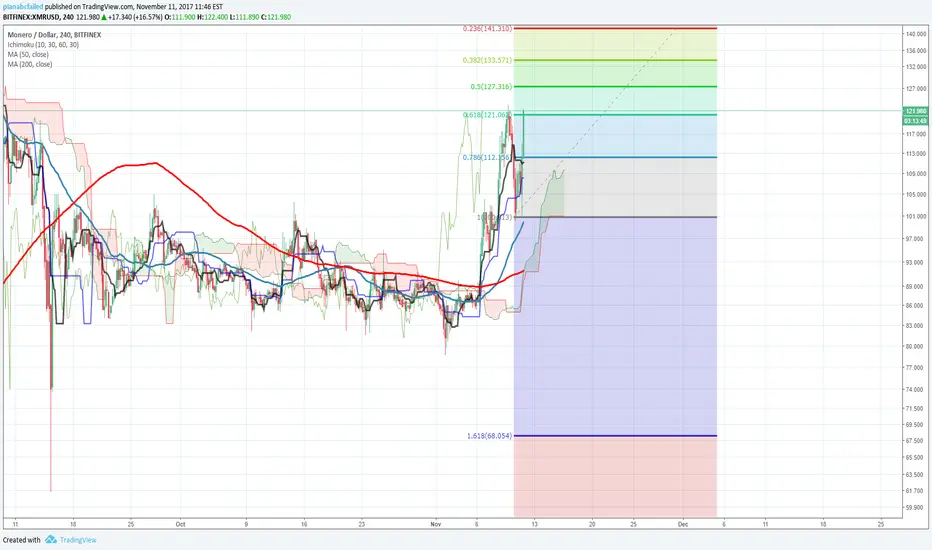
XMRUSD on its way to 145$50 ma is very strong. buy now get plusminus 20% if youre daytrader or hodl for 240$
First target reachedWe have reached the first target.
Maybe some extention down to reach the green bar, only if to recover back to these levels can be ok.
If these levels do not hold. We have to replan everything
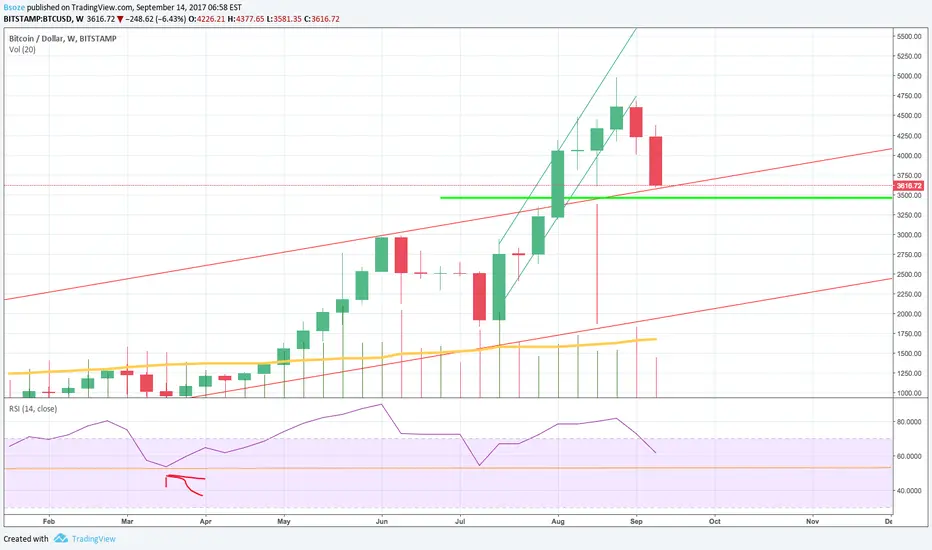
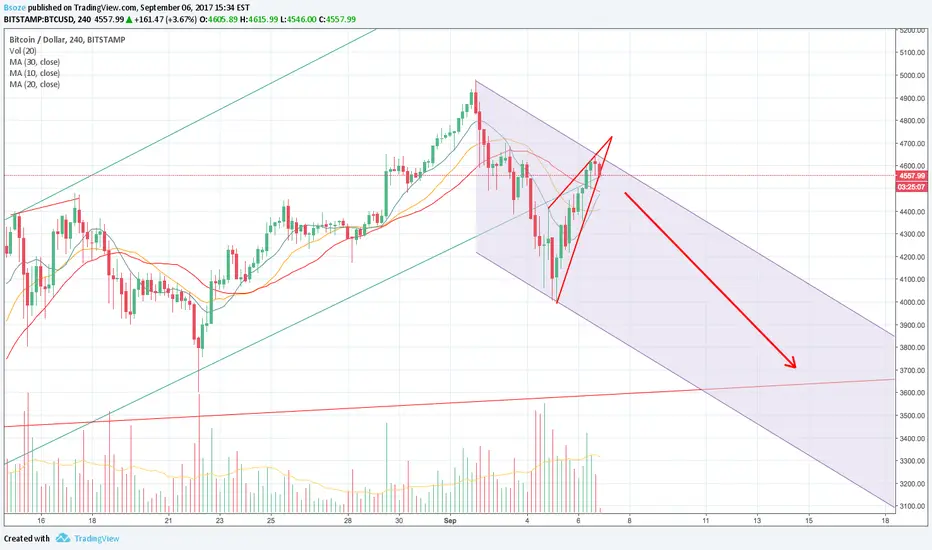
ok, Bitcoin Weekly , phases of Bubbles and some thoughtsTurns out that we have 2-3 weeks to stand still while BTC smoothly goes down and touches to the weekly channel support around 3.600-3.700
So, I took a look at the Bitcoin history, as we have time right?
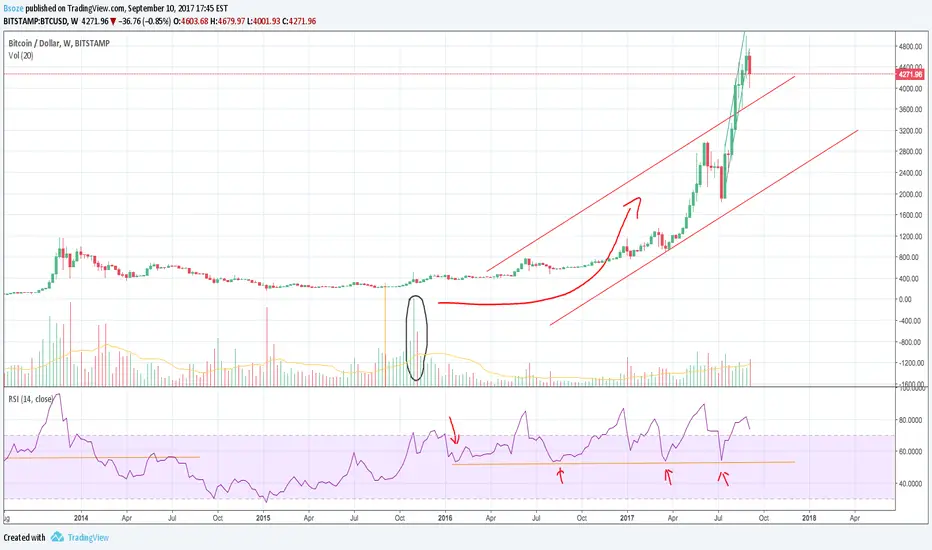
It seems, the excitement about bitcoin, has changed gear for the last 2 years. And if specifically talking, RSI , since the end of 2015 has been touching to 50 range and jumping back up and never dropping below 50.That is a sign of a more dynamic and aggressive market
But, previously it was not the case.
So, I decided to examine and tried to understand of this change's process, in our bubble's phase I to phase II.
(Don't get me wrong, this is a new born bubble, no way it is close to bust!!)
Tracking back in time the the date 2 November 2015 seems to be the date, where we have up geared to phase II. That seems to me so! But any objection is accepted.
There is huge green volume , not affecting the prices on weekly basis, but after that date, the momentum is increasing and slope of the price action starts to increase. For some time, second derivative for the price action is zero while after some time, second derivative starts to increase too.
Checking back to the mentioned date, it seems there 3 issues , that people are talking about that can effect bitcoin; I am not exactly sure what was the trigger but they are;
- Financial troubles in Greece
- Some kind of a Russian Financial Social Networking fraud event
- EU courts deciding that VAT tax is not applicable on bitcoin ( this is my take )
There might be some of you, who were actually in the market at that times, I would appreciate any other possibility as well.It would be nice to identify a critical point of history of bitcoin bubble.
Anyway, other that, it seems, we will have to wait at least 2-3 weeks more , while BTC price slides down and RSI by the way touches 50 again.
I am expecting Head and shoulders pattern to form to be completed while BTC price dropping to 3.600-3.700 area.
Probably , when we reach the bottom, the difference between Chineese exchange BTC prices and other BTC exchange price difference will not be there anymore. That will be a another clue , probably.
Thats all folks. Tell me what you think
Wish I had left some Game of Thrones not watched , don't know how to spend the time now
A bit more hardtime?I hate to think or say but. I am not liking the follow up reaction's volume or depth coming from 3900-4000. Not saying doomsday BUT there might a probability that , the wedge we are forming now, might break out downside and form a "Head and shoulder"'s patterns' right shoulder. And we might go down to 3550-3600 to find a bottom at the bottom of weekly charts trend channel bottom.
Just to keep in mind