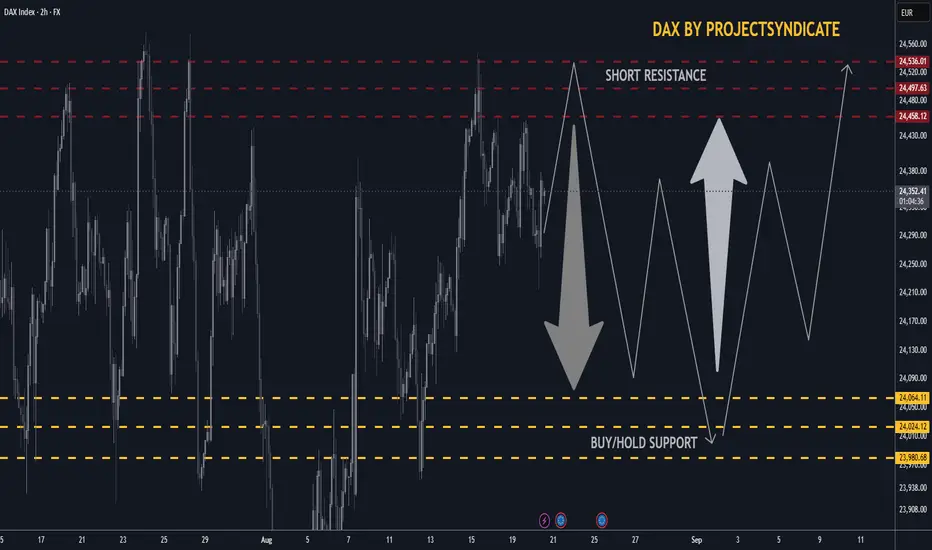
DAX/GER30 SHORT/LONG sequence Swing Trade +500/+500 points 🔸Hello traders, let’s review the 2hour chart for GER30/DAX. Strong recovery from recent lows, however price testing key resistance and support zones where major reactions are expected.
🔸Speculative setup defined by resistance at 24,500 and key S/R demand zone at 24,000. Both zones have recently been validated with +500 point reactions.
🔸Currently both resistance and support levels are respected and price action remains technical around these areas.
🔸Recommended strategy for DAX traders:
Short Sell at Market from resistance 24,500
SL above resistance, TP 24,200 / 24,100 / 24,000.
Buy & Hold Long from key S/R 24,000
SL below support, TP 24,300 / 24,400 / 24,500.
🎁Please hit the like button and
🎁Leave a comment to support our team!
RISK DISCLAIMER:
Trading Futures, Forex, CFDs and Stocks involves a risk of loss.
Please consider carefully if such trading is appropriate for you.
Past performance is not indicative of future results.
Always limit your leverage and use tight stop loss.
D-DAX
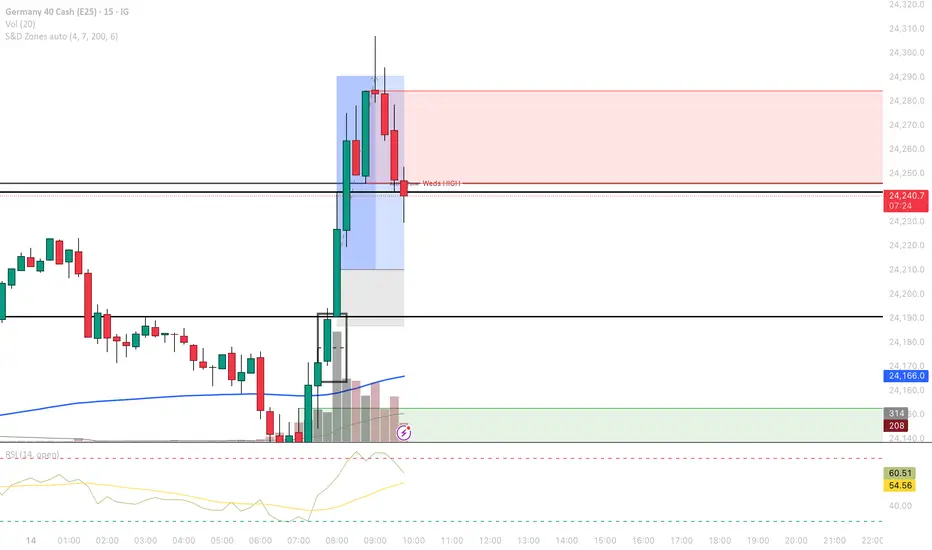
DAX: Strong Growth Ahead! Long!
My dear friends,
Today we will analyse DAX together☺️
The recent price action suggests a shift in mid-term momentum. A break above the current local range around 24,246.92 will confirm the new direction upwards with the target being the next key level of 24,297.37 and a reconvened placement of a stop-loss beyond the range.
❤️Sending you lots of Love and Hugs❤️
Technical Analysis for GER40 (DAX) Closing Price: 23,372.80 (15th Aug 2025, 11:50 PM UTC+4)
Analysis Methods: Japanese Candlesticks, Harmonic Patterns (ABCD, M/W), Elliott Wave, Wyckoff, Gann Theory (Time/Square of 9/Angles), Ichimoku, RSI, Bollinger Bands, VWAP, Moving Averages (MA/EMA/SMA/WMA).
---------------------------------------------------------------------------------------------
1. Long-Term Trend (Weekly/Monthly)
Elliott Wave:
GER40 is likely in Wave 3 of a broader bull cycle (Wave 1 peak: 22,800, Wave 2 dip to 21,500).
Wave 3 Target: 24,000–24,500 (1.618 extension of Wave 1).
Gann Price Forecasting:
Square of 9: √23,372.80 ≈ 152.90 →
Resistance: 153² = 23,409 (immediate), 154² = 23,716 (swing target).
Support: 152² = 23,104 (daily pivot), 151² = 22,801 (Wyckoff accumulation zone).
Ichimoku (Monthly):
Tenkan/Kijun: Bullish (Tenkan: 22,900 > Kijun: 22,400).
Cloud: Price above thick Senkou Span (22,000–22,500) – structural bullishness.
Moving Averages:
Weekly SMA(100): 22,200 (major support).
Swing Outlook: Bullish. Wave 3 rally targets 24,000–24,500.
2. Medium-Term Swing (4H/Daily)
Harmonic Patterns:
Bearish ABCD on Daily:
A: 23,800 → B: 23,100 → C: 23,550 → D: 23,380–23,420 (1.272 BC extension).
Bullish Crab (W Pattern) forming near 23,100 (0.886 XA retracement).
Wyckoff Phase:
Testing at 23,400:
Upthrust rejection at 23,450 (15th Aug) on low volume.
Spring potential near 23,100 (accumulation signal).
Gann Theory:
Time Window: Aug 18–20 (Square of 9 date cluster) for breakout/reversal.
Price-Time Squaring: 23,372 aligns with Aug 15 – consolidation expected.
Gann Angle: 1x1 angle at 23,300 – close below accelerates selling.
Indicators:
RSI(14) + Bollinger Bands (Daily):
RSI: 64 (neutral, no divergence).
Price testing upper BB(20,2) at 23,450 – expansion hints at volatility.
VWAP (Weekly): 23,250 (swing support).
Swing Trade Setup:
Short near 23,400 (ABCD target) → Target 23,100. Stop-loss: 23,500.
Long near 23,100 (Crab + Gann 151² support) → Target 23,800. Stop-loss: 22,950.
3. Intraday Outlook (5M–4H)
Key Levels:
Resistance: 23,400 (Gann 1x1), 23,450 (weekly high).
Support: 23,300 (VWAP), 23,200 (Ichimoku cloud), 23,100 (psychological).
Indicators:
Ichimoku (1H):
Tenkan: 23,360, Kijun: 23,330 → Price above both (short-term bullish).
Cloud: Bullish (23,280–23,320) – strong support zone.
RSI + Bollinger Bands (4H):
RSI(14): 58 (neutral).
Price near mid-BB(20,2): 23,350 – break below signals bearish momentum.
VWAP + MAs:
VWAP: 23,340 (intraday pivot).
EMA(50): 23,310 (dynamic support).
Candlestick Patterns:
4H Shooting Star at 23,450 (15th Aug) → Bearish reversal confirmed.
1H Bearish Engulfing below 23,380 – adds downside pressure.
Gann Intraday Squaring:
Time Cycle: 8:00–10:00 AM CET (European open) for volatility.
Price Harmony: Close below 23,350 targets 23,300 → 23,250.
Intraday Trade Plan:
Sell below 23,350 → Target 23,300 (VWAP) → 23,250 (Ichimoku cloud).
Buy above 23,400 only with RSI <60 → Target 23,450.
Stop-Loss: 25–30 points risk.
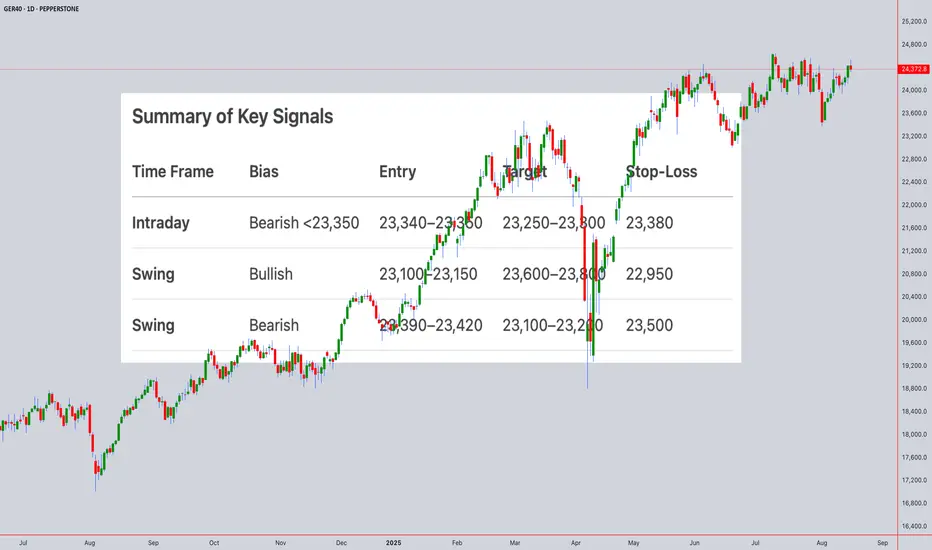
Summary of Key Signals
Time Frame Bias Entry Target Stop-Loss
Intraday Bearish <23,350 23,340–23,350 23,250–23,300 23,380
Swing Bullish 23,100–23,150 23,600–23,800 22,950
Swing Bearish 23,390–23,420 23,100–23,200 23,500
Critical Events Ahead:
Gann Reversal Window: Aug 18–20 (watch for Eurozone CPI/GDP data).
Daily Close >23,450 invalidates bearish ABCD and targets 23,716.
Risk Note: GER40 is sensitive to EU political/energy risks. Use tight stops during news events.
Disclaimer: Technical analysis is probabilistic and based on historical patterns. Fundamental drivers (e.g., ECB policy, German industrial data) may override technical signals. Always use risk management.
For those interested in further developing their trading skills based on these types of analyses, consider exploring the mentoring program offered by Shunya dot Trade . (world wide web shunya dot trade)
I welcome your feedback on this analysis, as it will inform and enhance my future work.
Regards,
Shunya.Trade
world wide web shunya dot trade
⚠️ Disclaimer: This post is educational content and does not constitute investment advice, financial advice, or trading recommendations. The views expressed here are based on technical analysis and are shared solely for informational purposes. The stock market is subject to risks, including capital loss, and readers should exercise due diligence before investing. We do not take responsibility for decisions made based on this content. Consult a certified financial advisor for personalized guidance.
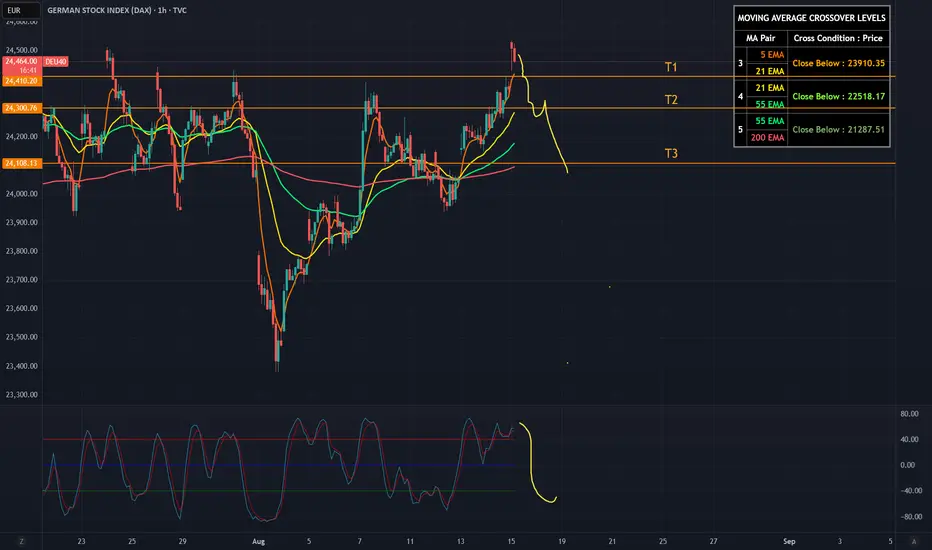
German / DEU40 / GER 40 - Heading SouthThe DAX (GER40) is hovering just around 24500 – not far from recent highs – but momentum is fading and Friday’s typical “profit-taking weakness” is already setting in.
From a technical perspective, the index is stuck near VWAP with flat RSI and decreasing volume. Price has failed to convincingly break higher this week and is starting to roll over. Buyers look tired, and Friday is not usually their strongest day.
Fundamentally, things aren’t looking too solid either:
- European data continues to underwhelm.
- Global risk sentiment is shaky as everyone waits for potential fallout from the Trump–Putin meeting today.
- Inflation ghosts are creeping back in, and central banks remain as noncommittal as ever.
Conclusion for me:
I’m leaning short into into the day. If we start slipping below 24,400 with volume, I expect some acceleration.
T1: 24,410
T2: 24,300
T3: 24,100
The one unpredictable variable? Again - The world's leaders. Their random decisions can obliterate any setup in seconds. Markets follow structure... until a politician wakes up and chooses violence. Today is a special day with the upcoming Meeting - Be careful. On the other hand, - one negative news regarding this upcoming event can nuke all the high expectations that are already priced in, which, in my opinion, strenghtens this trade!
No trading advice – just how I see it.
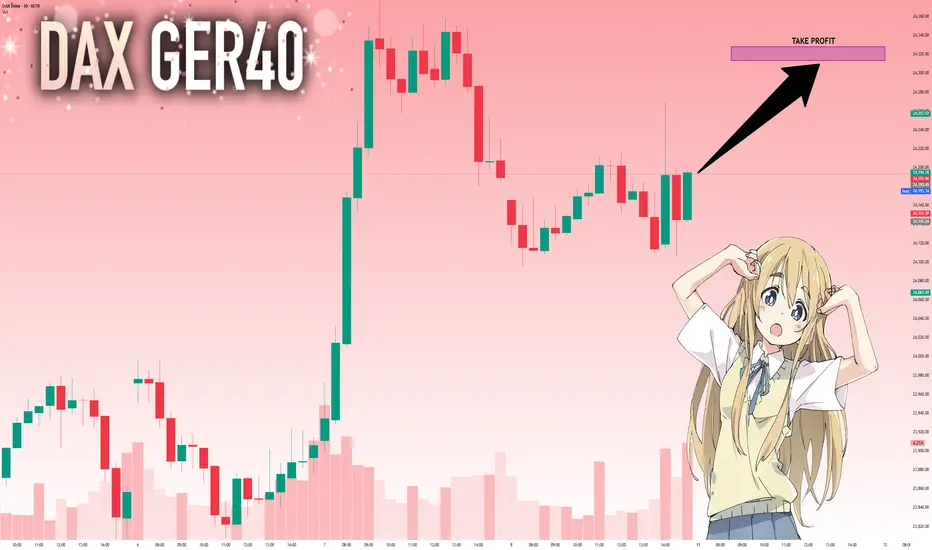
DAX ORBAnother beautiful dax ORB moment. Dax continues to impress with its amazing ORB movement and rarely fails, allowing good rr and high win rate. Easiest strategy EVER!
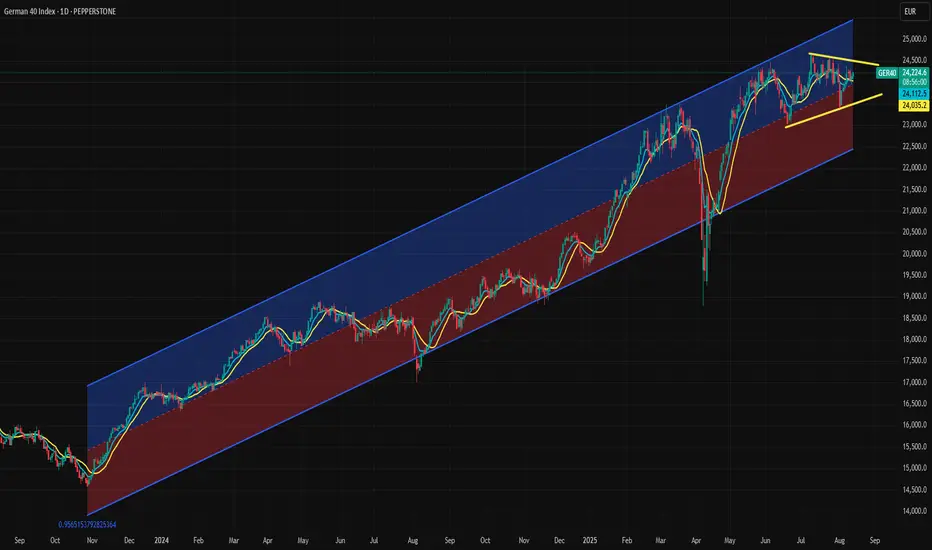
Both Technical and Valuation Signals Points Incoming VolatilityThe DAX has been moving sideways since May, with this flat movement evolving into a triangle formation since June. Price action is contracting, and the index appears to be waiting for a catalyst to determine its next direction.
The DAX is currently near the regression line from the November dip, which keeps both upward and downward possibilities open, consistent with the neutral signal from the triangle pattern.
From a valuation perspective, the DAX’s forward P/E ratio stands at 16.95x, roughly one standard deviation above its 2009-to-date regression line, making it relatively expensive compared to its own history. The S&P 500 trades at a much higher forward P/E of 24.25x, but that figure is near its own long-term regression line. Since early June, the DAX/S&P 500 ratio has fallen by nearly 10%, significantly reducing the DAX’s relative overvaluation and potentially giving it room for another leg higher.
Ultimately, the triangle formation may be the deciding factor. The current upper boundary is at 24,500, and the lower boundary is at 23,490. A break of either could bring volatility back to the DAX, with momentum likely to follow the breakout direction. An upward break could target the 24,400–24,500 zone.
DAX: Will Go Up! Long!
My dear friends,
Today we will analyse DAX together☺️
The recent price action suggests a shift in mid-term momentum. A break above the current local range around 24,048.10 will confirm the new direction upwards with the target being the next key level of 24,154.31 and a reconvened placement of a stop-loss beyond the range.
❤️Sending you lots of Love and Hugs❤️
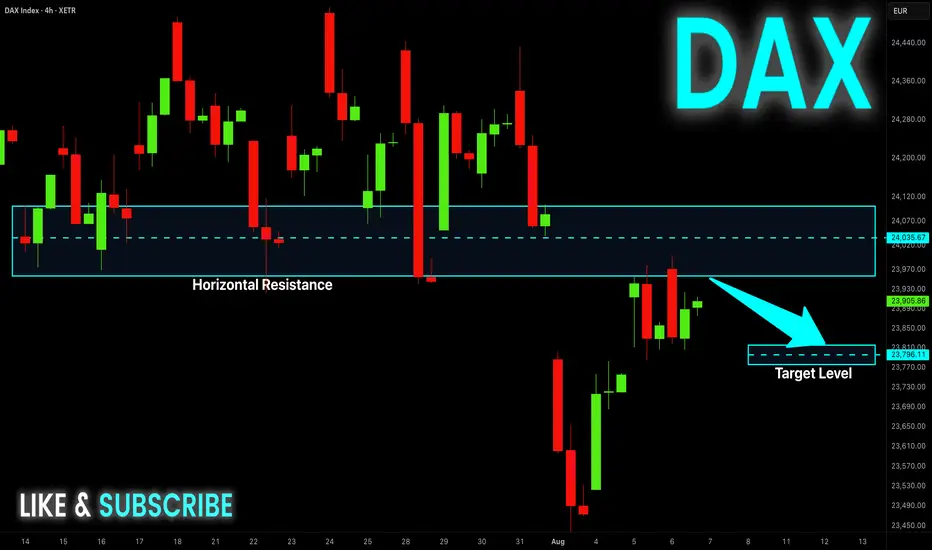
GER40As mentioned before, dax is going to go down, then recover. So far on the 4H chart we can see it has already started its move down.
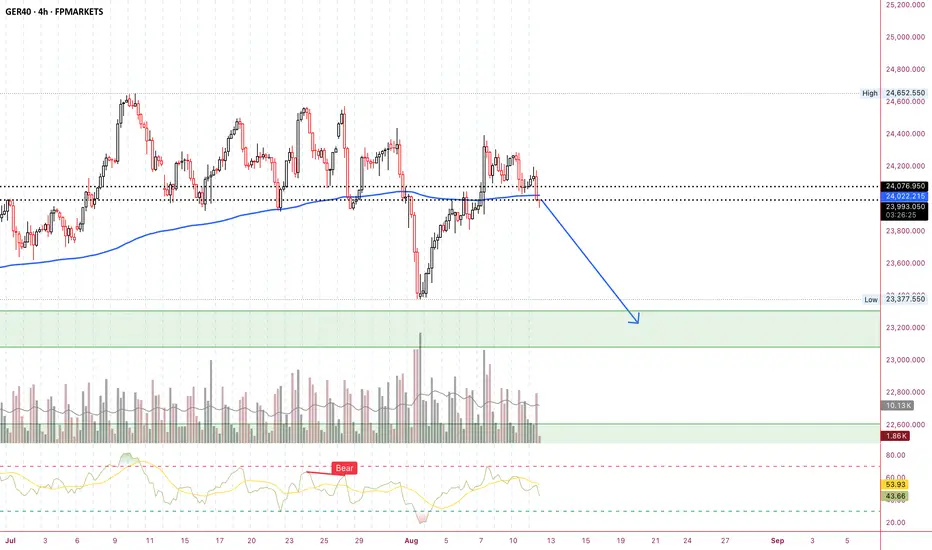
DAX testing supportCould the DAX bounce back here after starting the day lower?
At the time of writing, the German benchmark index was testing key short-term support between 23,928 to 24,041. This area was previously resistance while the 21-day exponential average also comes into play here.
if we see a bounce here then a new all-time high could be on the cards. Else, a potential break down could target the old support and resistance range around 23,500.
By Fawad Razaqzada, market analyst with FOREX.com
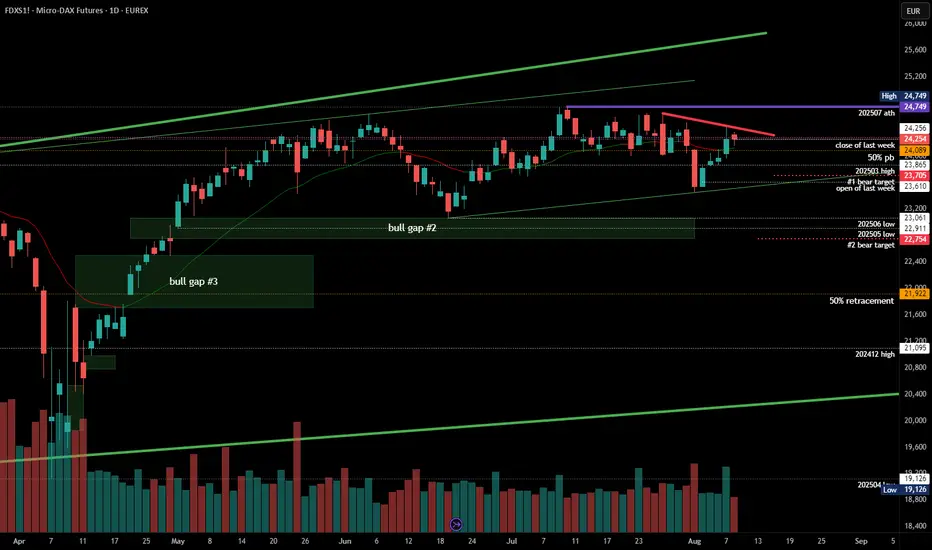
#202532 - priceactiontds - weekly update - fdaxGood Evening and I hope you are well.
comment: Multiple ways to draw triangles on this daily chart and I will continue to bet on a contracting range. So for me shorts above 24200 are mighty fine with stop 24750. Mid-point of the most obvious triangle is 24090 which is my line in the sand for both sides. If any side can turn it support/resistance, it will likely be the signal for breakout. 24090 is never 100% accurate, prices always have to be viewed as areas/zones and not exact points.
current market cycle: trading range
key levels for next week: 23500 - 24750
bull case: Bulls want to run the stops above 24510 where the sell-off end of July began, which they already stuffed. Every daily bar lasted week hat a big tail above and yet we still moved higher each day except Friday. It’s 50/50 if we go above 24510 or not. Even if bulls get above it, no long above 24250 has been profitable for more than 1-2 days, so the upside will likely be very limited.
Invalidation is below 23000
bear case: Bears messed up again last week but they can still make an important statement by not letting the market get above 24500 again. Due to the strong reversal this week, we can not expect the market to print new lows next week. Bears are favored here since it’s the upper third of the range.
Invalidation is above 24750
short term: Bearish for at least 24000 again but could go to 23700. Stop has to be 24751 as of now.
medium-long term from 2025-08-10: Another stuffed attempt. Kills me. I still think the highs are in but it’s more like a 50/50 bet right now.
DAX: Next Move Is Up! Long!
My dear friends,
Today we will analyse DAX together☺️
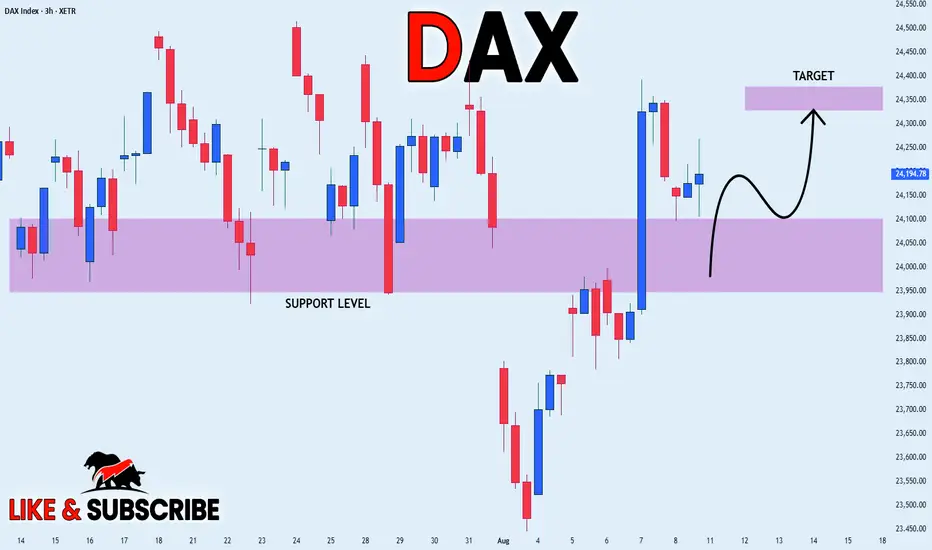
The in-trend continuation seems likely as the current long-term trend appears to be strong, and price is holding above a key level of 24,194.78 So a bullish continuation seems plausible, targeting the next high. We should enter on confirmation, and place a stop-loss beyond the recent swing level.
❤️Sending you lots of Love and Hugs❤️
DAX WILL GO UP|LONG|
✅DAX is going up now
And the index made a
Breakout of the key horizontal
Level of 24,100 which is
Now a support then
Made a retest and a is now
Making a rebound already so
We are bullish biased and we
Will be expecting a further
Bullish move up
LONG🚀
✅Like and subscribe to never miss a new idea!✅
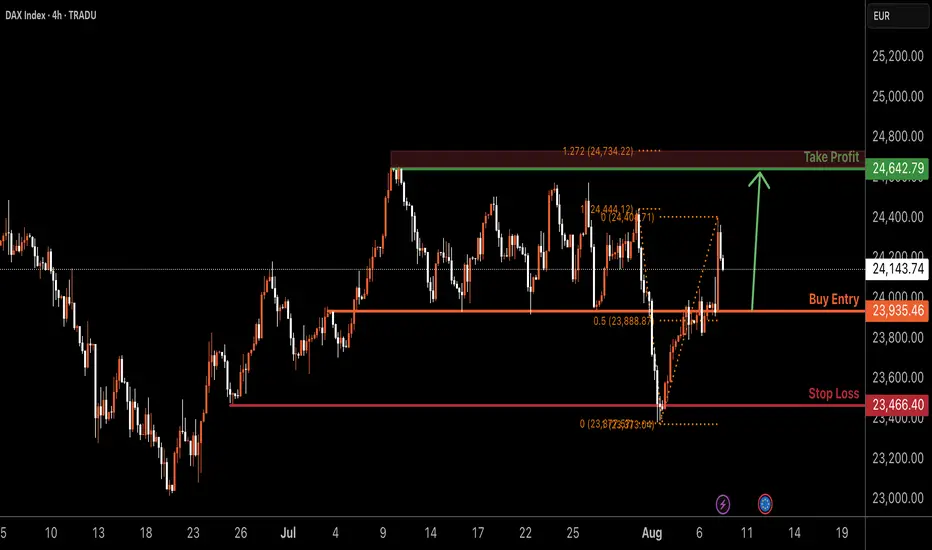
GER30 H4 | Bullish bounce off overlap supportGER30 is falling towards the buy entry at 23,935.46, which is an overlap support that lines up with the 50% Fibonacci retracement and could bounce from this level to the upside.
Stop loss is at 23,466.40, which is a multi-swing low support.
Take profit is at 24,642.79, which is a swing high resistance that is slightly below the 127.2% Fibonacci extension.
High Risk Investment Warning
Trading Forex/CFDs on margin carries a high level of risk and may not be suitable for all investors. Leverage can work against you.
Stratos Markets Limited (tradu.com ):
CFDs are complex instruments and come with a high risk of losing money rapidly due to leverage. 65% of retail investor accounts lose money when trading CFDs with this provider. You should consider whether you understand how CFDs work and whether you can afford to take the high risk of losing your money.
Stratos Europe Ltd (tradu.com ):
CFDs are complex instruments and come with a high risk of losing money rapidly due to leverage. 66% of retail investor accounts lose money when trading CFDs with this provider. You should consider whether you understand how CFDs work and whether you can afford to take the high risk of losing your money.
Stratos Global LLC (tradu.com ):
Losses can exceed deposits.
Please be advised that the information presented on TradingView is provided to Tradu (‘Company’, ‘we’) by a third-party provider (‘TFA Global Pte Ltd’). Please be reminded that you are solely responsible for the trading decisions on your account. There is a very high degree of risk involved in trading. Any information and/or content is intended entirely for research, educational and informational purposes only and does not constitute investment or consultation advice or investment strategy. The information is not tailored to the investment needs of any specific person and therefore does not involve a consideration of any of the investment objectives, financial situation or needs of any viewer that may receive it. Kindly also note that past performance is not a reliable indicator of future results. Actual results may differ materially from those anticipated in forward-looking or past performance statements. We assume no liability as to the accuracy or completeness of any of the information and/or content provided herein and the Company cannot be held responsible for any omission, mistake nor for any loss or damage including without limitation to any loss of profit which may arise from reliance on any information supplied by TFA Global Pte Ltd.
The speaker(s) is neither an employee, agent nor representative of Tradu and is therefore acting independently. The opinions given are their own, constitute general market commentary, and do not constitute the opinion or advice of Tradu or any form of personal or investment advice. Tradu neither endorses nor guarantees offerings of third-party speakers, nor is Tradu responsible for the content, veracity or opinions of third-party speakers, presenters or participants.
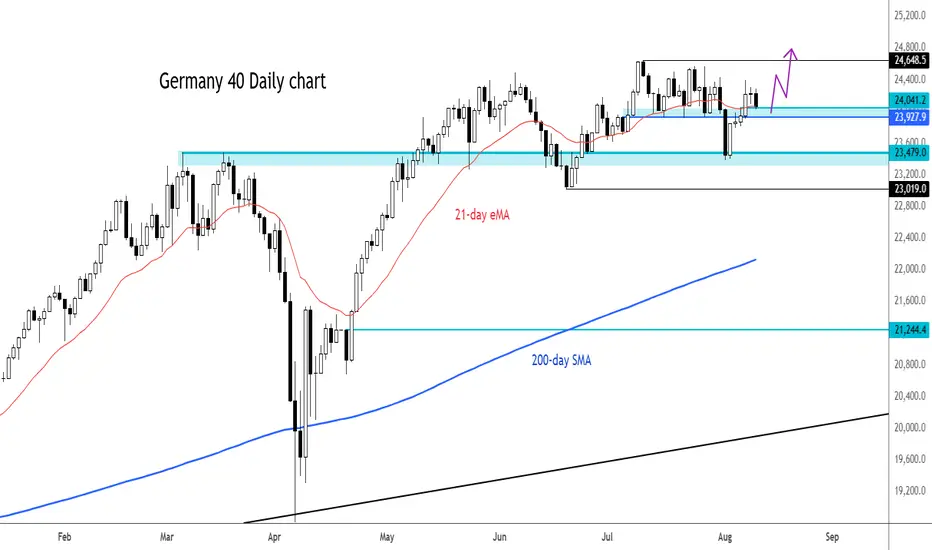
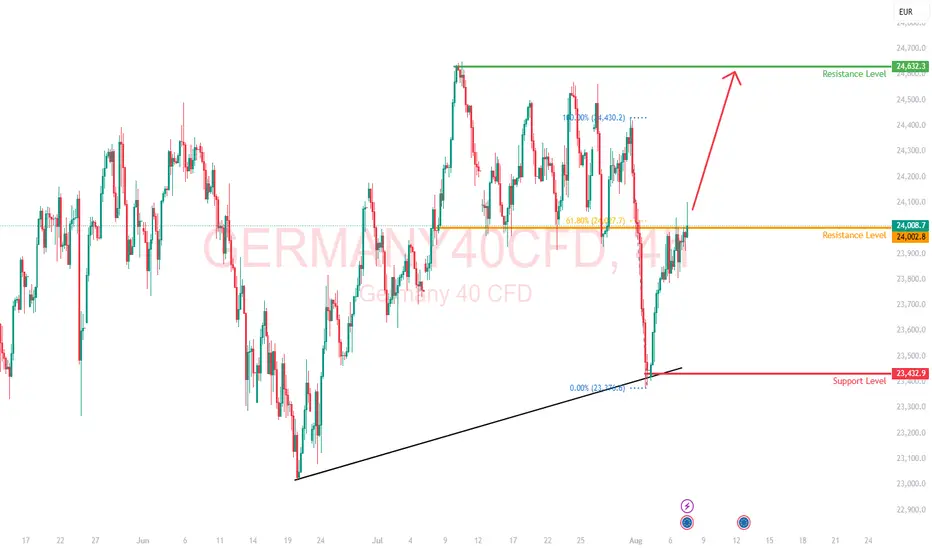
DAX Resilience To Shine ThroughThe DAX Index continues to hold strength just beneath all-time highs, popping higher above 24,000 after three consecutive sessions of gains.
Bulls are keeping control through strong earnings in tech and auto sectors, combined with supportive macro tailwinds. However, the major resistance and previous ATH remain to be tested.
U.S. Interest Rate Path in Focus
The Federal Reserve held rates steady at its July meeting but left the door open for a possible cut in September, should inflation and labor market data soften.
Markets are pricing in an increasing probability of a cut, which is fueling optimism across global equities.
A dovish Fed supports global risk sentiment and weakens the USD, indirectly benefiting European exporters.
ECB Holds, But Dovish Undertone Grows
The European Central Bank left rates unchanged in its latest decision, but ECB President Christine Lagarde acknowledged that “disinflation is progressing” and that further tightening is unlikely.
Forward guidance was interpreted as dovish, with the market now expecting a cut by December, possibly sooner if economic activity remains sluggish.
A dovish ECB lowers borrowing costs and improves equity risk premiums, especially for cyclical-heavy indices like the DAX.
EU–U.S. Trade Tensions
Recent rhetoric from U.S. officials, including renewed tariff threats on European pharmaceutical and automotive exports, has reignited trade tensions.
The EU has signaled its willingness to respond proportionally, but negotiations are ongoing.
While no measures have been enacted yet, uncertainty over trade policy is capping some upside momentum in European equities.
German automakers and industrial exporters are vulnerable to tariffs. Continued trade uncertainty may limit gains unless diplomacy resolves key friction points.
The DAX remains resilient, buoyed by improving fundamentals, strong earnings, and global rate expectations.
The index is coiled just under a key psychological resistance at 24,000, with bulls eyeing a breakout toward the all-time high near 24,639.
Momentum remains favorable, but traders should watch macro headlines and volume closely around resistance zones.
DAX Potential Short! Sell!
Hello,Traders!
DAX went up nicely
But is now about to hit
A horizontal resistance
Around 24,000 so after
The retest we will be
Expecting a local pullback
Sell!
Comment and subscribe to help us grow!
Check out other forecasts below too!
Disclosure: I am part of Trade Nation's Influencer program and receive a monthly fee for using their TradingView charts in my analysis.
DAX: Bulls Are Winning! Long!
My dear friends,
Today we will analyse DAX together☺️
The market is at an inflection zone and price has now reached an area around 23,755.89 where previous reversals or breakouts have occurred.And a price reaction that we are seeing on multiple timeframes here could signal the next move up so we can enter on confirmation, and target the next key level of 23,976.72.Stop-loss is recommended beyond the inflection zone.
❤️Sending you lots of Love and Hugs❤️

DAX WILL GROW|LONG|
✅DAX is trading in an
Uptrend and the index made
A bullish rebound from the
Horizontal support of 23,400
Which reinforces our bullish
Bias and we will be expecting
A further bullish move up
LONG🚀
✅Like and subscribe to never miss a new idea!✅

DAX Futures Rebound Amid Shifting US Economic SentimentThe DAX futures are showing a more optimistic tone today, shifting from concerns over weak US labor market data—which initially signaled economic trouble—to a more hopeful outlook that this might prompt the Federal Reserve to consider cutting interest rates, a move that investors see as positive. This shift in sentiment has provided some reassurance as the new week begins.
Following a brief decline on Friday, the market experienced a rebound today, supported by a weekly demand zone. We’re now watching for a retest of key levels within this zone, which could serve as a potential entry point for long positions, aiming for a continuation of the upward momentum driven by the weekly support area.
✅ Please share your thoughts about GER30 in the comments section below and HIT LIKE if you appreciate my analysis. Don't forget to FOLLOW ME; you will help us a lot with this small contribution.

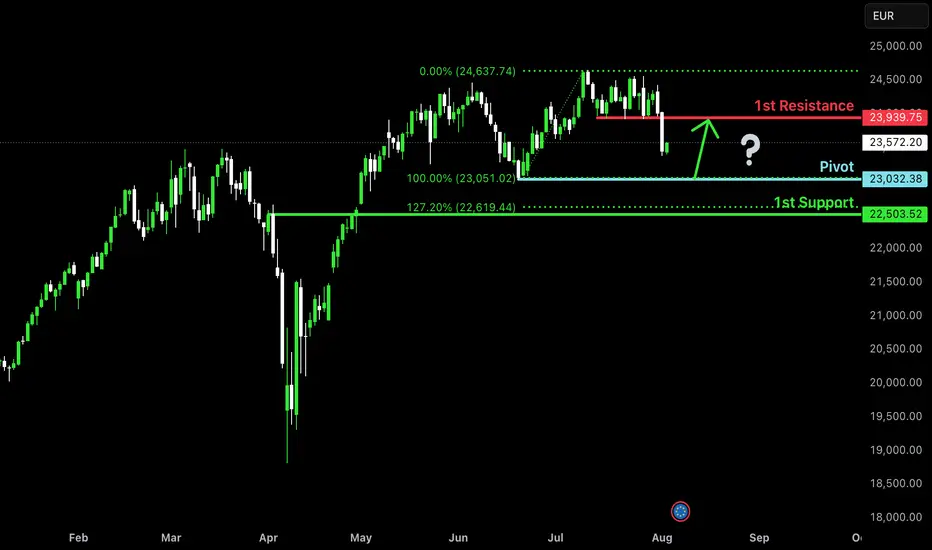
Potential bullish bounce?DAX40 (DE40) is falling towards the pivot, which has been identified as a swing low support and could bounce to the 1st resistance, which is a pullback resistance.
Pivot: 23,032.38
1st Support: 22,503.52
1st Resistance: 23,939.75
Risk Warning:
Trading Forex and CFDs carries a high level of risk to your capital and you should only trade with money you can afford to lose. Trading Forex and CFDs may not be suitable for all investors, so please ensure that you fully understand the risks involved and seek independent advice if necessary.
Disclaimer:
The above opinions given constitute general market commentary, and do not constitute the opinion or advice of IC Markets or any form of personal or investment advice.
Any opinions, news, research, analyses, prices, other information, or links to third-party sites contained on this website are provided on an "as-is" basis, are intended only to be informative, is not an advice nor a recommendation, nor research, or a record of our trading prices, or an offer of, or solicitation for a transaction in any financial instrument and thus should not be treated as such. The information provided does not involve any specific investment objectives, financial situation and needs of any specific person who may receive it. Please be aware, that past performance is not a reliable indicator of future performance and/or results. Past Performance or Forward-looking scenarios based upon the reasonable beliefs of the third-party provider are not a guarantee of future performance. Actual results may differ materially from those anticipated in forward-looking or past performance statements. IC Markets makes no representation or warranty and assumes no liability as to the accuracy or completeness of the information provided, nor any loss arising from any investment based on a recommendation, forecast or any information supplied by any third-party.
#DAXDate: 01-08-2025
#DAX Current Price: 23680
Pivot Point: 24193.295 Support: 23822.409 Resistance:24566.692
Upside Targets:
🎯 Target 1: 24882.344
🎯 Target 2: 25197.995
🎯 Target 3: 25574.758
🎯 Target 4: 25951.520
Downside Targets:
🎯 Target 1: 23505.502
🎯 Target 2: 23188.595
🎯 Target 3: 22811.833
🎯 Target 4: 22435.070
#TradingView #Nifty #BankNifty #DJI #NDQ #SENSEX #DAX #USOIL #GOLD #SILVER
#BHEL #HUDCO #LT #LTF #ABB #DIXON #SIEMENS #BALKRISIND #MRF #DIVISLAB
#MARUTI #HAL #SHREECEM #JSWSTEEL #MPHASIS #NATIONALUM #BALRAMCHIN #TRIVENI
#USDINR #EURUSD #USDJPY
#SOLANA #ETHEREUM #BTCUSD #MATICUSDT #XRPUSDT
#Crypto #Bitcoin #BTC #CryptoTA #TradingView #PivotPoints #SupportResistance

DAX: Next Move Is Up! Long!
My dear friends,
Today we will analyse DAX together☺️
The in-trend continuation seems likely as the current long-term trend appears to be strong, and price is holding above a key level of 23,502.95 So a bullish continuation seems plausible, targeting the next high. We should enter on confirmation, and place a stop-loss beyond the recent swing level.
❤️Sending you lots of Love and Hugs❤️
DAX: Local Bearish Bias! Short!
My dear friends,
Today we will analyse DAX together☺️
The in-trend continuation seems likely as the current long-term trend appears to be strong, and price is holding below a key level of 24,252.78 So a bearish continuation seems plausible, targeting the next low. We should enter on confirmation, and place a stop-loss beyond the recent swing level.
❤️Sending you lots of Love and Hugs❤️

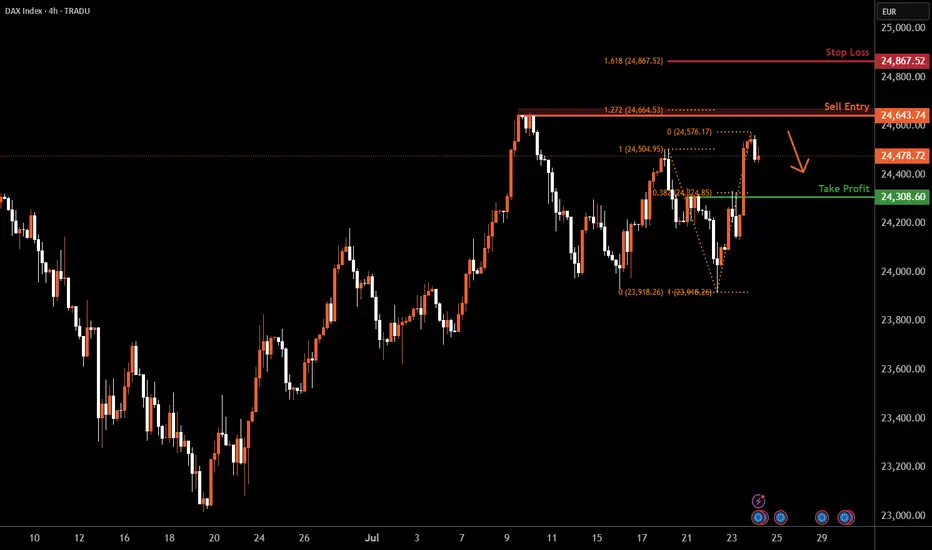
DAX H4 | Heading into a swing-high resistanceThe DAX (GER30) is rising towards a swing-high resistance and could potentially reverse off this level to drop lower.
Sell entry is at 24,643.74 which is a swing-high resistance that aligns with the 127.2% Fibonacci extension.
Stop loss is at 24,867.52 which is a level that aligns with the 161.8% Fibonacci extension.
Take profit is at 24,308.60 which is a pullbacl support that aligns with the 38.2% Fibonacci retracement.
High Risk Investment Warning
Trading Forex/CFDs on margin carries a high level of risk and may not be suitable for all investors. Leverage can work against you.
Stratos Markets Limited (tradu.com ):
CFDs are complex instruments and come with a high risk of losing money rapidly due to leverage. 66% of retail investor accounts lose money when trading CFDs with this provider. You should consider whether you understand how CFDs work and whether you can afford to take the high risk of losing your money.
Stratos Europe Ltd (tradu.com ):
CFDs are complex instruments and come with a high risk of losing money rapidly due to leverage. 66% of retail investor accounts lose money when trading CFDs with this provider. You should consider whether you understand how CFDs work and whether you can afford to take the high risk of losing your money.
Stratos Global LLC (tradu.com ):
Losses can exceed deposits.
Please be advised that the information presented on TradingView is provided to Tradu (‘Company’, ‘we’) by a third-party provider (‘TFA Global Pte Ltd’). Please be reminded that you are solely responsible for the trading decisions on your account. There is a very high degree of risk involved in trading. Any information and/or content is intended entirely for research, educational and informational purposes only and does not constitute investment or consultation advice or investment strategy. The information is not tailored to the investment needs of any specific person and therefore does not involve a consideration of any of the investment objectives, financial situation or needs of any viewer that may receive it. Kindly also note that past performance is not a reliable indicator of future results. Actual results may differ materially from those anticipated in forward-looking or past performance statements. We assume no liability as to the accuracy or completeness of any of the information and/or content provided herein and the Company cannot be held responsible for any omission, mistake nor for any loss or damage including without limitation to any loss of profit which may arise from reliance on any information supplied by TFA Global Pte Ltd.
The speaker(s) is neither an employee, agent nor representative of Tradu and is therefore acting independently. The opinions given are their own, constitute general market commentary, and do not constitute the opinion or advice of Tradu or any form of personal or investment advice. Tradu neither endorses nor guarantees offerings of third-party speakers, nor is Tradu responsible for the content, veracity or opinions of third-party speakers, presenters or participants.