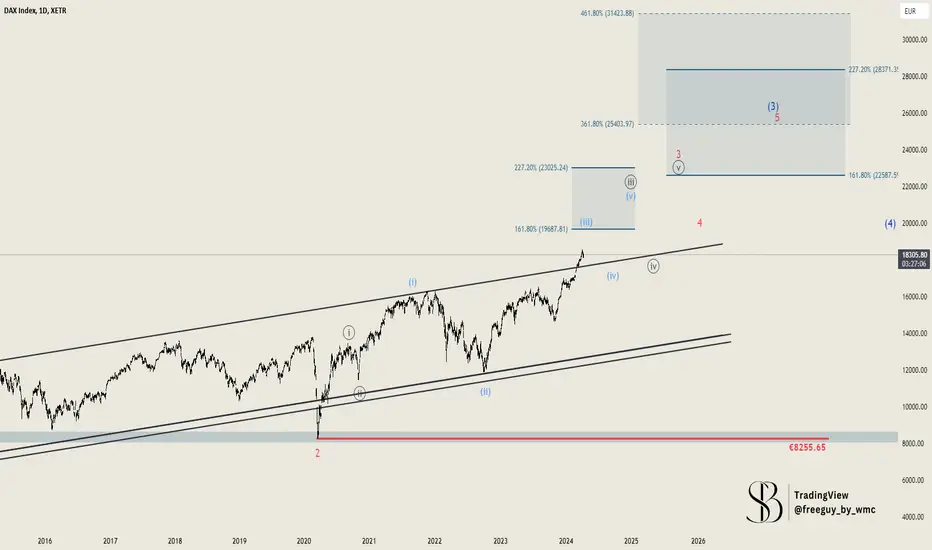
DAX: 22,000 € Target in Sight!Since our short scenario for the DAX was invalidated, we had to reanalyze and concluded that we are dealing with a very long and extremely bullish scenario, as it's the only other option we have left for the DAX. We assume that, on the weekly chart, we will reach a minimum level of 22,000€. This scenario is supported by a trend channel that we have now broken and exited upwards. Therefore, we expect to reach levels between 19,700 and 23,000 for Wave 3, which will only serve as a catalyst for even higher movements. As seen, we anticipate the overarching Wave (3) to reach levels between 25,400 and 31,400. There's still a lot of potential and room for upward movement, and given our invalidation, we will now be looking for long entries. As always mentioned, the economy increasingly reflects less of what happens in the markets, diverging more from economic activities, making it somewhat perplexing when considering Germany as a whole and the remarkable performance of the DAX.
D-DAX
DAX to form a lower high?DE30EUR - 24h expiry
Short term bias has turned negative.
The bearish engulfing candle on the 4 hour chart is negative for sentiment.
Daily signals for sentiment are at overbought extremes.
Previous support at 18250 now becomes resistance.
The trend of higher intraday lows has also been broken.
20 4hour EMA is at 18254.
We look to Sell at 18350 (stop at 18450)
Our profit targets will be 18100 and 18010
Resistance: 18200 / 18250 / 18320
Support: 18120 / 18050 / 18000
Risk Disclaimer
The trade ideas beyond this page are for informational purposes only and do not constitute investment advice or a solicitation to trade. This information is provided by Signal Centre, a third-party unaffiliated with OANDA, and is intended for general circulation only. OANDA does not guarantee the accuracy of this information and assumes no responsibilities for the information provided by the third party. The information does not take into account the specific investment objectives, financial situation, or particular needs of any particular person. You should take into account your specific investment objectives, financial situation, and particular needs before making a commitment to trade, including seeking advice from an independent financial adviser regarding the suitability of the investment, under a separate engagement, as you deem fit.
You accept that you assume all risks in independently viewing the contents and selecting a chosen strategy.
Where the research is distributed in Singapore to a person who is not an Accredited Investor, Expert Investor or an Institutional Investor, Oanda Asia Pacific Pte Ltd (“OAP“) accepts legal responsibility for the contents of the report to such persons only to the extent required by law. Singapore customers should contact OAP at 6579 8289 for matters arising from, or in connection with, the information/research distributed.

Real yield in uptrendThe weekly real yield is in uptrend, which should act as support for the USDOLLAR and as a headwind for the risk markets.
This video is intended for the users of Stratos Markets Limited, Stratos Trading Pty. Limited and Stratos Global LLC, (collectively “FXCM Group”).
Stratos Markets Limited (www.fxcm.com):
CFDs are complex instruments and come with a high risk of losing money rapidly due to leverage. 66% of retail investor accounts lose money when trading CFDs with this provider. You should consider whether you understand how CFDs work and whether you can afford to take the high risk of losing your money.
Stratos Europe Ltd (trading as “FXCM” or “FXCM EU”), previously FXCM EU Ltd (www.fxcm.com):
CFDs are complex instruments and come with a high risk of losing money rapidly due to leverage. 70% of retail investor accounts lose money when trading CFDs with this provider. You should consider whether you understand how CFDs work and whether you can afford to take the high risk of losing your money.
Stratos Trading Pty. Limited (www.fxcm.com):
Trading FX/CFDs carries significant risks. FXCM AU (AFSL 309763). Please read the Financial Services Guide, Product Disclosure Statement, Target Market Determination and Terms of Business at www.fxcm.com
Stratos Global LLC (www.fxcm.com):
Losses can exceed deposits.
Any opinions, news, research, analyses, prices, other information, or links to third-party sites contained on this video are provided on an "as-is" basis, as general market commentary and do not constitute investment advice. The market commentary has not been prepared in accordance with legal requirements designed to promote the independence of investment research, and it is therefore not subject to any prohibition on dealing ahead of dissemination. Although this commentary is not produced by an independent source, FXCM takes all sufficient steps to eliminate or prevent any conflicts of interests arising out of the production and dissemination of this communication. The employees of FXCM commit to acting in the clients' best interests and represent their views without misleading, deceiving, or otherwise impairing the clients' ability to make informed investment decisions. For more information about the FXCM's internal organizational and administrative arrangements for the prevention of conflicts, please refer to the Firms' Managing Conflicts Policy. Please ensure that you read and understand our Full Disclaimer and Liability provision concerning the foregoing Information, which can be accessed via FXCM`s website:
Stratos Markets Limited clients please see: www.fxcm.com
Stratos Europe Ltd clients please see: www.fxcm.com
Stratos Trading Pty. Limited clients please see: www.fxcm.com
Stratos Global LLC clients please see: www.fxcm.com
Past Performance is not an indicator of future results.

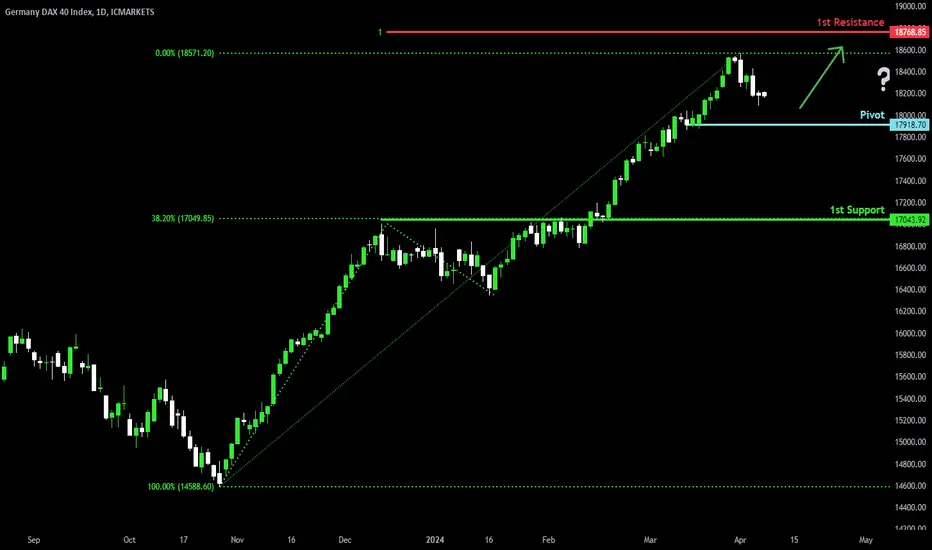
Approaching pullback supportDAX (DE40) is falling towards the pivot which has been identified as a pullback support. Could it potentially bounce off this pivot and rise toward the 1st resistance?
Pivot: 17,918.70
Support: 17,043.92
Resistance: 18,768.85
Risk Warning:
Trading Forex and CFDs carries a high level of risk to your capital and you should only trade with money you can afford to lose. Trading Forex and CFDs may not be suitable for all investors, so please ensure that you fully understand the risks involved and seek independent advice if necessary.
Disclaimer:
The above opinions given constitute general market commentary, and do not constitute the opinion or advice of IC Markets or any form of personal or investment advice.
Any opinions, news, research, analyses, prices, other information, or links to third-party sites contained on this website are provided on an "as-is" basis, are intended only to be informative, is not an advice nor a recommendation, nor research, or a record of our trading prices, or an offer of, or solicitation for a transaction in any financial instrument and thus should not be treated as such. The information provided does not involve any specific investment objectives, financial situation and needs of any specific person who may receive it. Please be aware, that past performance is not a reliable indicator of future performance and/or results. Past Performance or Forward-looking scenarios based upon the reasonable beliefs of the third-party provider are not a guarantee of future performance. Actual results may differ materially from those anticipated in forward-looking or past performance statements. IC Markets makes no representation or warranty and assumes no liability as to the accuracy or completeness of the information provided, nor any loss arising from any investment based on a recommendation, forecast or any information supplied by any third-party.
✅DAX WILL KEEP GROWING|LONG🚀
✅DAX is trading in an uptrend
Along the rising support line
Which makes me bullish biased
And the index is about to retest the rising support
Thus, a rebound and a move up is expected
LONG🚀
✅Like and subscribe to never miss a new idea!✅

DAX Bearish Breakout! Sell!
Hello,Traders!
DAX broke out of the
Long-term rising wedge
And the breakout is confirmed
So we are bearish biased now
And we will be expecting
A further move down
Sell!
Like, comment and subscribe to help us grow!
Check out other forecasts below too!

GERMANY 30/40 DE40 DAX Bullish Heist PlanSmart Indices Traders,
NFP Trade master plan to Heist GERMANY 30/40 Market. my dear Looters U can enter after the NFP data there is high chance to go down side, Our target is Green Zone if it goes bearish side, Bullish side our target is Red Zone that is High risk Caution Pullback area, If There is any Bad news it make our heist very sad and if the news is favorable for us then we can continue our looting from there with help of trailing stop.
My dear Robbers please book some partial money it will manage our risk. Be safe and be careful.. Make money and take money.

Potential rebound for the DAX?DAX (DE40) could bounce off a pullback support at 18,082.30 which has been identified as a pivot point. Could price potentially rise toward the 1st resistance at 18,422.50?
Pivot: 18,082.30
Support: 17,899.30
Resistance: 18,422.50
Risk Warning:
Trading Forex and CFDs carries a high level of risk to your capital and you should only trade with money you can afford to lose. Trading Forex and CFDs may not be suitable for all investors, so please ensure that you fully understand the risks involved and seek independent advice if necessary.
Disclaimer:
The above opinions given constitute general market commentary, and do not constitute the opinion or advice of IC Markets or any form of personal or investment advice.
Any opinions, news, research, analyses, prices, other information, or links to third-party sites contained on this website are provided on an "as-is" basis, are intended only to be informative, is not an advice nor a recommendation, nor research, or a record of our trading prices, or an offer of, or solicitation for a transaction in any financial instrument and thus should not be treated as such. The information provided does not involve any specific investment objectives, financial situation and needs of any specific person who may receive it. Please be aware, that past performance is not a reliable indicator of future performance and/or results. Past Performance or Forward-looking scenarios based upon the reasonable beliefs of the third-party provider are not a guarantee of future performance. Actual results may differ materially from those anticipated in forward-looking or past performance statements. IC Markets makes no representation or warranty and assumes no liability as to the accuracy or completeness of the information provided, nor any loss arising from any investment based on a recommendation, forecast or any information supplied by any third-party.

DAX H4 | Falling to overlap supportDAX (GER30) is falling towards an overlap support and could potentially bounce off this level to climb higher.
Buy entry is at 18,131.66 which is an overlap support.
Stop loss is at 17,850.00 which is a level that lies underneath an overlap support and the 38.2% Fibonacci retracement level.
Take profit is at 18,513.50 which is a pullback resistance.
High Risk Investment Warning
Trading Forex/CFDs on margin carries a high level of risk and may not be suitable for all investors. Leverage can work against you.
Stratos Markets Limited (www.fxcm.com):
CFDs are complex instruments and come with a high risk of losing money rapidly due to leverage. 66% of retail investor accounts lose money when trading CFDs with this provider. You should consider whether you understand how CFDs work and whether you can afford to take the high risk of losing your money.
Stratos Europe Ltd, previously FXCM EU Ltd (www.fxcm.com):
CFDs are complex instruments and come with a high risk of losing money rapidly due to leverage. 70% of retail investor accounts lose money when trading CFDs with this provider. You should consider whether you understand how CFDs work and whether you can afford to take the high risk of losing your money.
Stratos Trading Pty. Limited (www.fxcm.com):
Trading FX/CFDs carries significant risks. FXCM AU (AFSL 309763), please read the Financial Services Guide, Product Disclosure Statement, Target Market Determination and Terms of Business at www.fxcm.com
Stratos Global LLC (www.fxcm.com):
Losses can exceed deposits.
Please be advised that the information presented on TradingView is provided to FXCM (‘Company’, ‘we’) by a third-party provider (‘TFA Global Pte Ltd’). Please be reminded that you are solely responsible for the trading decisions on your account. There is a very high degree of risk involved in trading. Any information and/or content is intended entirely for research, educational and informational purposes only and does not constitute investment or consultation advice or investment strategy. The information is not tailored to the investment needs of any specific person and therefore does not involve a consideration of any of the investment objectives, financial situation or needs of any viewer that may receive it. Kindly also note that past performance is not a reliable indicator of future results. Actual results may differ materially from those anticipated in forward-looking or past performance statements. We assume no liability as to the accuracy or completeness of any of the information and/or content provided herein and the Company cannot be held responsible for any omission, mistake nor for any loss or damage including without limitation to any loss of profit which may arise from reliance on any information supplied by TFA Global Pte Ltd.
The speaker(s) is neither an employee, agent nor representative of FXCM and is therefore acting independently. The opinions given are their own, constitute general market commentary, and do not constitute the opinion or advice of FXCM or any form of personal or investment advice. FXCM neither endorses nor guarantees offerings of third-party speakers, nor is FXCM responsible for the content, veracity or opinions of third-party speakers, presenters or participants.

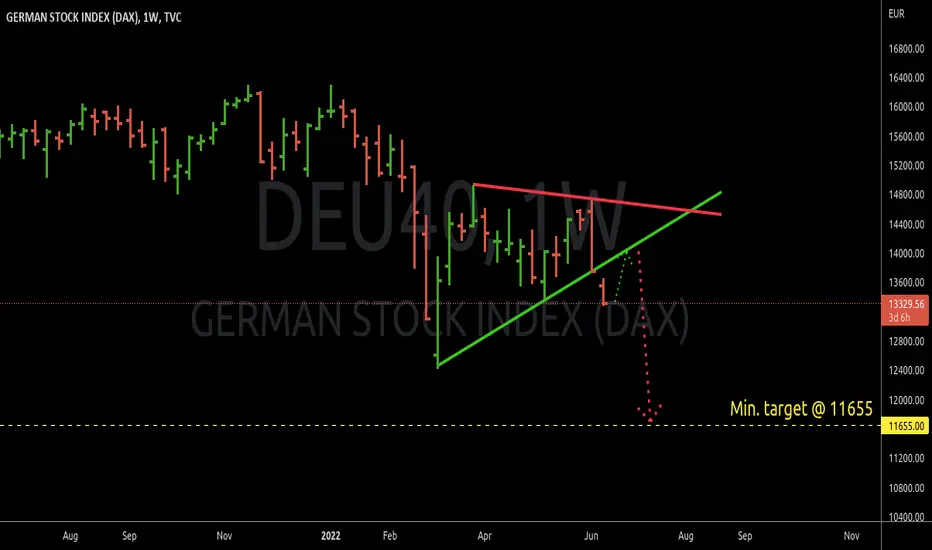
German DAX minimum target at 11655Expecting a bear rally from today (@ 13330 level) and later to print a lower target @ 13655
Green arrow ---> expected bear rally
Red arrow ---> crash to minimum 13655 level
INDEX:DEU40
XETR:DAX
VANTAGE:DAX40
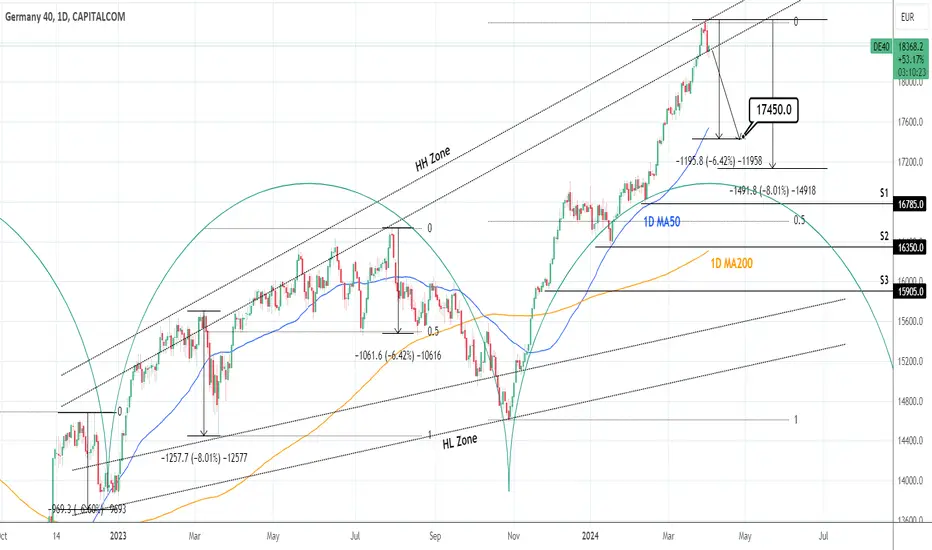
DAX: Overbought and in need of a technical correction.DAX is almost overbought on the 1D timeframe (RSI = 69.159, MACD = 322.400, ADX = 30.730) and heavily on the 1W (RSI = 76.198), which suggests that the long term trend is massively bullish but on the short term a pull back below the 1D MA50 is needed in order to harmonize the supply and demand equilibrium. The index has already been rejected at the top of the HH Zone, which is a first sign for a potential pullback. Even though in the first two quarters of 2023 it spent considerable time inside this Zone before making a correction (even under the 1D MA200), this time the 'necessity' for a short term correction is greater. We are aiming for the pattern minimum of -6.42% (TP = 17,450).
## If you like our free content follow our profile to get more daily ideas. ##
## Comments and likes are greatly appreciated. ##
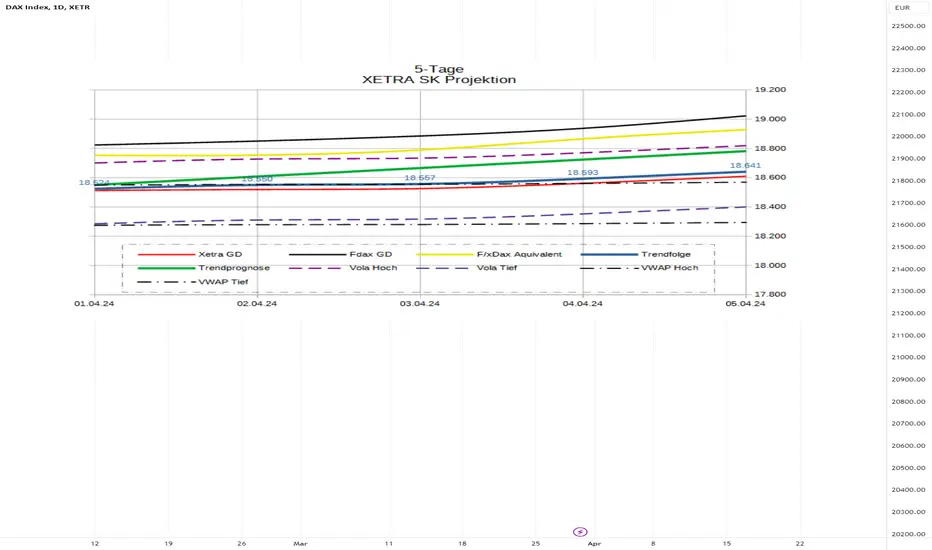
DAX weekly forecast from April 2nd, 2024Situation assessment XETR:DAX
1. We have reached another trend reversal zone
2. In our opinion, “much” after “above” is no longer possible in the future
We would like to apologize for the inaccuracy of last week's forecast {wink} when we headlined as follows:
1. Weekly UP peak: between 18,406 and 18,518 (Bonus: 18,630)
2. In perspective, EUREX:FDAX1! The next striking decision zone is 18,777 (+/-) in focus.
The weekly XETR:DAX peak was reached with 5 points less at exactly 18,513.83 and to create this forecast the FDAX reached 18,776 in late trading ;-). The rest of the forecast is also impressive...
Be that as it may, at the beginning of April we will be flooded with some standardized purchase orders (funds, savings plans, etc.) until the April expiry, which will give the DAX a slight further boost. Professional traders use this as an opportunity, especially at the end of the quarter, to take antagonistic positions and carry out a latent “rebalance” at the next quarterly end in June.
In perspective, we see the round 18,650 / 680 in XETR:DAX as a potential high point before we could take corrective measures. This would be equivalent to approximately $18,995 EUREX:FDAX1! points.
For the homeopathic Waver faction among us: … we see the 3 of the running 5 at the final end, before we get the 4... . As you have probably already noticed, we don't like "mystical wave predictions" - although we do take the "waves" into account in our models, just as emotionless and interpretation-free mathematical functions, e.g. in the form of adaptive signal decomposition . In addition, other factors often play a much more crucial role for professional traders than the “Bloomberg” faction is trying to sell us.
As long as XETR:DAX 18,535 can be validly overcome on a daily basis as of April 2nd over the course of the week, the gates are open for us to achieve even higher goals via 18,613 / 683. For this it would be necessary to overcome the 18,726 valid on a daily closing price basis over the course of the week. If this happens, nothing stands in the way of the ~18,900 to 19,095 / 209 until the April monthly witch dance.
From a standard pivot perspective, the XETR:DAX weekly-monthly comparison shows 18,646 / 679 as a valid resistance zone. Furthermore, the R2 annual pivot is at 18,597, which will not have an exact braking effect at this point, but will have a braking effect in this region.
Unless an exogenous black swan emerges, it is not worth paying much attention to the downside for the coming week. On the one hand, the hedging needs (VDAX, SKEW, ...) speak against this and, on the other hand, our trend barometer and the general momentum currently show no reason to worry. On the contrary: setbacks will be bought (!).
Nevertheless, the XETR:DAX Magistrale (MoB) is at 18,247 for the coming week. Only when it is validly below... is it time to consider a short strategy and set an anchor point again (did you remember? ;))
However, don't forget: we are in a shortened trading week in the western-oriented world with lower sales in the future and the associated volatile uncertainties (!) So don't be disappointed if the high in March has already been marked with the April contract change .
If you value this article and the work involved, follow us and give us a thumbs up - it doesn't hurt (:-)
It is worth mentioning “by the way” that in terms of chart technology we have achieved an extension from 2000 – 2008 with ~18,485.
We forecast based on mathematical models for XETR:DAX as follows:
1. Trend barometer: UP
2nd week UP peak: between 18,613 and 18,683 (Bonus: 18,726)
3rd week DOWN peak: between 18,357 and 18,287
4. Arithmetic mean: between 18,384 and 18,586
5. MOB technical price mark: 18,428
6. Pivot fluctuation range: 18,216 / 18,722
7. Fair Value GD / Low / High: 18,440 / 904 / 935
8. VIX Zones: 11.58 / 12.66
Notes
=====
Stock market rule: Markets can behave irrationally longer than you can remain solvent (John Maynard Keynes)
Forecasts are what they are: A look into the future taking into account the past, which can change dynamically, positively or negatively, from the time of publication
To create this forecast, a trend-following system (TM) developed in-house using, among other things, mathematical, statistical, rolling, volume-based, differential analysis methods is used and accordingly shortened and simplified in an informative, non-indirect manner here on Tradingview in the generally accessible public area free of charge for personal use.
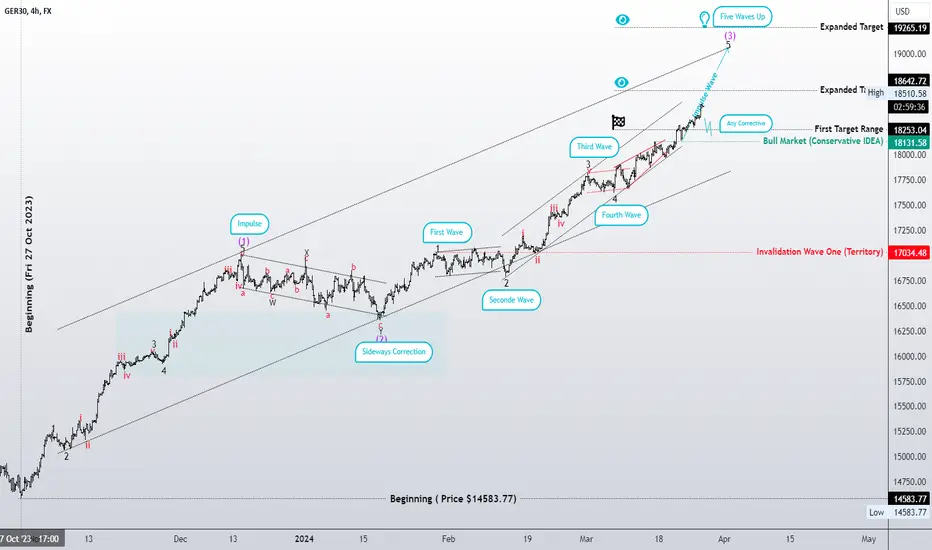
The continuation of the bullish market and then the wave degree Dear analysts and traders,
I hope you are doing well and are motivated for the week ahead. I wish you all the success in your business endeavors. Remember that success in trading lies in consistently defining and sticking to your rules.
As someone interested in the Elliott Wave Principle, I find it to be an invaluable tool for market analysis. I have developed my approach by combining this principle with my personal experience and by considering different scenarios that are likely to occur in the market. It should be noted that I do not like to be surprised in the market, and that's why I have different market prospects. I follow them to be sure and recognize the structure that is forming so that I can 100% recognize it.
I will share my analysis with you, but please note that I am not providing any buy or sell signals. My perspective on idea analysis is completely unbiased, so if the idea analysis meets your standards, you can use it as a guide to make an informed decision.
I have attached my previous analysis of the same market so that you can compare and see the differences. All the details of my analysis are clearly labeled, making it easy for you to understand. However, having a basic familiarity with the Elliott Wave Principle theory will help you understand the analytical idea more easily.
I have been studying the Elliott Wave Principle for almost three years now, and over time, my understanding of this knowledge and experience has grown. What I have achieved so far is the legacy of a genius called Ralph Nelson Eliot, and I am really happy with my progress. May peace be upon him.
Thank you for your support so far. I will always remember your kindness. Please share your comments and criticisms with me.
I hope my analysis will be useful to you in your business journey, and I wish you all the best.
Sincerely,
Mr. Nobody
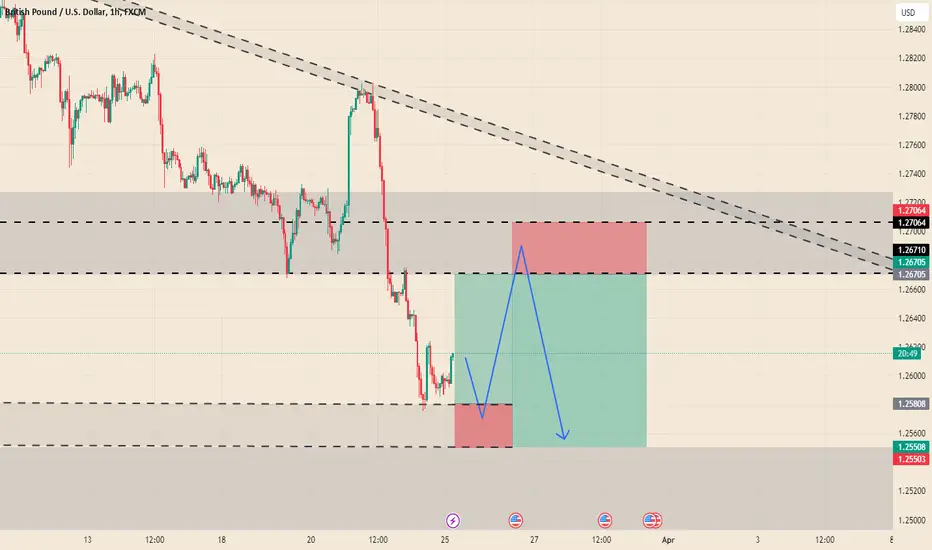
GBPUSD Based on my analysis, I recommend not taking a trade on GBPUSD as it is likely to reach the resistance level. Buying at this point would be risky as it goes against the current trend. However, if you do decide to take the buy trade, please be sure to respect the stop loss and exit the trade if necessary.
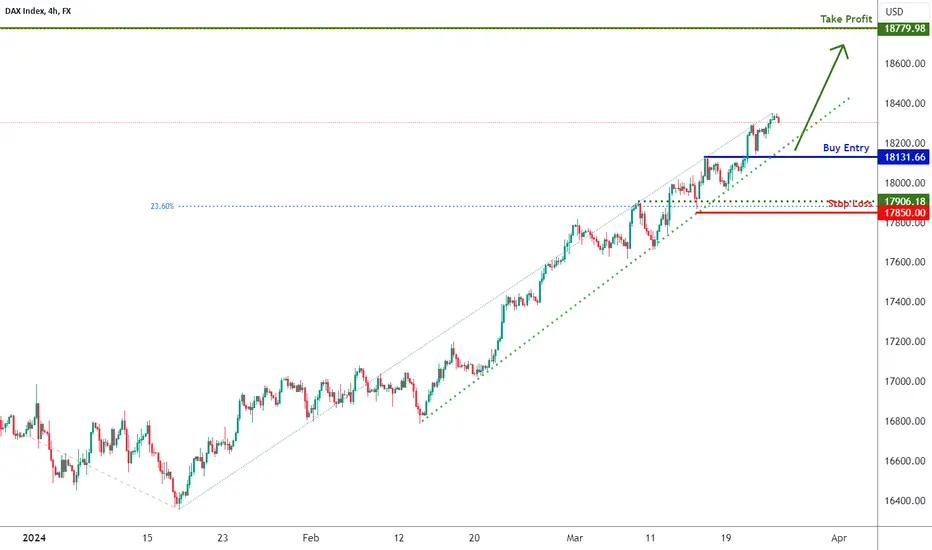
DAX H4 | Approaching overlap supportThe DAX (GER30) is falling towards an overlap support and could potentially bounce off this level to climb higher.
Buy entry is at 18,131.66 which is an overlap support.
Stop loss is at 17,850.00 which is a level that lies underneath an overlap support that aligns close to the 23.6% Fibonacci retracement level.
Take profit is at 18,779.98 which is a level that aligns with the 100.0% Fibonacci projection level.
High Risk Investment Warning
Trading Forex/CFDs on margin carries a high level of risk and may not be suitable for all investors. Leverage can work against you.
Stratos Markets Limited (www.fxcm.com):
CFDs are complex instruments and come with a high risk of losing money rapidly due to leverage. 66% of retail investor accounts lose money when trading CFDs with this provider. You should consider whether you understand how CFDs work and whether you can afford to take the high risk of losing your money.
Stratos Europe Ltd, previously FXCM EU Ltd (www.fxcm.com):
CFDs are complex instruments and come with a high risk of losing money rapidly due to leverage. 70% of retail investor accounts lose money when trading CFDs with this provider. You should consider whether you understand how CFDs work and whether you can afford to take the high risk of losing your money.
Stratos Trading Pty. Limited (www.fxcm.com):
Trading FX/CFDs carries significant risks. FXCM AU (AFSL 309763), please read the Financial Services Guide, Product Disclosure Statement, Target Market Determination and Terms of Business at www.fxcm.com
Stratos Global LLC (www.fxcm.com):
Losses can exceed deposits.
Please be advised that the information presented on TradingView is provided to FXCM (‘Company’, ‘we’) by a third-party provider (‘TFA Global Pte Ltd’). Please be reminded that you are solely responsible for the trading decisions on your account. There is a very high degree of risk involved in trading. Any information and/or content is intended entirely for research, educational and informational purposes only and does not constitute investment or consultation advice or investment strategy. The information is not tailored to the investment needs of any specific person and therefore does not involve a consideration of any of the investment objectives, financial situation or needs of any viewer that may receive it. Kindly also note that past performance is not a reliable indicator of future results. Actual results may differ materially from those anticipated in forward-looking or past performance statements. We assume no liability as to the accuracy or completeness of any of the information and/or content provided herein and the Company cannot be held responsible for any omission, mistake nor for any loss or damage including without limitation to any loss of profit which may arise from reliance on any information supplied by TFA Global Pte Ltd.
The speaker(s) is neither an employee, agent nor representative of FXCM and is therefore acting independently. The opinions given are their own, constitute general market commentary, and do not constitute the opinion or advice of FXCM or any form of personal or investment advice. FXCM neither endorses nor guarantees offerings of third party speakers, nor is FXCM responsible for the content, veracity or opinions of third-party speakers, presenters or participants.
DAX Analysis - Continuous, Just as the Markets !This is a Thread, so Follow for Technical Analysis performed with TrapZone Pro & UMVD Indicators.
* Trend is Based on TrapZone Color
* Bar Colors give us Momentum Green from strong Up Moves. Red Bars point to strong Down Moves.
* Red UMVD = Selling Pressure & Green UMVD = Buying Pressure. Purple is for Divergence = Battle of Supply & Demand
>> USE PAGE DN to go DOWN To the LATEST Post <<
--------------------
2-25-2024
Strong Upside Momentum with wide GREEN TrapZone established now and GREEN UMVD continues. Class A Entry at the top of the TrapZone.

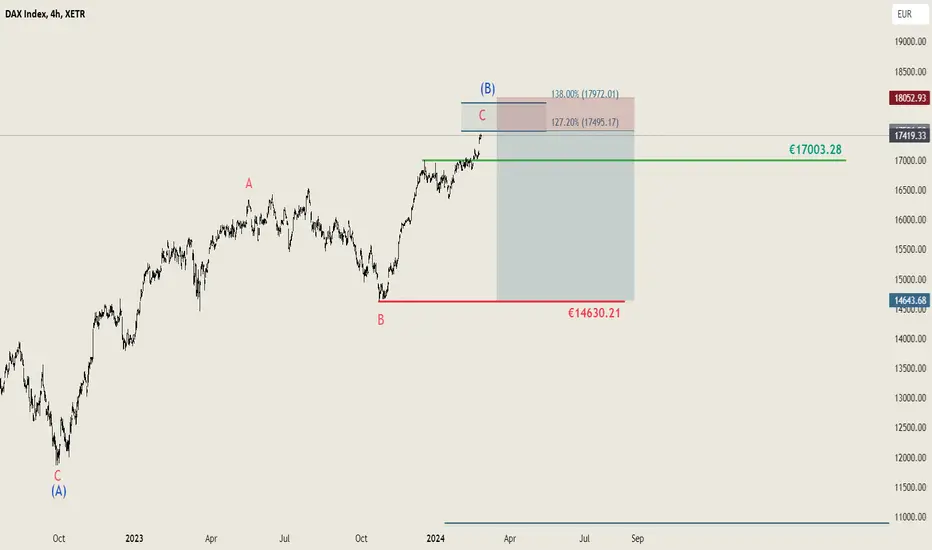
DAX (DAX Index): Waves of uncertainty 🌊DAX (DAX Index): XETR:DAX
We recognize that our analysis might diverge from other analysts', but our assessment clearly indicates that the DAX is currently in an overarching Wave 4, visible on the weekly chart within a multi-year scenario. This holds unless we surpass the 18,000 level. If we move beyond 18,000, a reevaluation and recount would be necessary. Until then, we anticipate a decline in the DAX over the coming weeks, months, and possibly years. The exact timing, whether it rises or falls, cannot be pinpointed to a specific year. However, it's important to note that as long as the DAX doesn't exceed 138%, or the 18,000 mark, we expect to be in an Expanded Flat scenario. This aligns well with our expectations for Wave C or the overarching Wave IV, which should fall below Wave (A), fitting the pattern where both B and C waves overshoot in an Expanded Flat.
Examining the 4-hour chart, we encounter the same scenario. Without flipping this key level, no significant change is expected. The 1-hour and 4-hour charts suggest an imminent rise, not immediately obvious on the daily or weekly charts, predicting a climb to around 17,500 euros before a downturn in the DAX. We do not anticipate an immediate reversal today or tomorrow but expect a final upward impulse before a corrective move downwards.
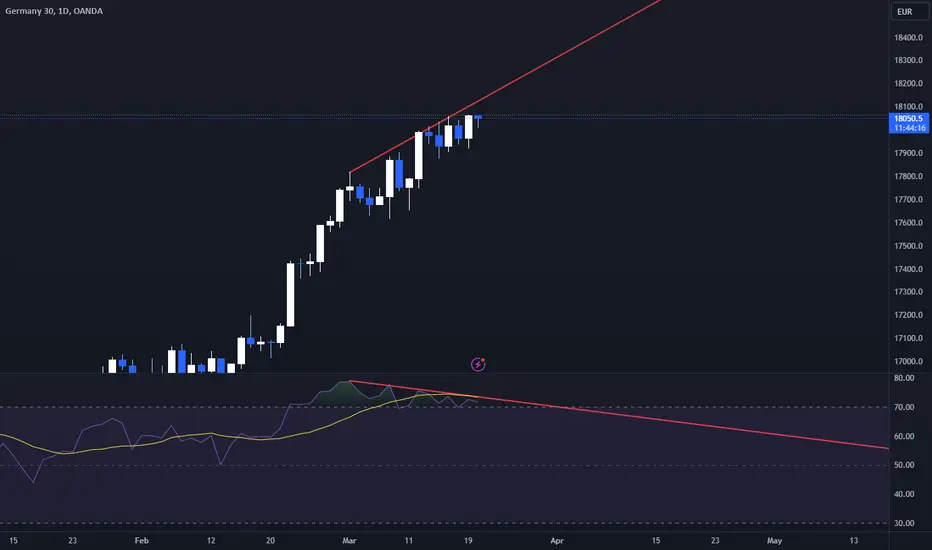
DE40 DAX sell scenarioDax de40 have been in a crazy bull run since few months and i think its time for a slow down. oblique support have been broke, index is oversold in weekly and we can see it loosing bull power and forming flat top in lower timeframe. I think we can see it make a last push up in the 18100 area and then start a correction since the market like to sell high. i will try a short in this area after a good final push. i will five SL and TP 1 once we reach the potential selling area.

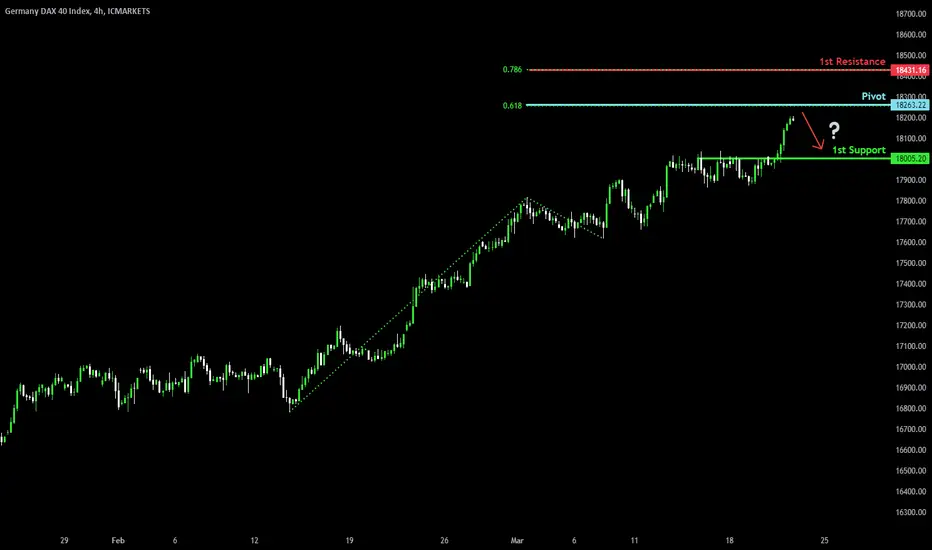
Resistance overhead?The DAX (DE40) could rise towards a resistance level at 18,263.22 which has been identified as a pivot point. Could price stall around this level before potentially making a bearish reaction to drop lower?
Pivot: 18,263.22
Support: 18,005.20
Resistance: 18,431.16
Risk Warning:
Trading Forex and CFDs carries a high level of risk to your capital and you should only trade with money you can afford to lose. Trading Forex and CFDs may not be suitable for all investors, so please ensure that you fully understand the risks involved and seek independent advice if necessary.
Disclaimer:
The above opinions given constitute general market commentary, and do not constitute the opinion or advice of IC Markets or any form of personal or investment advice.
Any opinions, news, research, analyses, prices, other information, or links to third-party sites contained on this website are provided on an "as-is" basis, are intended only to be informative, is not an advice nor a recommendation, nor research, or a record of our trading prices, or an offer of, or solicitation for a transaction in any financial instrument and thus should not be treated as such. The information provided does not involve any specific investment objectives, financial situation and needs of any specific person who may receive it. Please be aware, that past performance is not a reliable indicator of future performance and/or results. Past Performance or Forward-looking scenarios based upon the reasonable beliefs of the third-party provider are not a guarantee of future performance. Actual results may differ materially from those anticipated in forward-looking or past performance statements. IC Markets makes no representation or warranty and assumes no liability as to the accuracy or completeness of the information provided, nor any loss arising from any investment based on a recommendation, forecast or any information supplied by any third-party.
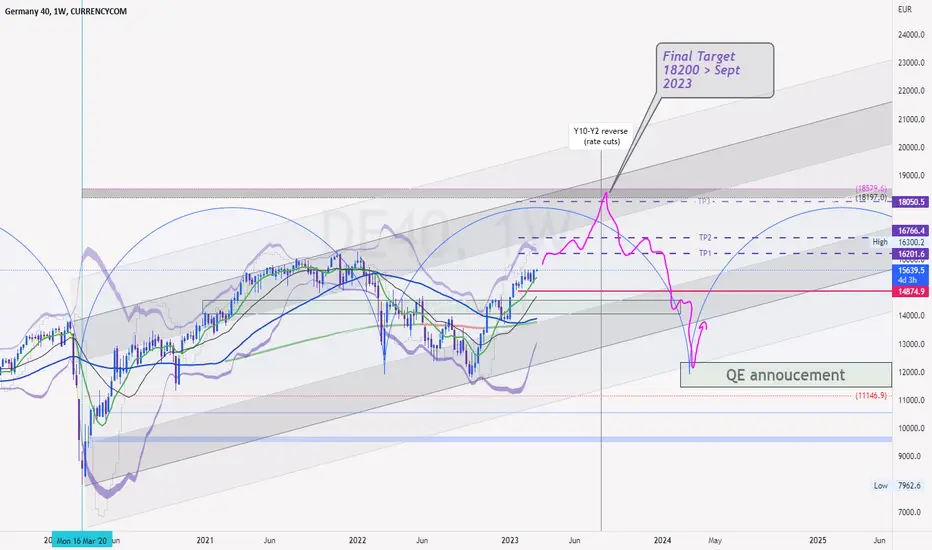
DAX up until yield curve reverses upwardSurrounded by bears > i thought I'd post a bullish view.
On the weekly chart SMA 7, 20, 50 & EMA 200 all pointing up...
SMA 50 about non crossing EMA 200 will be the confirmation the trend i snot over... we'll see end of week with NFP.
If bull is confirmed Targets are on chart... Estimated ATH summer/sept 2023
Red line invalidate the concept !
#DAX, #GER30 is ready to fall.-----------DAX DOWNSIDE MOVE IS ABOUT TO HAPPEN-----------
DAX index shows a few signs that it is ready to deep dive. The course is at all time high. Economic indicators like GDP, interes rate, emloyment don't support that optimistic behaviour. Weekly RSI is at overbought territory. And daily RSI shows divergence. I think it is time to re-consider the long positions at least or rather start to build a short position on German stock index.
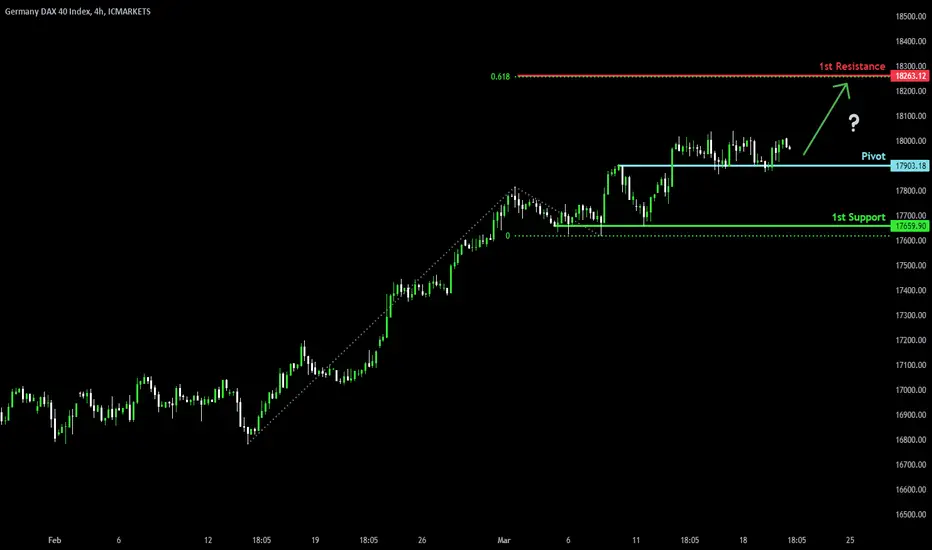
Potential bounce to new ATHs?The DAX (DE40) could fall towards an overlap support at 17,903.18 which has been identified as a pivot point. Price could potentially bounce off this level to make a new all-time-high (ATH).
Pivot: 17,903.18
Support: 17,659.90
Resistance: 18,263.12
Risk Warning:
Trading Forex and CFDs carries a high level of risk to your capital and you should only trade with money you can afford to lose. Trading Forex and CFDs may not be suitable for all investors, so please ensure that you fully understand the risks involved and seek independent advice if necessary.
Disclaimer:
The above opinions given constitute general market commentary, and do not constitute the opinion or advice of IC Markets or any form of personal or investment advice.
Any opinions, news, research, analyses, prices, other information, or links to third-party sites contained on this website are provided on an "as-is" basis, are intended only to be informative, is not an advice nor a recommendation, nor research, or a record of our trading prices, or an offer of, or solicitation for a transaction in any financial instrument and thus should not be treated as such. The information provided does not involve any specific investment objectives, financial situation and needs of any specific person who may receive it. Please be aware, that past performance is not a reliable indicator of future performance and/or results. Past Performance or Forward-looking scenarios based upon the reasonable beliefs of the third-party provider are not a guarantee of future performance. Actual results may differ materially from those anticipated in forward-looking or past performance statements. IC Markets makes no representation or warranty and assumes no liability as to the accuracy or completeness of the information provided, nor any loss arising from any investment based on a recommendation, forecast or any information supplied by any third-party.
DAX, will the next crisis end the current phase?Hello everyone,
this is not a usual trading analysis. So don't take any trades from monthly levels, as you can't manage the risk at all. What you can see is my try to figure out how the DAX went through different states of price development and really interesting to see is, that every big crisis ended one phase and opened a new one.
In my point of view we are currently at the way to the upper boundary of the recent phase and should reach it within the next year. The question is, where will the price finally find a solid ATH and start to correct? According to my last daily analysis a strong zone could be around 17.600, but if the economy is holding really strong into next years, higher prices are possible of course.
If you want to be in the big short trade, that I'm anticipating from the upper boundary, you have to wait patiently for a fundamental crisis, which has more impact than the banking crisis, energy crisis or the current wars, as they didn't stop the price for a long time.
The only reason I can anticipate for now is a comeback of high inflation with even higher interest rates, that end up in a big recession and the consequences for the banking and financial system. I will monitor this scenario next year, especially the month february and march are likely to offer crisis potential.
