Market Update - BTC, ETH, DXY, DJI, NDX, SPXQuick market update of weekend price action primarily focusing on BTC.
The expectation is that bearish deviations are starting to show up on the 4hr
a smaller retracement is expected. Still general bullishness in the market,
however, we have outlined some levels to focus on primarily 17.1k and 17.45k
Keep an eye on the DXY and expect some inverse correlation as usual
D-DJI

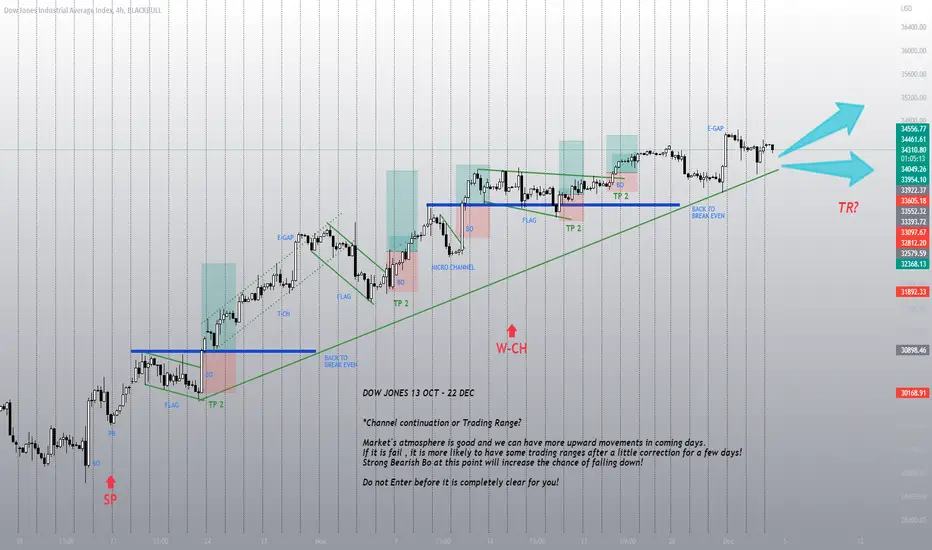
Channel continuation or Trading Range?Market's atmosphere is good and we can have more upward movements in coming days.
If it is fail , it is more likely to have some trading ranges after a little correction for a few days!
Strong Bearish Bo at current point will increase the chance of falling down!
Do not enter until it is completely clear for you!!
Dow Jones Weekly Volatility Analysis 5-9 Dec 2022 Dow Jones Weekly Volatility Analysis 5-9 Dec 2022
We can see that currently the implied volatility for this week is around 2.82%, down from 3.06% last week according to VXD data
With this in mind, currently from ATR point of view we are located in the 7th percentile, while according to VXD, we are on 8th percentile.
Based on this, we can expect that the current weekly candles ( from open to close ) are going to between:
Bullish: 2.6% movement
Bearish: 1.9% movement
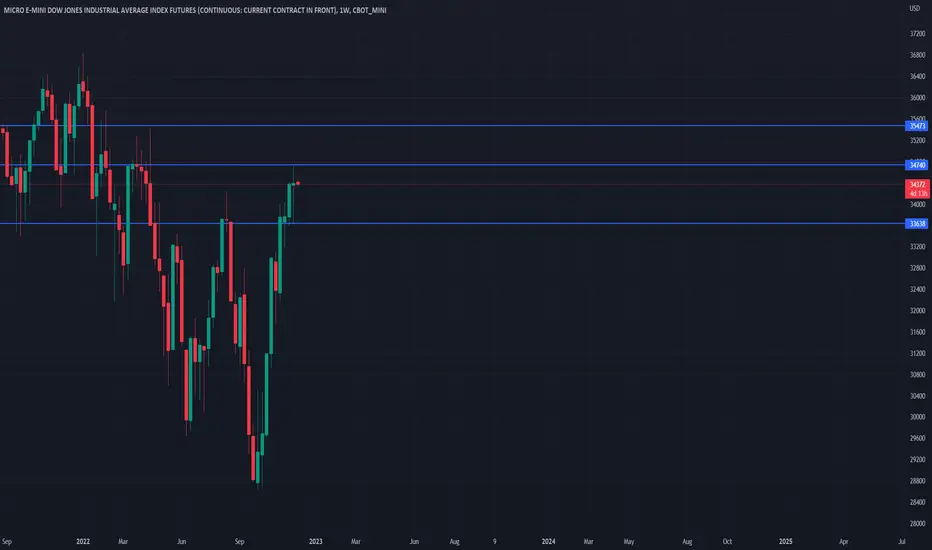
At the same time, with this data, we can make a top/bot channel which is going to contain inside the movement of this asset,
meaning that there is a 19.5% that our close of the weekly candle of this asset is going to be either above/below the next channel:
TOP: 35473
BOT: 33370
Taking into consideration the previous weekly high/low, currently for this candle there is :
79% probability we are going to touch previous high of 34750
21% probability we are going to touch previous low of 33370
Lastly, from the technical analysis point of view, currently from
Weekly timeframe indicates 77% BULLISH trend
Daily timeframe indicates 80% BULLISH trend
4H timeframe indicates 53.3% BULLISH trend
FED PIVOT conclusion= BUY/SELL setupFED PIVOT conclusion to take ENTRY:
FED PIVOT 2022 looks similar to 1973:
PIVOT MONTH=if occur in DECEMBER.
POSSIBILITY= <30% rise(BULL TRAP) (17.44% already happened) till
JANUARY followed by around 40% CRASH.
FED PIVOT 2007:
PIVOT MONTH=AUGUST.
14.99% rise till october followed by 57.69% CRASH.
FED PIVOT 2000:
PIVOT MONTH=DECEMBER.
10.31% rise(BULL TRAP) till JANUARY followed by 44.44% CRASH.
FED PIVOT 1973:
PIVOT MONTH=OCTOBER.
13.11% rise(BULL TRAP) already happened
till OCTOBER followed by 45.97% CRASH.

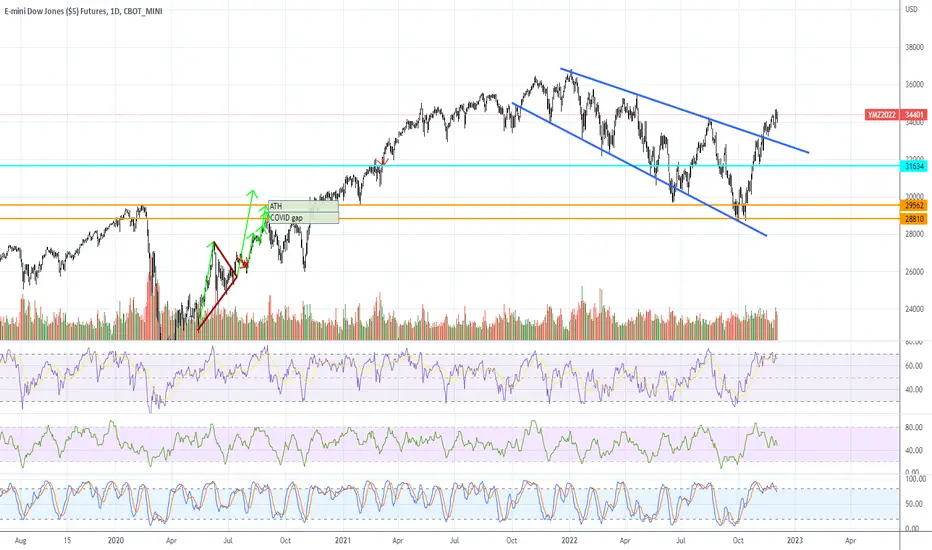
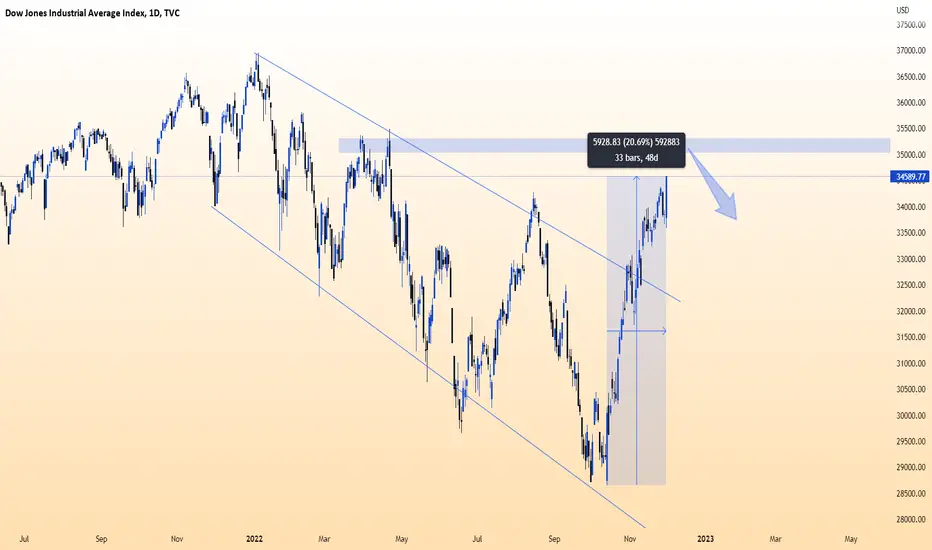
YM (Dow) UpdateI don't usually look at the Dow, but you can see that it has clearly broken the year long down channel.
That is bullish for the other indices.
$DJI @ Support - Showing RSI weakness - Likely trade sidewaysDaily
Maybe call this the HOVERCRAFT Pattern
$DJI @ Red EMA support, bouncing
4Hr
Bullflag pattern ok, within range
Hr
BEARFLAG trade done
ALERT
RSI beginning showing neg divergence
(Couldn't post the flags as reached limit day before)
#stocks #DJI #DJIA
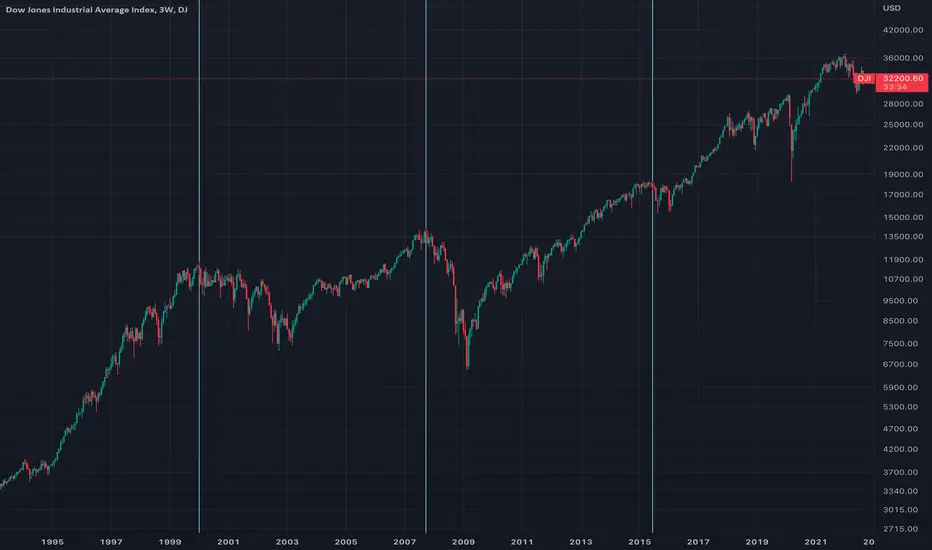
23 Years, 4 RecessionsThere is not much explanation needed, every 7,7 years a recession happens.
Curiously, if you expand the same chart to the past, it reaches the top of the Great Recession.
So in March of 2023 we reach the top????
In 2015 we didn't have a crash. Maybe, just maybe, the 2023 crash will be a double-sized one. Since we still owe the 2015 capitulation.
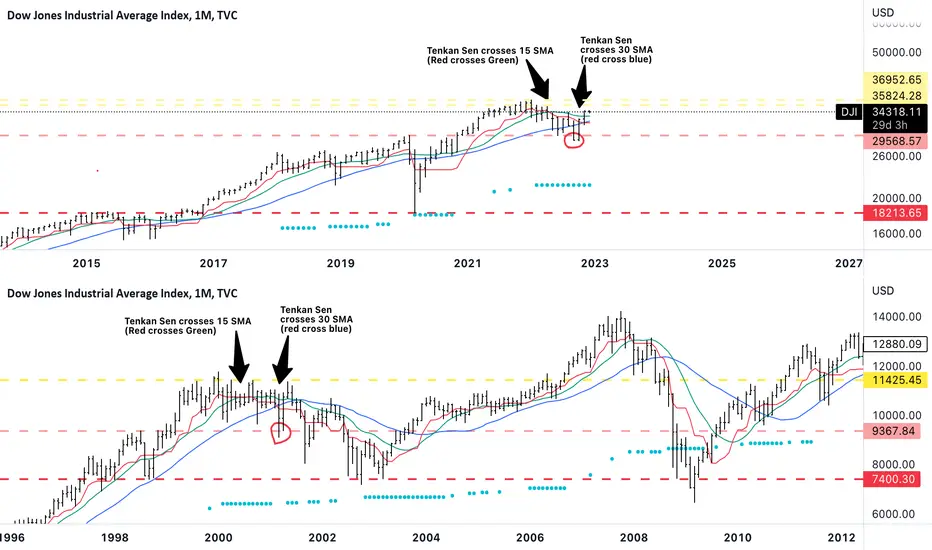
Follow the DOW for clues....The DOW is the leader right now...and the saying "Don't fight the Fed" is still very much applicable. There is no pivot, inflationary pressures still exist and the 2022 moves in the US 10 year should not be taken lightly.
If you read over my last post (Nov 15th) you know we are following a path similar to the Dot com bust bear market except this time it will be labeled as the Bond bust.
DJI (DOW) continues to follow the 2000-2002 path of SMA's flattening out over time while SPX, RUT & NDX lag behind DJI. Obviously, no two bear markets are exactly the same but they can follow similar patterns.
In the 2000-2002 bear market you can see the 2 year battle between the bulls/bears wore them both out; just like we have seen over the past year. The 9 SMA or Tenkan Sen has crossed below the 15 & 30 SMA's just like they did during the dot com bust...we then proceeded to re-test the ATH after the crossing of these SMA's before more rejection. I warned in my last post the DJI would probably reach the 35,000 "ish" range and I still believe we will hit this area...I mean Santa is coming to town right? The areas of resistance for DJI are now 35,492.22; 35,824.28 & 36,952.65...I will begin to ladder into the sell side when we get above 35,000.
US 10 Year on a 6 month timeframe-This chart should scare the you know what out of any company or person with revolving credit! The continued hiking of interest rates is not "transitory".
Commodity Index-Inflationary pressures still exist in case you thought we've reached "peak inflation"....the weekly is one scary looking bull flag. Just takes another "event" and watch out.
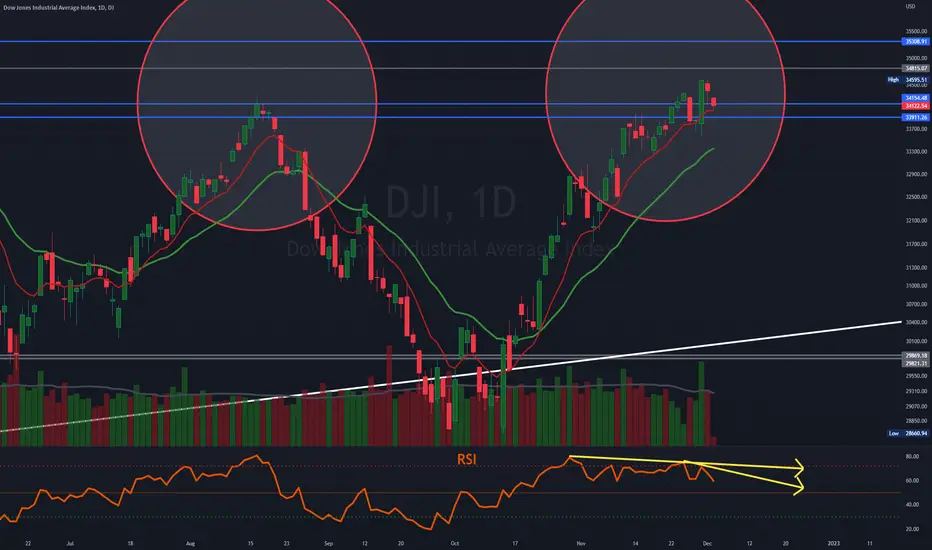
$DJI longer term view Most of our major calls have been $
$DJI short term uptrend since 10/31
#DJI low gap pretty much filled
RED CIRCLES are important, where from here? Both are dojis
LONG TERM still in up trend
SWINGS are getting bigger!!!
Maybe now sideways till Jan

$DJI Painting the tape?Best if you see it yourself, 1-5 minute data
$DJI giving back most of gains, volume very light
How heavy was yesterdays volume?
Daily looks HUGE but let's dissect
When pump was LIGHT, looked HEAVY
BUT majority came in @ 4PM!
See longer term time frame, next post

DJI Dow Jones Short???Hello there!
Great news came out yesterday regarding the interest rates by May 2023. Regardless, a great pump in market yesterday. But with such actions opportunities arise that can be seen while charting the trend.
Here we have Dow Jones Industrial DJI shown:
- A previous falling wedge worked it self into a nice pump.
- Heading into correction territory.
- How do you find where the correction will retest and bounce?
-- Take a look at the previous Unclosed gad in green box at the 1HR chart. Gaps eventually will have to be closed.
-- Also take a look at the FIB where the 0.618 lands, right at the GAP.
What are your thoughts?
Thank you for taking a look. Cheers.

NASDAQ Volatility Looking to Come Down to a 1.13 ExtensionWe have an Ascending Broadening Wedge with a Confirmed Partial-Decline and Hidden Bearish Divergence and a Potential Bearish BAMM Shark that is targeting $10.2657 on the NASDAQ Volatility Index.

DJI pumped 20% from dip, that must be enough. im SHORT at BLUE
we longed SPX and market at dip at October 2022. and DJI pumped 20%!! that pump was for what; inflation? decreasing rates?
now time to get out. im gonna start for Short positions at Blue zone.
DJI & Dow Jones
DJI Potential For Bullish ContinuationThe overall bias for DJI is bullish on the H4 chart. Additionally, the price is above the Ichimoku cloud , demonstrating a bullish market. Price has tapped into my buy stop entry at swing high 34106. 01 for this trade. At the previous swing low of 33063.05, where my relative safe stop loss is located. Take profit will be at 35492.22, where the previous swing high is.
Please be advised that the information presented on TradingView is provided to Vantage (‘Vantage Global Limited’, ‘we’) by a third-party provider (‘Everest Fortune Group’). Please be reminded that you are solely responsible for the trading decisions on your account. There is a very high degree of risk involved in trading. Any information and/or content is intended entirely for research, educational and informational purposes only and does not constitute investment or consultation advice or investment strategy. The information is not tailored to the investment needs of any specific person and therefore does not involve a consideration of any of the investment objectives, financial situation or needs of any viewer that may receive it. Kindly also note that past performance is not a reliable indicator of future results. Actual results may differ materially from those anticipated in forward-looking or past performance statements. We assume no liability as to the accuracy or completeness of any of the information and/or content provided herein and the Company cannot be held responsible for any omission, mistake nor for any loss or damage including without limitation to any loss of profit which may arise from reliance on any information supplied by Everest Fortune Group.

Dow Jones Industrial Average Index Concern!Today you can review the technical analysis idea on a 1M linear scale chart for the Dow Jones Industrial Average Index (DJI).
In the chart, I added in the RSI as well as review the Great Recession history to get an idea of where the DJI is headed. It seems that the DJI has been moving up an ARC with a possibility to come down and touch it again. It is currently inside a descending channel. If DJI price falls as much as it did during the Great Recession, it could come down to the $18K level where there is strong support. The RSI could support that type of drop as it is no where near the oversold region.
This is presented on the monthly chart so please have patience.
If you enjoy my ideas, feel free to like it and drop in a comment. I love reading your comments below.
Disclosure: This is just my opinion and not any type of financial advice. I enjoy charting and discussing technical analysis . Don't trade based on my advice. Do your own research! #millionaireeconomics

Market Update 11/30/22 Timestamps BelowReal support for Vix is below at 19.8 and 19.4 with the strong trend line at 17.6. Though Powell did have bullish comments today, the price movement of the VIX supported the likelihood of a market move upwards more so than a market move down.
Time Stamps:
VIX 0:00
APPL 11:00
NASDAQ 14:39
DXY 15:40
BTC 16:50
SPY & DJI 18:22
