US100 - New Highs are coming!Market Context
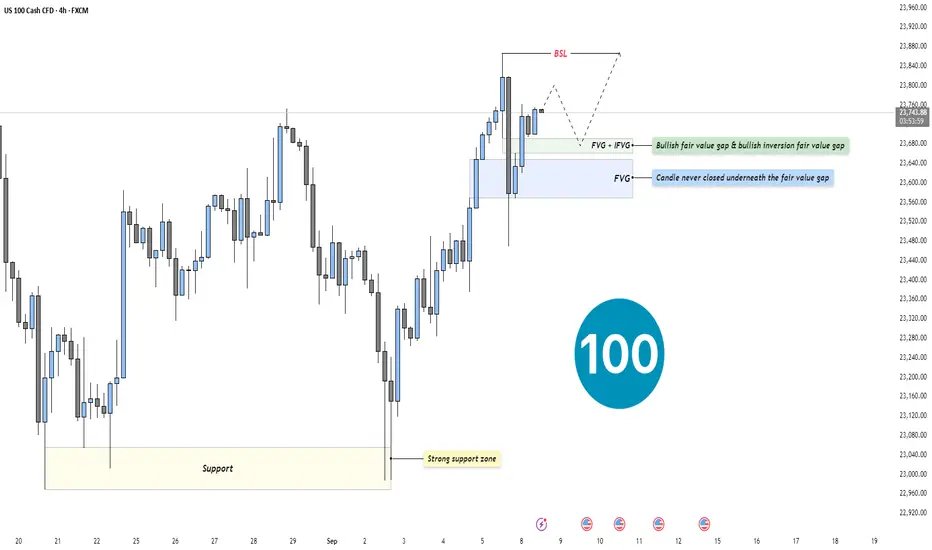
The US100 is trading within a strong bullish structure after bouncing from a well-defined support zone. Price has been respecting key levels on the way up, forming fair value gaps (FVGs) that act as stepping stones for continuation. The overall picture points to a market that is building momentum for a potential liquidity grab higher.
Support Zone & Initial Rally
The chart shows a strong support zone at the lows, which provided the foundation for the current bullish impulse. Once price tapped into this area, buyers stepped in aggressively, leaving behind multiple bullish imbalances on the way up. This confirms that institutional interest is present at these levels.
Fair Value Gaps & Structural Strength
On the rally, price created overlapping FVGs, including a bullish fair value gap and an inversion fair value gap (IFVG). Importantly, candles never closed below the primary FVG — reinforcing its validity as strong demand. This means that even if price retraces, these areas will be closely watched for re-entries.
Liquidity Grab & Next Move
Above current price action lies a clear buy-side liquidity (BSL) level. The market is likely to target this zone, either directly from current levels or after a retest into the stacked FVGs. A liquidity sweep above the highs would be the natural continuation of the bullish structure, unlocking the potential for new short-term highs.
Final Thoughts
The US100 is showing a textbook bullish setup: strong support, healthy retracements, and unmitigated FVGs acting as demand. As long as the lower support holds, the expectation remains for a run into the BSL above.
If this analysis brought value, drop a like — and let me know: are you waiting for the retest, or do you think the market runs the highs straight away?
D-ETH
Bitcoin September 2025 Outlook: a/b/c price fractal structureBTC enters September post-ATH with a seasonal headwind. Base case: a ~10% A-leg dip toward $108k, a B-bounce into ~$122k, then a C-flush near ~$94k—echoing April’s ABC rhythm. Once complete, the uptrend should re-assert into year-end. 📉🔁📈 #Bitcoin #Seasonality #Crypto
🟠 Bitcoin September Outlook: Seasonality vs. Structure
After a fresh ATH, September’s historical bias skews mildly red. Base case is a ~10% A-leg dip that develops into an A/B/C correction before trend continuation. Think controlled pullback → consolidation → next markup. 📉➡️🔁➡️📈
________________________________________
🗓️ Seasonality Snapshot (2015–2024)
• Mean (10-yr): −2.55% · Median: −4.52%
• Red months: 6/10
• Worst September: 2019 (−13.88%)
• Best September: 2024 (+7.39%)
• Last 3 yrs avg: +2.8% (2024 +7.39%, 2023 +3.99%, 2022 −3.09%)
• Last 5 yrs avg (2020–2024): −1.3%
Read: September has tended to be weak, but the last two years printed green. Seasonality is a headwind—not a handbrake. 🌬️
________________________________________
🧩 Structure Thesis (Fractal Analog)
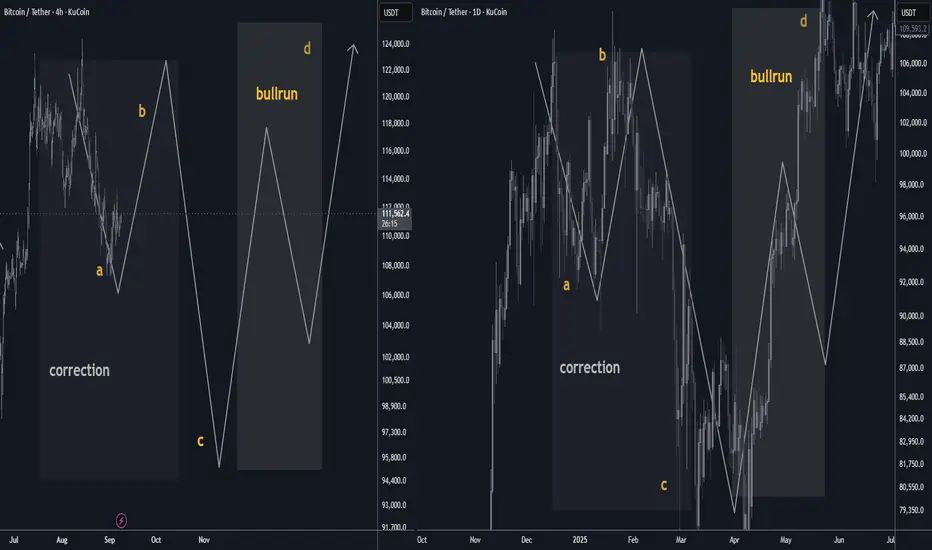
You’re looking for a repeat of April 2025’s A/B/C rhythm—scaled up:
• April 2025 reference: A ≈ $92k → B ≈ $106k → C ≈ $80k
• Now (projected):
o A ≈ $108k (≈ 10% pullback from recent highs) 📉
o B ≈ $122k (relief rally / lower high) 🔁
o C ≈ $94k (final flush into demand, completing the correction) 🧱
Interpretation: A measured September fade aligns with the A-leg. A reflexive B-bounce can follow as funding resets and late longs get cleaned up, with a C-leg completing the pattern before the next expansion. 🚀
________________________________________
📊 How Seasonality Supports the Call
• Typical drag: Median −4.5% and multiple red Septembers justify a down-bias.
• Volatility window: The historical 21-point spread (best +7.39% vs worst −13.88%) means a 10% dip sits well within normal bounds.
• Cycle context: With a new ATH just printed, a shallow corrective phase is constructive—not bearish regime change.
________________________________________
🧭 Levels & Triggers
• Bias line: Momentum cools into $108k → watch for seller absorption and open interest reset.
• Relief cap: $122k acts as B-rally resistance; sustained closes above $122k would invalidate the ABC idea and argue for immediate continuation. ✅
• Completion zone: $94k (C) is the buy-the-dip completion area; clean breaks below raise risk of a deeper time correction rather than a swift V-reversal. ⚠️
________________________________________
🧪 What to Monitor (Confirmation/Invalidation)
• Liquidity & OI: De-leveraging into A, controlled OI rebuild into B, washout into C.
• Spot-ETF flows / stablecoin issuance: Weakening into A, stabilizing by late month supports B→C rhythm.
• Funding/basis: Overheated → normalize during A; negative spikes near C often mark capitulation.
• Breadth (alts): Underperform into A/C; broad risk-on breadth usually returns post-C.
________________________________________
📝 Base Case Path (Textbook)
September: drift to $108k (A) → bounce toward $122k (B) → final tag of ~$94k (C) → reset + markup into Q4.
(If price reclaims and holds above $122k early, treat that as trend continuation—not a correction.)
________________________________________
🔒 Risk Notes
• Seasonality is a tendency, not a rule. Macro catalysts (CPI, policy, liquidity) can dominate calendar effects.
• This is market commentary, not financial advice. Manage risk and invalidation levels. 🛡️
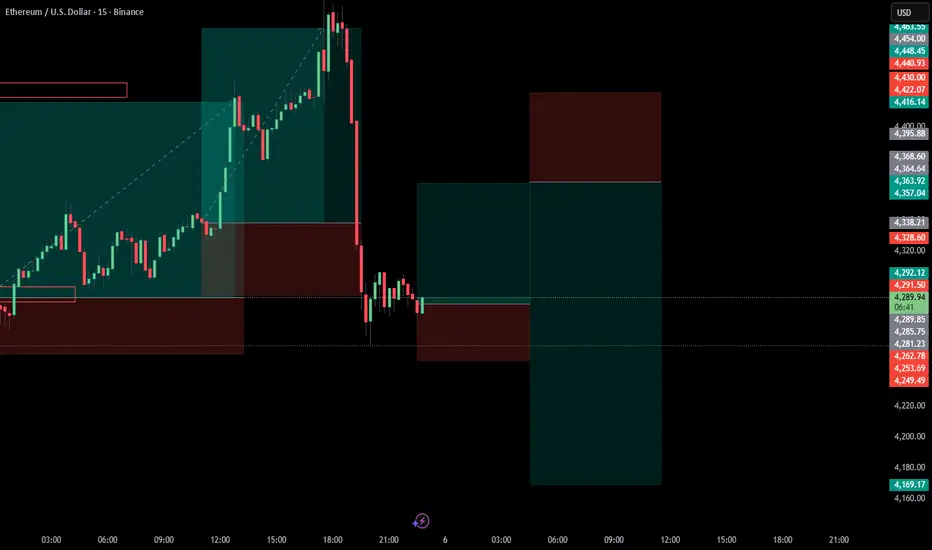
ETHUSD BUY NOW 4287🟢 ETHUSD – Bullish Setup at 4287 Long Opportunity
Ethereum is holding strong above key support at 4280–4290, showing signs of bullish continuation. Price action confirms buyer strength, with momentum indicators aligning for a potential breakout toward higher resistance zones.
🔹 Trade Idea: BUY ETHUSD @ 4287
- Entry: 4287
- Stop Loss: 4215 (below recent structure)
- Take Profit: 4450 / 4600
- Risk/Reward: ~2:1
📊 Technical Confluence:
- Bullish engulfing candle on 1H
- MACD crossover and RSI above 50
- Price respecting ascending channel
- Volume spike confirming accumulation
💬 Narrative:
ETH continues to attract institutional interest, with inflows rising and sentiment shifting bullish. A clean break above 4350 could accelerate toward 4600, especially if BTC maintains strength.
ETH Game PlanETH Game Plan
📊 Market Sentiment
Market sentiment remains strongly bullish as the FED is expected to deliver a 0.25% rate cut, with speculation building for a possible 0.5% cut in September. Monetary policy shifts are being driven by both inflation trends and weakening labor market data. The latest August and September job reports were soft, signaling that the economy is cooling rapidly. This environment continues to fuel expectations for a major bullish run in the weeks ahead.
📈 Technical Analysis
Price has shown strong HTF bullish momentum, recently reaching all-time highs.
Currently, ETH appears to be in an accumulation phase, gathering liquidity and energy before the next expansion higher.
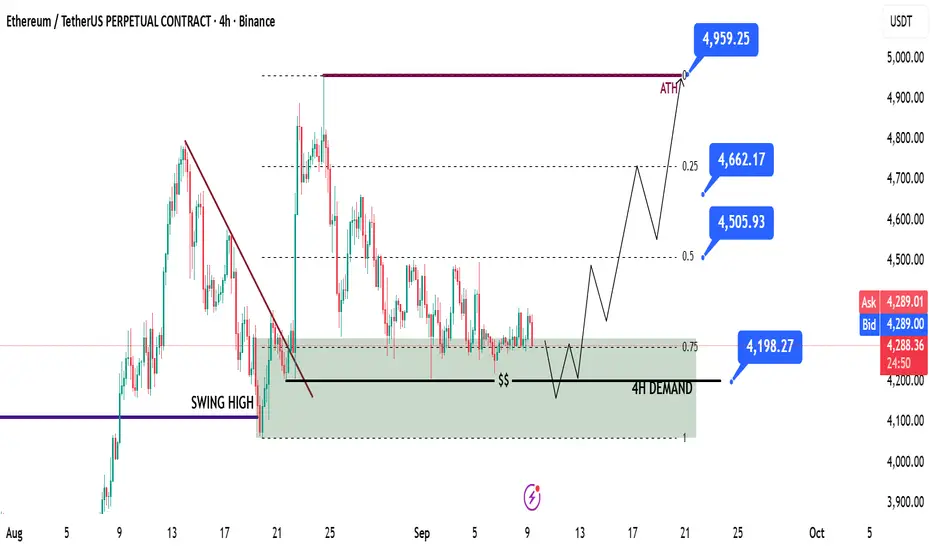
📌 Game Plan
Price should run the $4200 level, which is equal lows and likely contains significant liquidity.
I will then look for a close back above $4200 with a newly formed 4H demand zone.
🎯 Setup Trigger
4H structure break following the liquidity run.
📋 Trade Management
Stoploss: 4H swing low confirming the BOS
Targets:
TP1: $4500
TP2: $4650
TP3: $5000 (All-Time Highs)
💬 Like, follow, and comment if you find this setup valuable!
⚠️ Disclaimer: This content is for informational and educational purposes only and does not constitute financial, investment, or trading advice. Always do your own research before making any financial decisions.
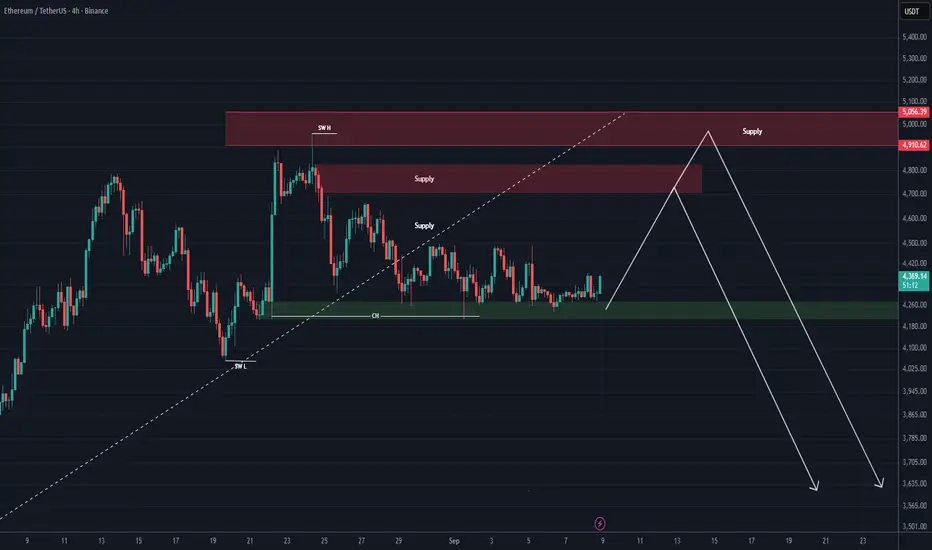
ETH New Update (4H)This analysis is an update of the analysis you see in the "Related publications" section
Honestly, as you know, the market had been ranging for several days without much movement. On the chart, we had signs of a drop, but the drop didn’t happen, and instead the market dropped in a way that was shown.
Considering that the demand zone has held and the market is still ranging, we can return to the scenario of (this analysis () and expect to see some recoveries from Ethereum.
Either Ethereum can get rejected from the identified supply zone, or it can make a new all-time high afterwards.
For risk management, please don't forget stop loss and capital management
When we reach the first target, save some profit and then change the stop to entry
Comment if you have any questions
Thank You
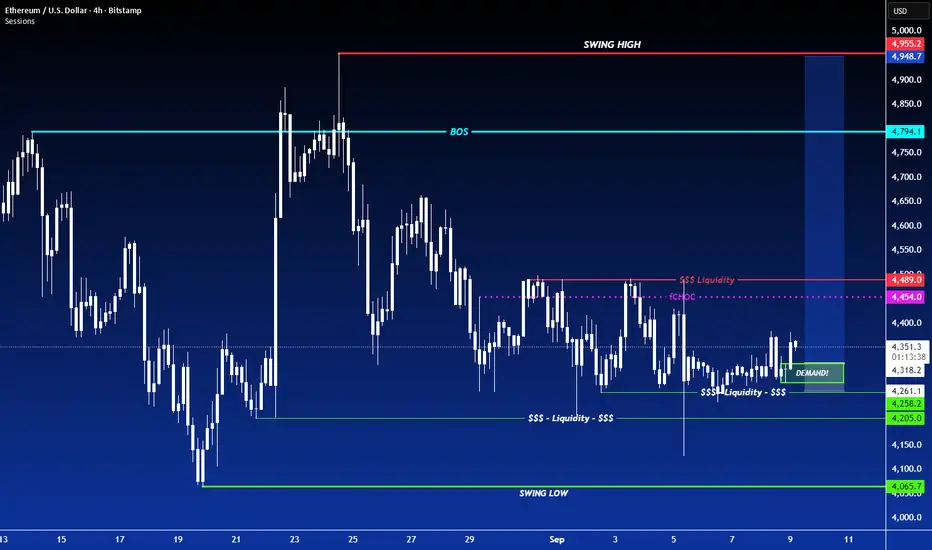
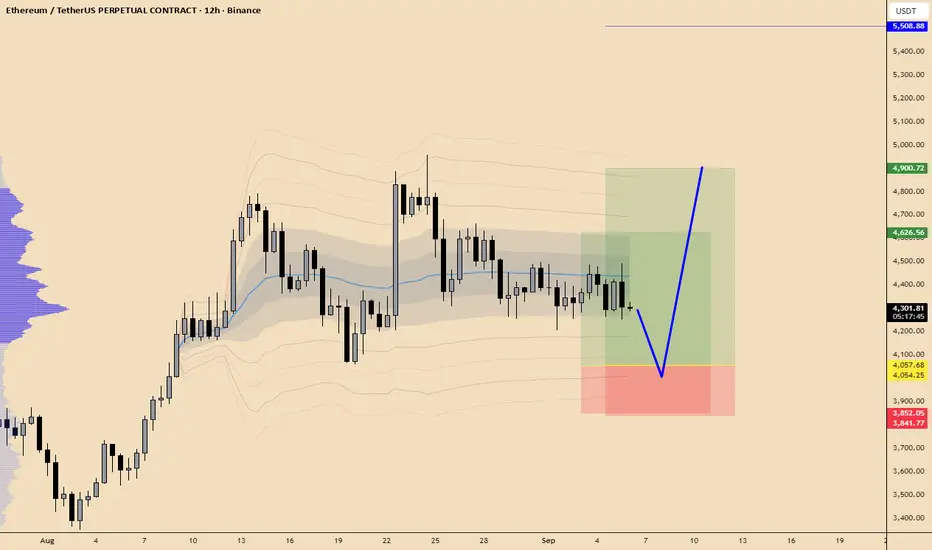
LONG ON ETHEREUMEthereum is coming from a major demand area after sweeping liquidity.
I am taking a buy limit order on ETH looking to catch price rising to the previous highs. Over 500-600 points.
ETH 1H Analysis - Key Triggers Ahead | Day 17💀 Hey , how's it going ? Come over here — Satoshi got something for you!
⏰ We’re analyzing BTC on the 1-Hour timeframe.
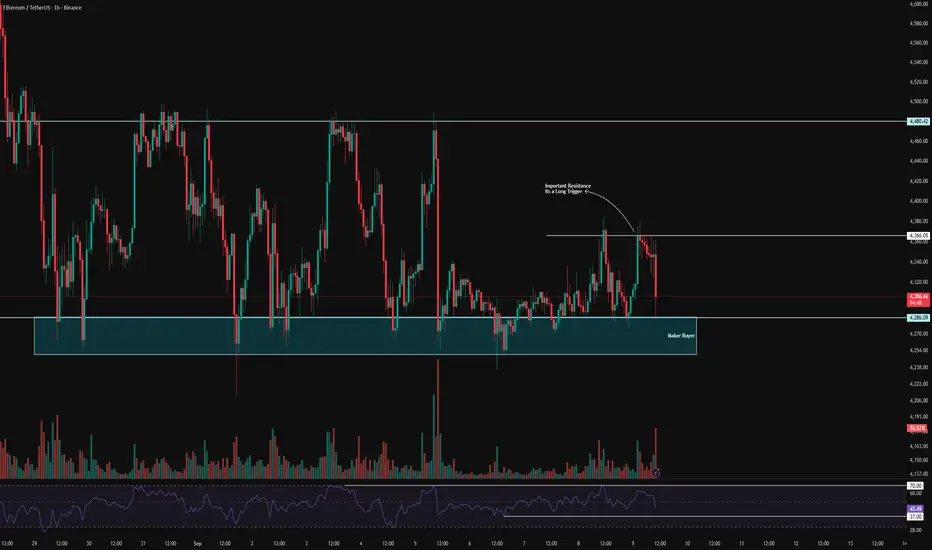
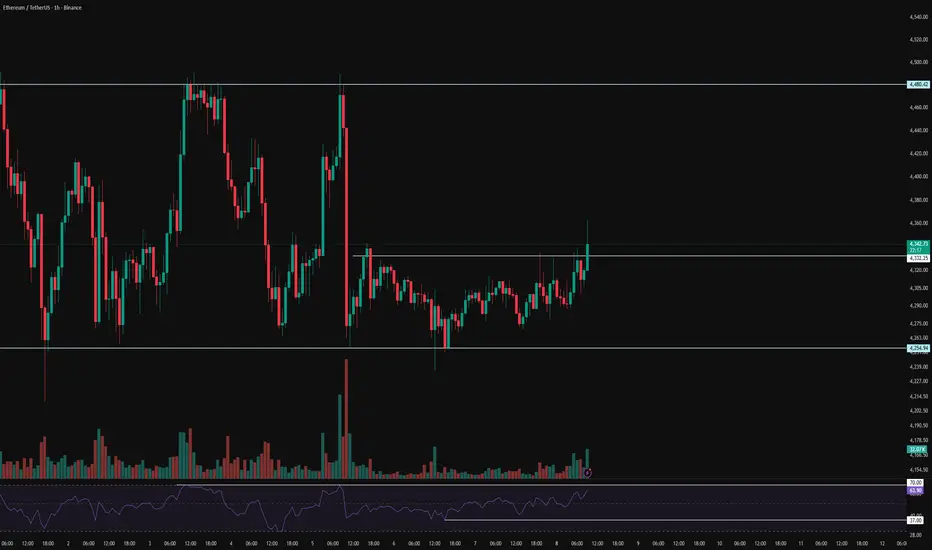
🔭 On the 1H timeframe for Ethereum (ETH), price rejected strongly from the 4336$ resistance and started moving lower. ETH is now trading close to its support zone at 4286$, having recently broken out of a consolidation range.
⛏ On the RSI, the key levels are 70 and 37. A move beyond these zones could trigger momentum toward either overbought or oversold conditions. Keep in mind that volatility is still closely tied to macroeconomic news.
💰 Candle structure shows increasing red candle size and volume, signaling stronger selling pressure. With ETH being heavily involved in both futures contracts and DeFi markets, much of this move reflects profit-taking and sell pressure at higher levels.
🪙 Looking at the ETHBTC pair on the 1H, the chart shows a steady downtrend within a compression zone. If ETH loses its current support, the pair could extend further down. The volatility index for this pair is sitting at 45.52, below the 50 zone, and with short positions picking up, ETH could face additional sell pressure.
💡 The current zone ETH is trading in looks like a maker-buy area, but likely to be broken by whale candles.
For short positions : The better setup would be to wait for a whale candle break, then enter on the pullback for higher win rate.
For long positions : A clean breakout above 4336$ would allow for an order stop-buy entry or a pullback + candlestick confirmation setup to get in long.
⚠️ Note: Today looks like a high-impact day with global shifts in play—trade with reduced risk.
❤️ Disclaimer : This analysis is purely based on my personal opinion and I only trade if the stated triggers are activated.
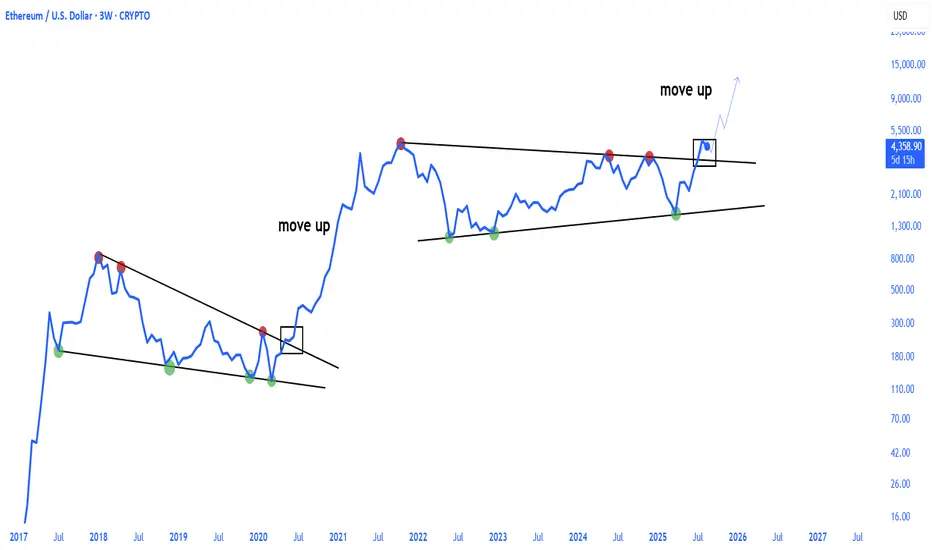
ETHUSD - Resistance Now SupportA major resistance that has pushed price down many times has been broken out from
The dotted line is the last line of defense for resistance
I doubt this dotted line will hodl and a further breakout will occur
This is the Weekly chart
Bullish
DOGE Swing Long Idea DOGE Game Plan
📊 Market Sentiment
Overall sentiment remains bullish, supported by expectations of a 0.25% rate cut in the upcoming FOMC meeting. A weakening USD and increasing global risk appetite are creating favorable conditions for further upside in crypto assets.
📈 Technical Analysis
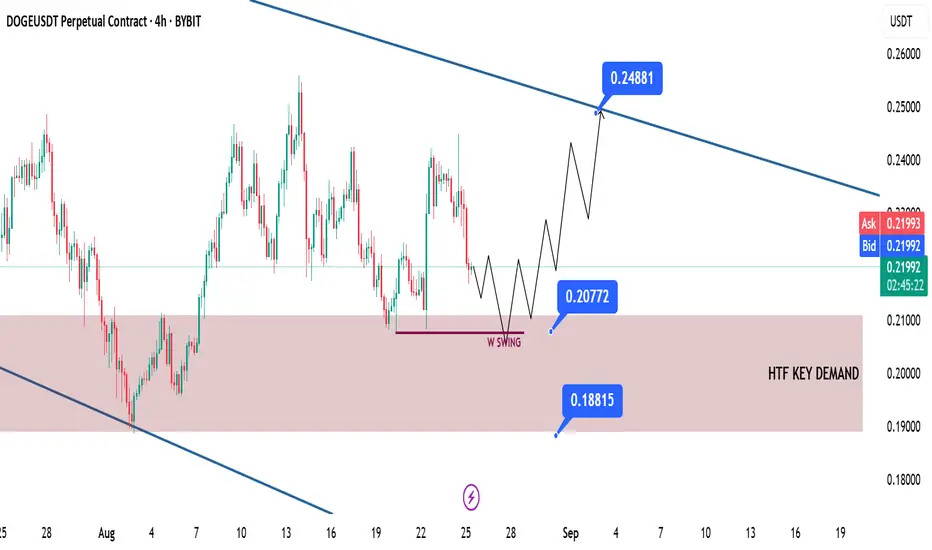
Price is retracing towards the HTF Demand zone, which I expect to act as a bounce area.
Moreover, price currently seems to be seeking liquidity to fuel its next bullish move. That liquidity could be the weekly swing low at $0.207.
📌 Game Plan
Wait for price to reach the HTF Demand zone.
Look for price to sweep liquidity and close back above the $0.207 level.
🎯 Setup Trigger
I will be waiting for a 4H market structure shift before entering the trade.
📋 Trade Management
Stoploss: Daily close below HTF support zone — $0.188
Target: $0.248
💬 Like, follow, and comment if you find this setup valuable!
⚠️ Disclaimer: This content is for informational and educational purposes only and does not constitute financial, investment, or trading advice. Always do your own research before making any financial decisions.
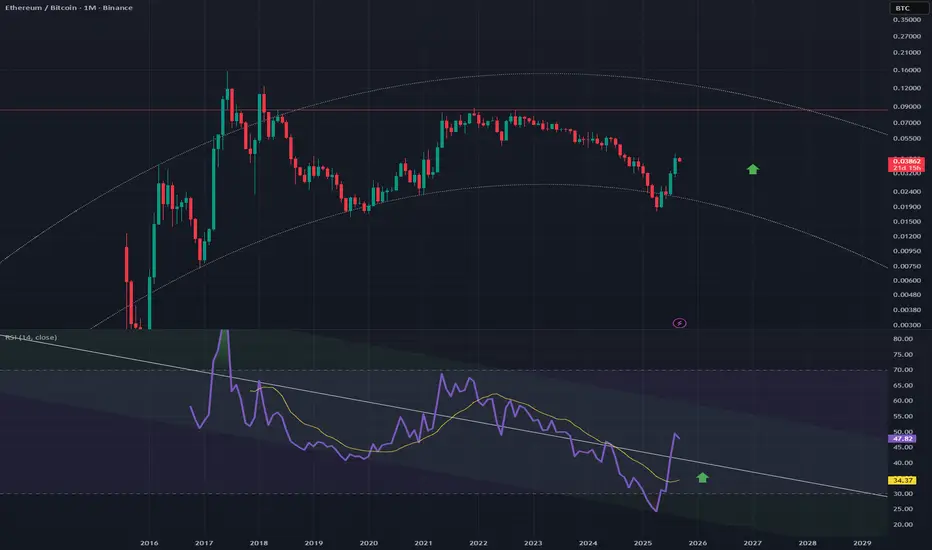
ETHBTC - Upward Movement Using this curved channel to show a target
This works well with the horizontal line at prior peaks
ETHBTC could move up to 0.08 - 0.10 as we head into a very strong alt season
The RSI also shows itself within a downward channel but support will be found at the middle line of the channel, allowing further movement up. Top of the channel being hit on the RSI is likely.
Very bullish on ETH.
Ethereum (ETHUSD) – Eyeing Next Leg Higher After Consolidation📌 Overview
Despite the vast number of cryptocurrencies in circulation, the majority lack real long-term utility. Ethereum (ETH) stands out as a foundational asset in the evolving digital infrastructure—powering smart contracts, DeFi, and Web3 development.
📈 Technical Outlook
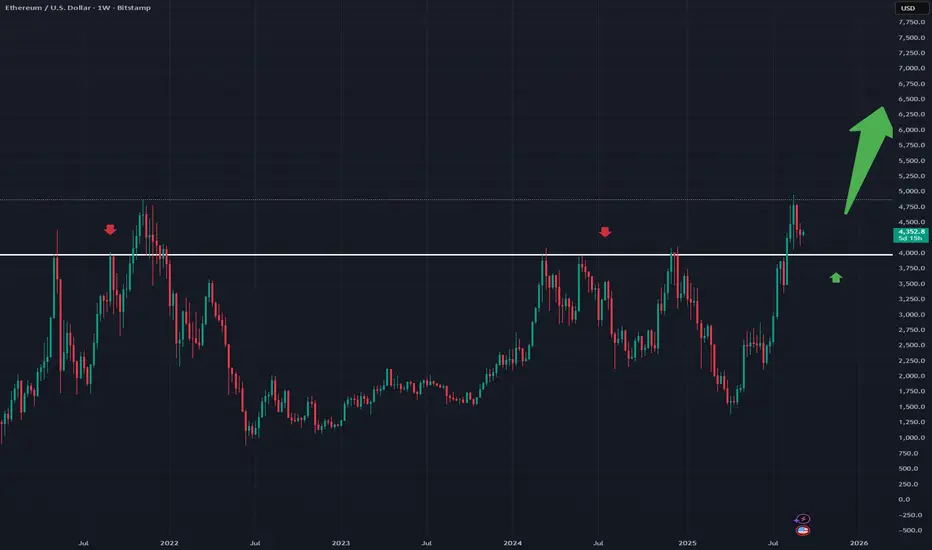
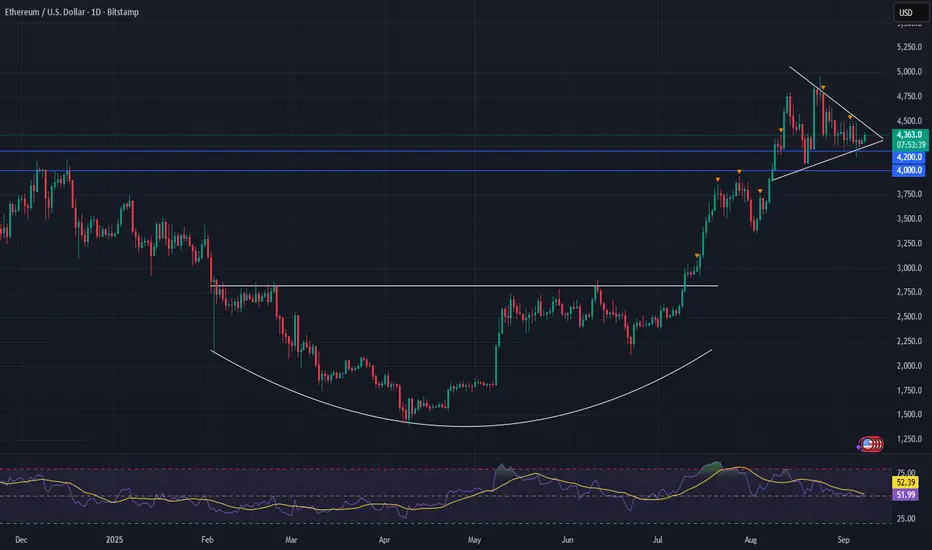
We’ve been tracking Ethereum closely for months and have actively participated in the ongoing rally. ETH is currently:
Holding above key support in the $4,000–$4,200 range (former resistance now turned support)
Consolidating within the $4,800–$5,000 resistance zone, near its previous all-time highs
We’re now observing the development of a symmetrical triangle pattern, which often precedes a continuation move.
🚀 Bullish Setup
Breakout above the upper triangle resistance could target the $5,700–$5,800 zone in the near term.
Our medium- to long-term target remains $7,000–$8,000, depending on market liquidity and macro conditions.
A confirmed breakout with strong volume could validate the next leg higher.
🔔 Key Levels to Watch
Support: $4,000 – $4,200
Resistance: $4,800 – $5,000
Short-term target: $5,700 – $5,800
Long-term target: $7,000 – $8,000
Ethereum - long at 4050 (range low)Ethereum - long at 4050 (range low)
Global trned on ETH is still UP
i think for some time price could stay in a range
that's why range low is a premium area for taking LONG trade
ETH 1H Analysis - Key Triggers Ahead | Day 16💀 Hey , how's it going ? Come over here — Satoshi got something for you!
⏰ We’re analyzing ETH on the 1-Hour timeframe.
🔭 On the 1H timeframe for Ethereum, we can see that ETH has broken through its resistance zone at $4332. A pullback and consolidation above this level could give us strong trading opportunities. From a multi-timeframe pattern perspective, ETH is still trading inside a larger box, with significant distance remaining to the box’s upper boundary. If ETH confirms this breakout, the next resistance level sits around $4480, and a break above that could push ETH outside of its current range.
⛏ The key RSI zones are 70 and 37. If momentum crosses above 70 into Overbought territory, ETH could continue its current bullish trend.
💰 The size and volume of recent green candles on ETH have been increasing, supported by strong buying. The compressed range structure built during the weekend has now been broken with higher buying volume and the clearing of sell orders. As long as open interest remains strong, ETH has room to move higher.
🪙 Looking at the ETH/BTC pair on the 1H timeframe, it faked out below the marked support level and is now pushing upward. The key resistance here is at 0.03883, and a confirmed breakout above this level could fuel further upside for ETH against USDT.
💡 Currently, Ethereum is sitting in a crucial zone. Multi-timeframe confirmation above this level could give us a clean long setup. The immediate resistance zone is $4332, while further resistance levels can be mapped out with a Fibonacci retracement.
❤️ Disclaimer : This analysis is purely based on my personal opinion and I only trade if the stated triggers are activated .
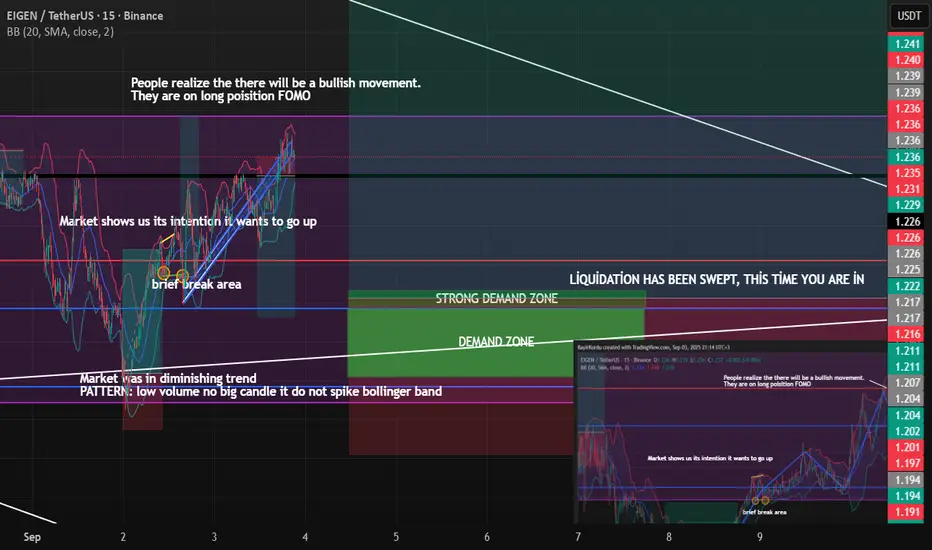
RALLY IS COMING!!!EIGEN will give you at least %25 in this month LOOK AT THE CHART AT THE BELOW one last liquidation and market will blast
I will go for this with lax stop loss if there will be strong bullish candle I thinl it wont be a manipulation. If not there will be a huge loss for me and I accept that
Always manage your own risk do not take this as a investment idea
YOU MAY NOT WANT TO WAIT TILL THE PRICE EXACTLY HIT YOUR ENTRY ORDER WATCH THE CHART.
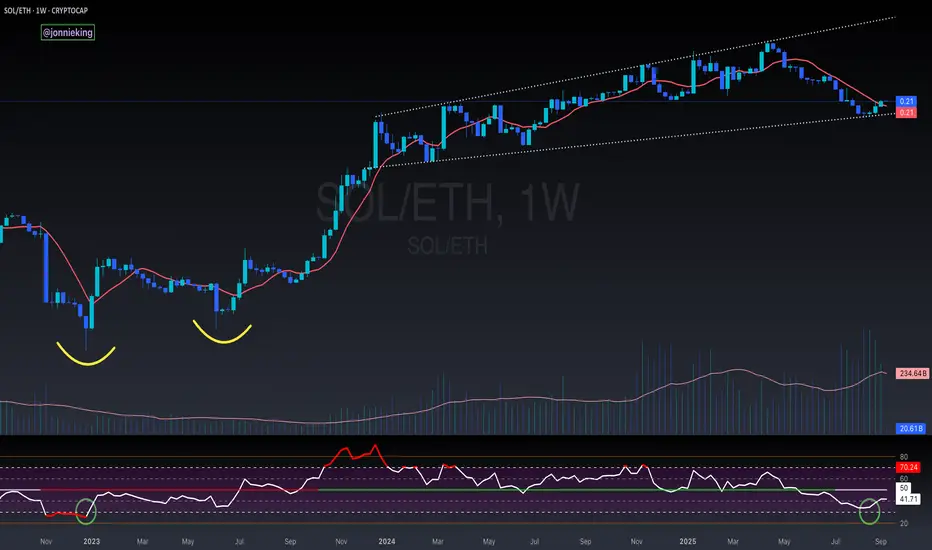
$SOL / $ETH REVERSAL * ALT SEASON *🚨 The CRYPTOCAP:SOL / CRYPTOCAP:ETH REVERSAL has officially been confirmed.
✅ 3 White Solders
✅ Weekly close above 9WMA
✅ Broadening Wedge
Money is moving down risk, which brings outsized returns.
BRIEFING Week #36 : Oil Prices Diverge from RealityHere's your weekly update ! Brought to you each weekend with years of track-record history..
Don't forget to hit the like/follow button if you feel like this post deserves it ;)
That's the best way to support me and help pushing this content to other users.
Kindly,
Phil

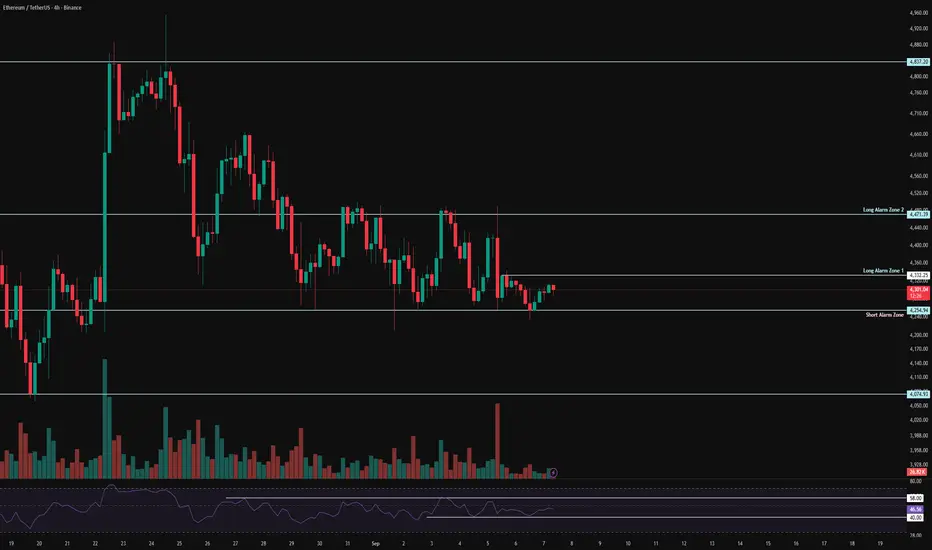
ETH 4H Analysis - Key Triggers Ahead | Day 15💀 Hey , how's it going ? Come over here — Satoshi got something for you !
⏰ We’re analyzing ETH on the 4-Hour timeframe .
🔭 On the 4-hour timeframe for Ethereum, we can see that ETH is currently moving inside a very strong box and is preparing for this week’s upcoming news. The resistance (ceiling) of this box sits at $4,471, while the support (floor) is around $4,254. Once either of these levels is broken, Ethereum could make a strong move after this long consolidation phase. There’s also an early trigger zone at $4,332; if ETH breaks and stabilizes above this level, we can consider entering a position toward the top of the box.
⛏ Key RSI levels for Ethereum are at 58 and 40. Breaking these ranges could signal the start of a strong move. With increased volatility, ETH could even push toward the overbought (OB) or oversold (OS) zones.
💰 Currently, the size and volume of candles have dropped significantly — something we often see during holiday sessions. But with the start of the new week and upcoming economic reports, Ethereum could generate bigger candles and stronger momentum once it breaks out of this box.
🪙 Looking at the ETHBTC pair on the 4-hour timeframe, the chart still looks bearish with decreasing volume. The current zone is considered a maker-buyer area, and we’ll need to watch how the whales react here. If this level is lost, Ethereum could face a deeper correction and move toward its lower support levels.
💡 Ethereum currently has 3 alarm zones:
A short alarm zone at the bottom of the box — if broken, it could trigger stronger selling pressure.
A long alarm zone #1 at $4,332, acting as an early trigger for a potential breakout toward the top.
A long alarm zone #2 at $4,471 — breaking and holding above this level could lead to a solid upward move.
❤️ Disclaimer : This analysis is purely based on my personal opinion and I only trade if the stated triggers are activated .
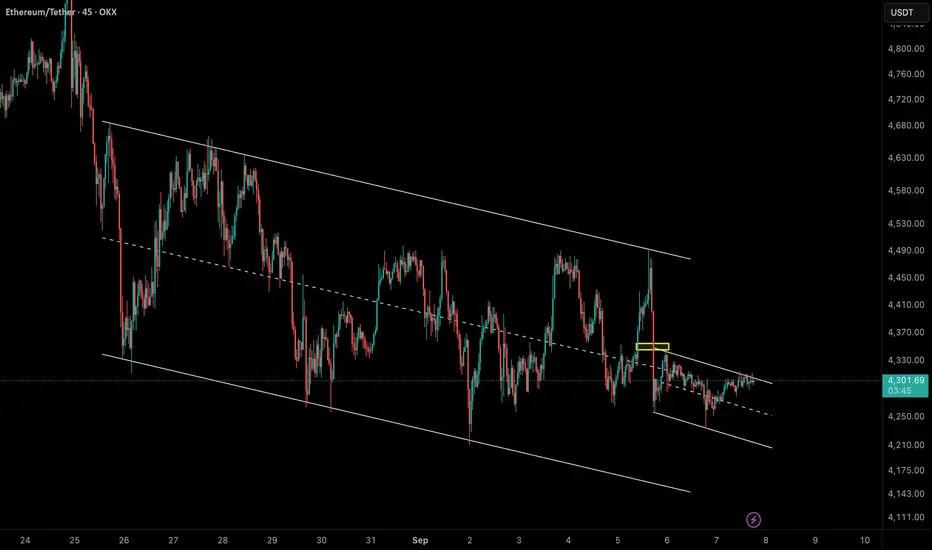
Ethereum (ETH/USDT) – Neowave UpdateEthereum continues to move inside a short-term descending channel. Based on the Neowave count, the current structure can be interpreted as wave G of a Diametric pattern.
🔑 Main Scenario:
• If ETH manages to hold above 4315, buyers could regain control.
• In that case, a move toward the channel’s upper boundary around 4410 is likely, completing wave G of the Diametric.
⚠️ Alternative Scenario:
• Failure to sustain above 4315 will keep the bearish tone intact.
• In this case, ETH may retest the lower boundary of the channel, with possible extensions toward 4200–4150.
📌 Conclusion:
Ethereum is at a decision point. A confirmed breakout above 4315 opens room for a rally to 4410, while rejection from this level could extend the corrective phase lower.
ETH - Good support levelsWell, about Ethereum , I should say:
The price could drop sharply,
but upon reaching the specified support levels, it recovers and moves upward.
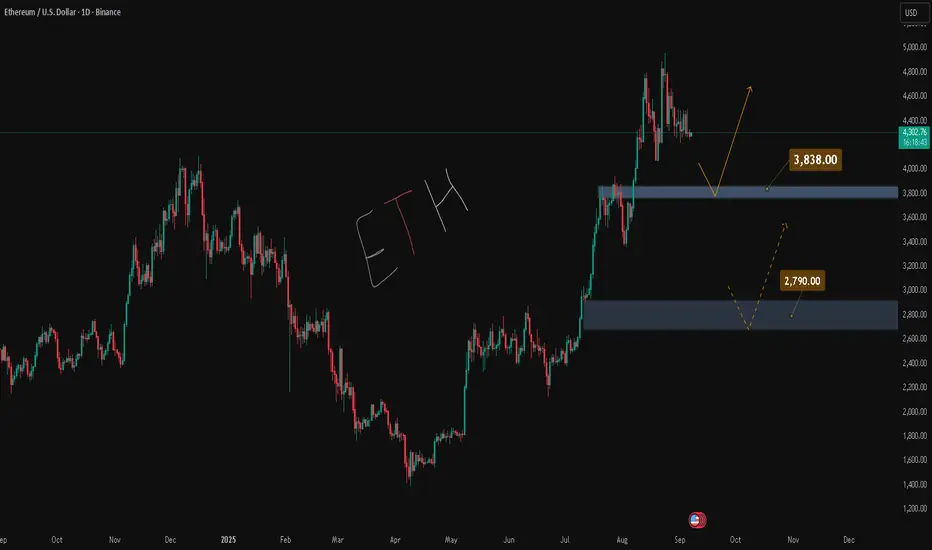
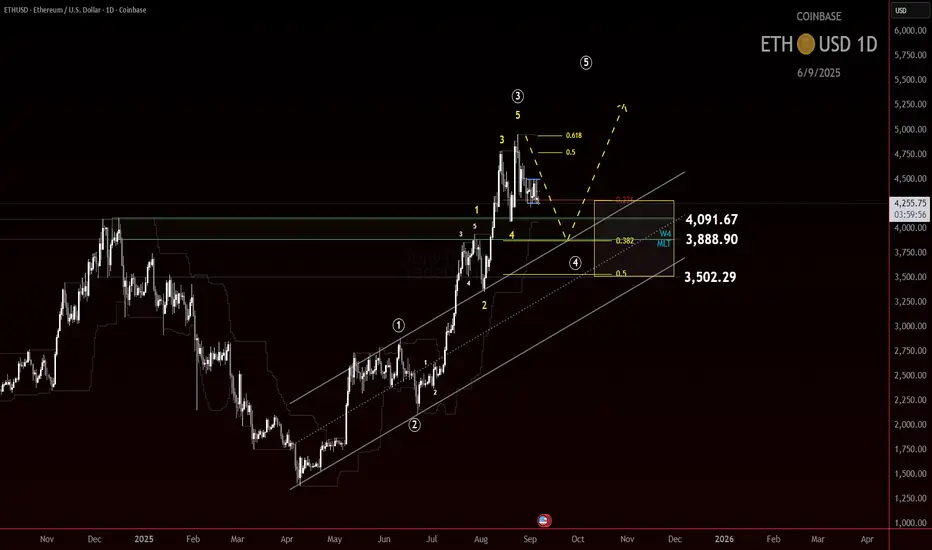
Eth to 4k!?Ethereum seems to be grinding through a corrective pullback, and the price action around 4K is shaping up to be the next major test. If this dip continues to unfold in a corrective fashion, the area of interest (AOI) and levels of interest (LOIs) shown on the chart are where I’ll be watching closely.
The wave count remains clean here. We’ve got confluence stacking around the 4K region, with support zones lining up against standard Fibonacci retracement levels. If price tags those areas while printing corrective structure, it keeps the bigger bullish roadmap intact.
On the upside, 4.5K is the level that keeps capping bulls. Ethereum’s failed attempts to break through highlight its strength as resistance. If price makes another push and finally clears that ceiling, I’d have to reassess whether I’ve leaned too bearish in this pullback. A decisive reclaim would show just how much momentum buyers have left in the tank.
Key Outlook:
4K region = next AOI for a corrective test
3,888 and 3,502 = deeper LOIs if selling pressure extends
4.5K break = potential shift back into aggressive bullish territory
For now, patience is key. If ETH prints corrective structure into these downside levels, the larger Elliott Wave framework still points toward a bullish continuation. But without a strong break above 4.5K, the market hasn’t proven the bulls are back in control....yet
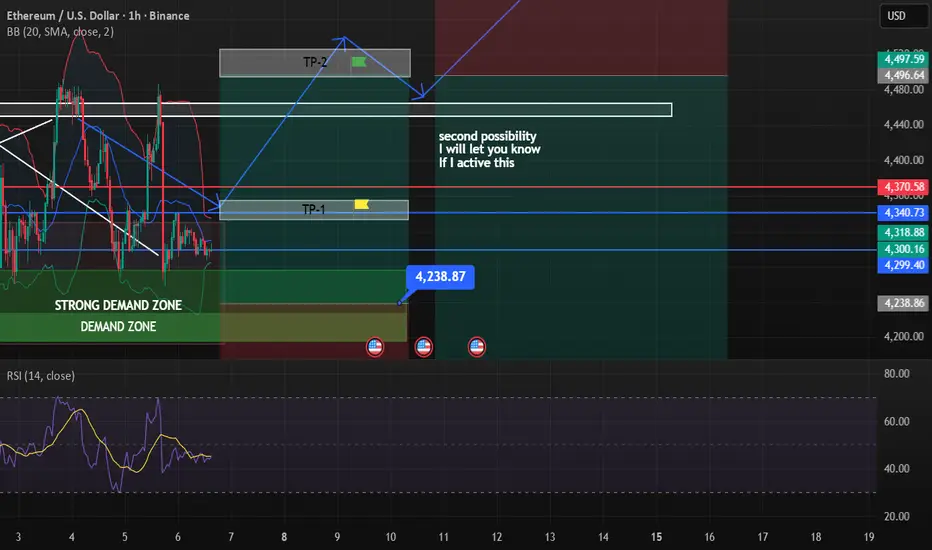
ETH UPDATEMy former analysis of ETH touch my support and resistance twice total %10 at least %5
But unfortunately it wasnt my path I expected direct and strong candles but we couldnt stay over the resistance and fall twice this may be sign for not the push my main target (red box)
Now we will see third one but if we fail again It wont be good for ETH. I will active my second order if I see weakness So you may want to close all your positions when we hit full target, after TP1 put stop loss to break even and wait this is your choice I will let you know for other uptades keep following
Always manage your own risks this is not a investment advise I am not responsible neither your loss nor profit.
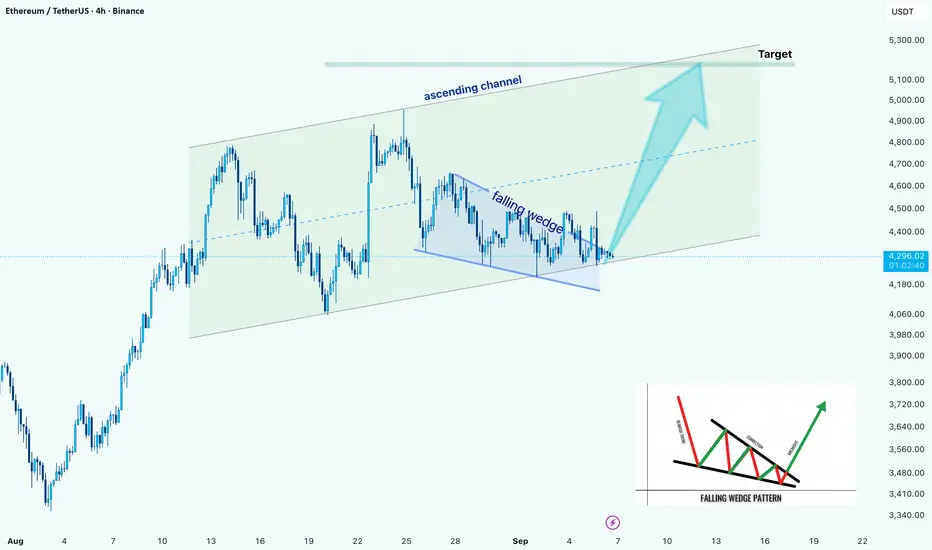
ETH/USD –> Falling Wedge Breakout Within Ascending ChannelHello guys!
Ethereum is showing a strong technical setup on the 4H chart. Price has been respecting an ascending channel since early August, and within this structure, a falling wedge has recently formed.
Right now, ETH is testing the wedge breakout point near the bottom line of the channel. If buyers manage to hold momentum here, we could see price extending toward the channel’s upper boundary, with the next major target sitting around $5,100 – $5,300.
On the downside, failure to sustain above the wedge support may lead to a retest of the lower channel trendline around $4,100 – $4,150, which remains a critical support area for bulls to defend.