ETH | Long Idea - All time highs soonETH | Long Idea
📊 Market Sentiment
Overall sentiment remains bullish, supported by expectations of a 0.25% rate cut in the upcoming FOMC meeting. A weakening USD and increasing global risk appetite are creating favorable conditions for further upside in crypto assets.
Ethereum is approaching all-time highs, fueled by a $1B single-day ETF inflow. Additionally, rumors of potential SEC approval for Ethereum staking policy could directly boost ETH’s utility — strengthening the long bias.
📈 Technical Analysis
Price is climbing steadily after sweeping LTF liquidity.
Retracements have been shallow due to strong momentum and market hype.
All-time highs are now clearly an institutional / smart money target.
📌 Game Plan
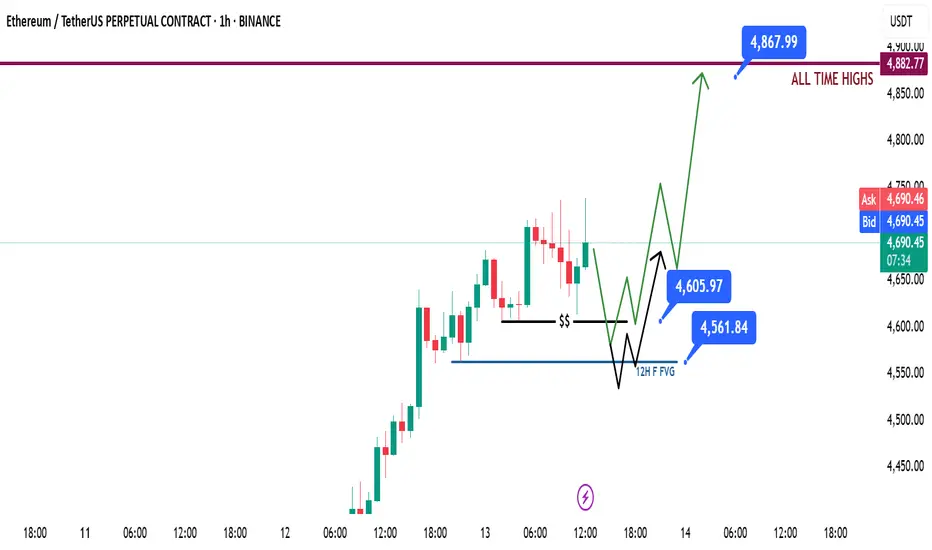
Watch for a sweep of 1H swing lows / equal lows at $4,605 followed by a bullish rejection.
Alternatively, 12H FVG at $4,561 could be taken before rejection — both liquidity runs are valid watchpoints.
🎯 Setup Trigger
Look for a 1H break of structure after liquidity grabs at the mentioned levels.
📋 Trade Management
Stoploss: 1H swing low that confirms the break of structure.
Target: Direct move towards all-time highs at $4,868.
💬 Like, follow, and comment if you find this setup valuable!
D-ETH
ETHFI | Swing Long Idea - AltcoinETHFI | Swing Long Idea
📊 Market Sentiment
Overall sentiment remains bullish, supported by expectations of a 0.25% rate cut in the upcoming FOMC meeting. A weakening USD and increased global risk appetite are creating favorable conditions for further upside in crypto assets.
ETHFI moves in close correlation with Ethereum’s price action. As ETH approaches all-time highs, fueled by a $1B single-day ETF inflow, ETHFI is also showing strong bullish potential.
Additionally, rumors about possible SEC approval of Ethereum staking policy could significantly increase ETHFI’s utility in the future — adding conviction to a long bias.
📈 Technical Analysis
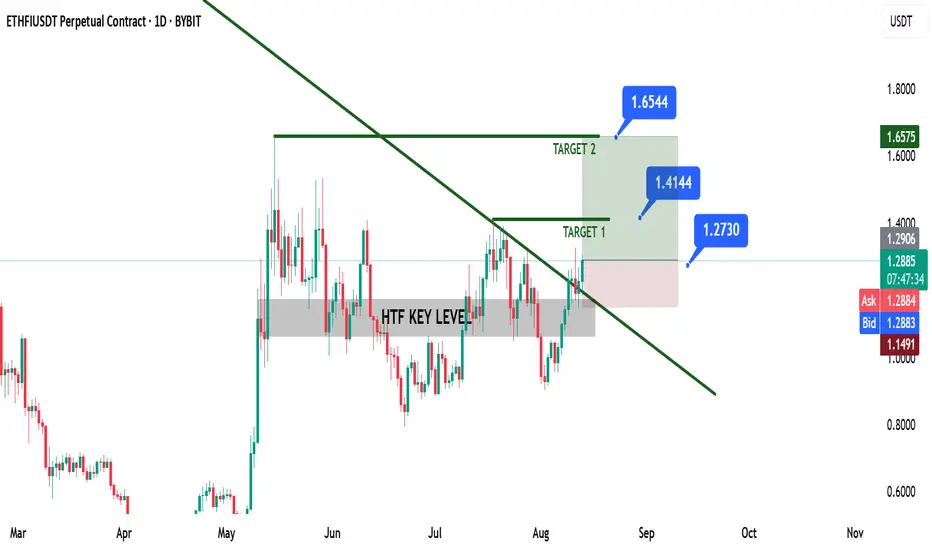
Price broke a HTF key resistance and closed above.
The retest of this level confirmed it as strong support.
Price also broke the HTF bearish trendline, followed by a successful retest and bullish rejection.
📌 Game Plan
Long position entered at $1.2730 after rejection from the retest of the broken bearish trendline.
📋 Trade Management
Stoploss: Daily close below $1.14
Targets:
TP1: $1.41
TP2: $1.65
Trail stops aggressively to lock in profits as price moves favorably.
💬 Like, follow, and comment if you find this setup valuable!
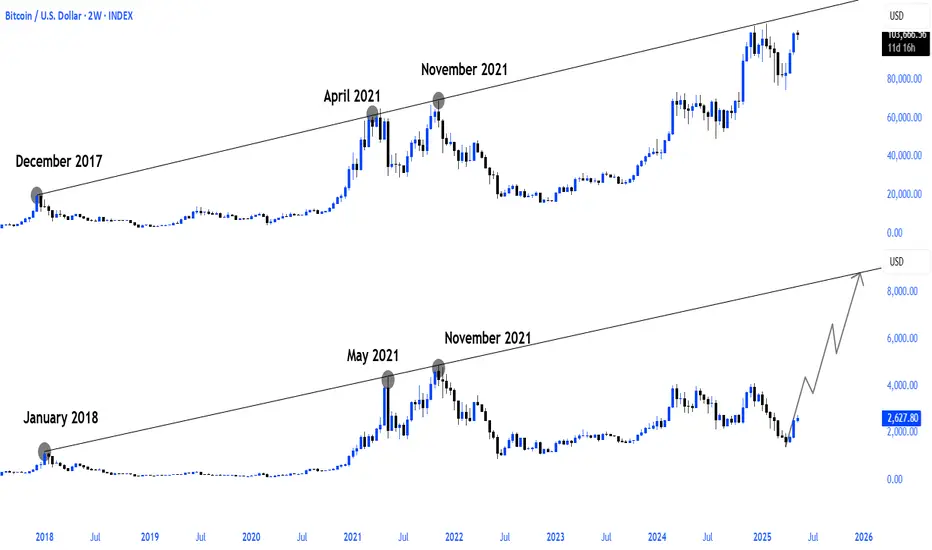
Bitcoin vs Ethereum | 15-20k$ ETH? same chart, same psychology .
- after bullrun price dropped ~80%, we have a bottom
- recovery to resistance level
- retesting the bottom cycle with breaking news
The chart shows the same price psychology.

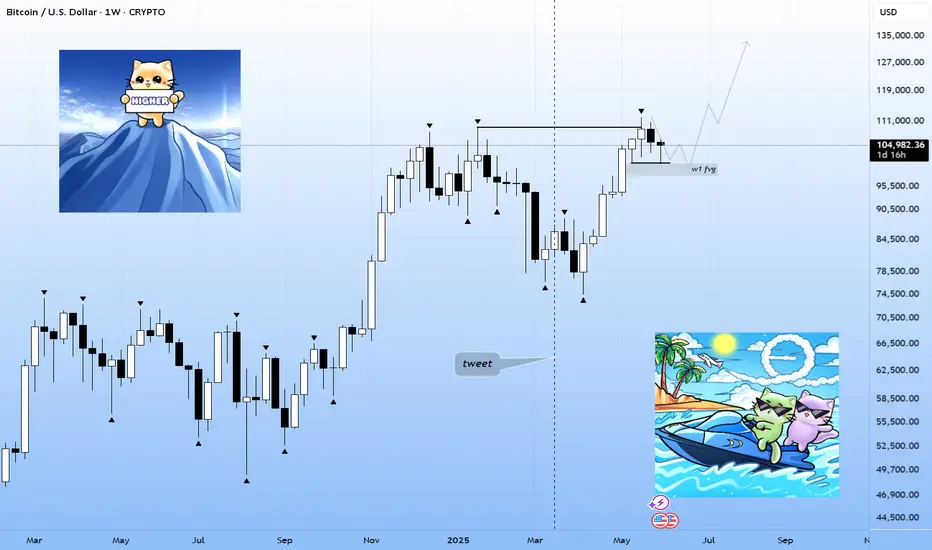
BTC re-accumulation and >140k$The year started from manipulation on CRYPTOCAP:BTC and the whole crypto market after Trump's tariff announcement.
Since the start of the summer season, we've already seen another manipulation between Trump and Elon Musk.
On BTC I see weekly FVG and good pinbar candle. I guess we have already entered to consolidaton and summer will also consolidation, but starting from august we will see the final uptrend with euphoria which can finish on October nearly 241.000$ on BTC, but let's see it later
I think this period will be light with base summer and $MOCHI because it's a memecoin which holds the bottom well , when in that time another altcoins are making another bottom
btc vs. ethBitcoin vs. Ethereum 🔃
It is obvious that Ethereum has not yet made a real run compared to other cycles compared to Bitcoin, and I think that the current correlation gap will close in the coming period.
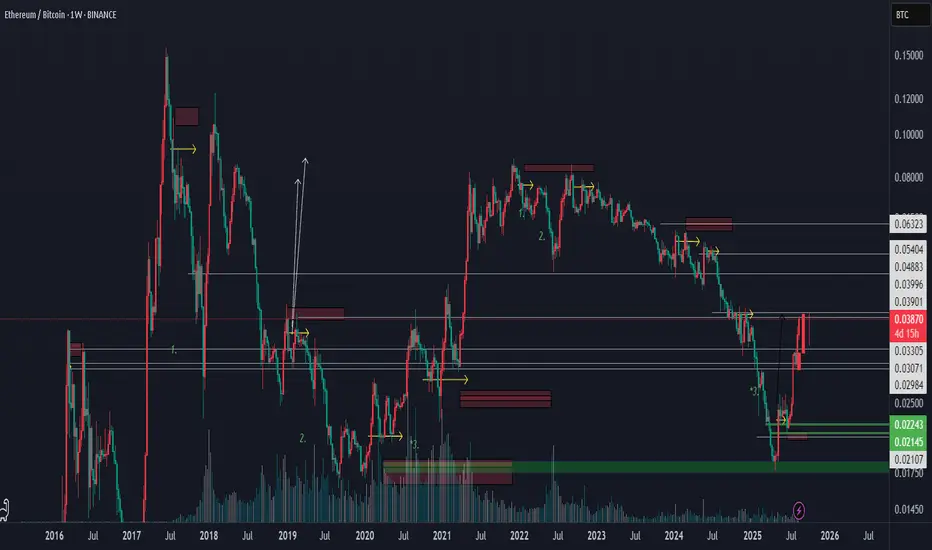
ethbtc [W] - 2019 shelf retest & long exit (April to Aug 25)So we've had a pretty eventful 2025 so far for eth . For most wanting to know why eth moves have been so aggressive and to quote an old mentor "Gung-Ho", all we need to do really is take a look at ETHBTC.
Historically alts have had their moments in relation to their strength (or weakness) against bitcoin. this time is no different.
To key my chart, the yellow lines show the point of control or gain/failure for any given local spot. the red and green bands are by extension a couple of points above or below that mark. These bands represent 'slippage' or liquidity points provided by either algo (standard deviations), stop losses and failure of trend.
To be fair the size of the band is relative to the volatility of the underlining pair. In this example i believe it should fall within the 3.2-->13.6% range. enough to liquidate or margin call all positions from 20x to 5x. This represents the majority of open interest in any given point.
My goal is always to observe the point of control and look to rebound from these initial liquidity hunts. April 2025 gave us this opportunity and cleared the bench. For those late to the party the market offered us a juicy little v-bottom setup. from there on you had exits all the way up to the liquidity band sitting just above the support shelf created all the way back in 2019.
By no means am I claiming the move is 100% done, but if you check volume, I'd say 80%+ has exited, and so am I.
NEXT: rotate back into BTC primarily and watch.
Sentiments not all that great in the real world, but at least this move has some definitive-ness to it. Peace out
#btc #eth #ethbtc #2025 #alt #mstr #goingup-goingup
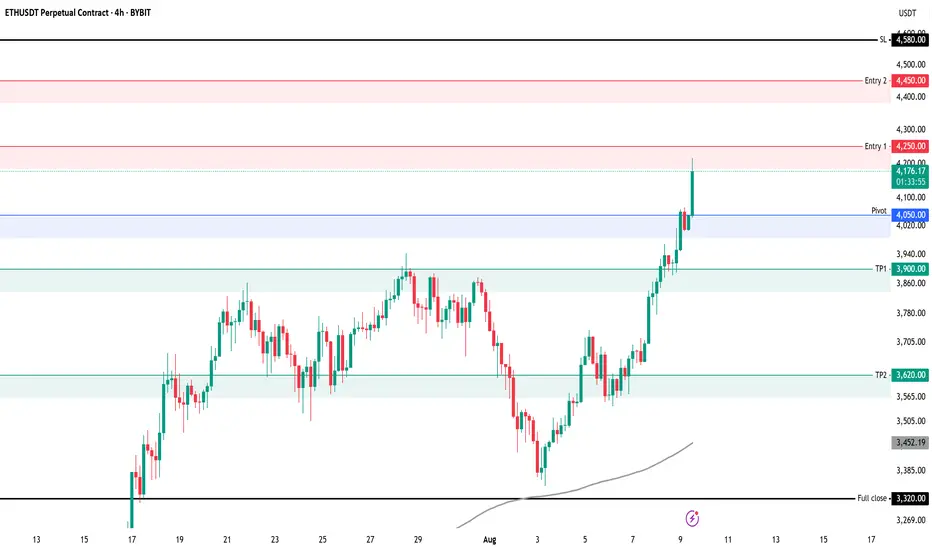
ETHUSDT ShortThese are the key areas we are looking for on ETH 4H
Risk per entry 0.25%
Entry 1: 4250
Entry 2: 4450
TP 1: 3900 or Pivot 4050
TP 2: 3620
Full TP: 3320
SL: 4580
Always manage your own risk. None of the above is financial advice.
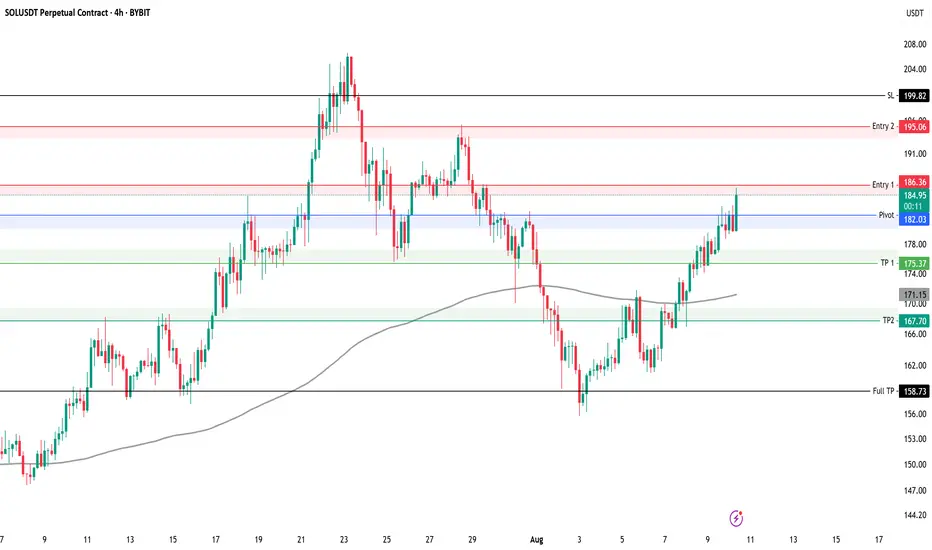
SOLUSDT Short Key levels to watch for SOLUSDT 4H
We have taken first entry on this setup using 0.5% risk
Risk per entry 0.5%
Entry 1: 186
Entry 2: 195
TP 1: 175
TP 2: 167
Full TP: 158
SL: 199
Always manage your own risk. None of the above is financial advice.
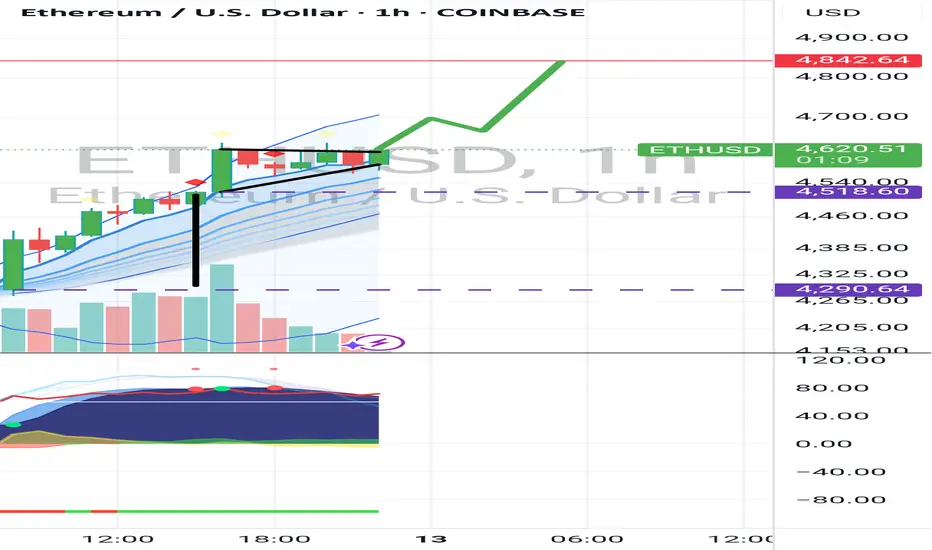
Bullish pennant forming on 1hr?ETH/USD appears to be forming a bullish pennant on the 1H chart following a strong impulsive run from $4,290.64 to $4,518.60. The consolidation is converging toward the apex with declining volume, consistent with continuation pattern behavior.
Breakout Projection :
Pole height : $227.96
Estimated breakout point : ~$4,622
Target : ~$4,842
Invalidation : Breakdown below the lower pennant trendline with strong volume before breakout would invalidate the bullish pennant thesis.
This is not financial advice. It is merely an observation of an optimistic apparent pattern formation. Always do your own research and assess your own risk tolerance before making any trades.
LDO Coin | Swing Long IdeaLDO | Swing Long Idea
📊 Market Sentiment
Overall sentiment remains bullish, supported by expectations of a 0.25% rate cut in the upcoming FOMC meeting. A weakening USD and increased risk appetite across global markets continue to create favorable conditions for further upside in crypto assets.
LDO is closely correlated with Ethereum’s price action. As ETH approaches all-time highs, fueled by a $1B single-day ETF inflow, LDO is also showing strong upside potential.
Additionally, market rumors suggest that the SEC may approve Ethereum staking policy soon — a move that would directly increase the utility of LDO in the future. This adds strong conviction to a long bias.
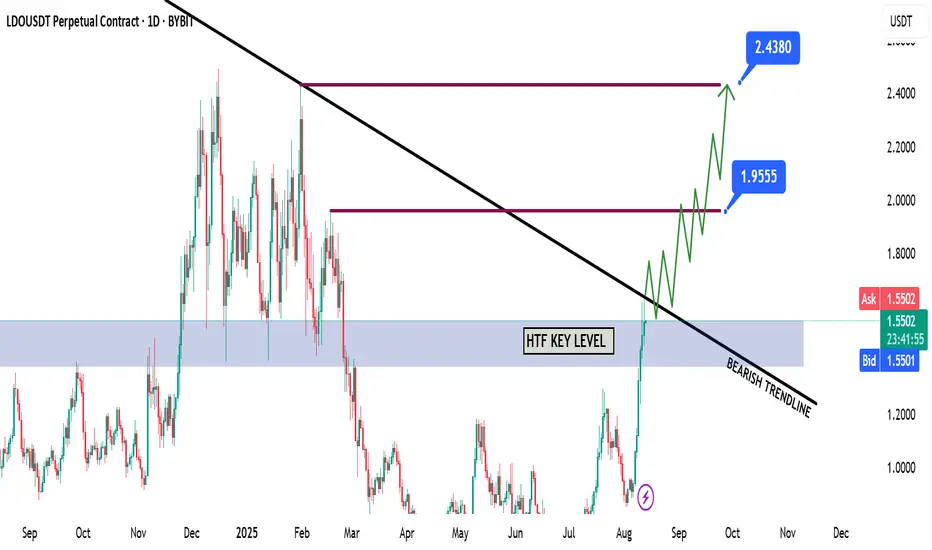
📈 Technical Analysis
Price has gained strong momentum alongside Ethereum’s bullish run.
We are approaching a HTF bearish trendline that has capped price for a while.
A breakout and close above this level would be a significant bullish signal.
📌 Game Plan
Wait for a clean break and close above the HTF bearish trendline.
Look for long entries on a retest of the breakout level.
🎯 Setup Trigger
After retest, wait for a 4H break of structure to confirm bullish continuation.
📋 Trade Management
Stoploss: 4H swing low that caused the break of structure
Targets:
TP1: $1.95
TP2: $2.43
Trail stops to secure profits as price moves in favor.
💬 Like, follow, and comment if you find this setup valuable!
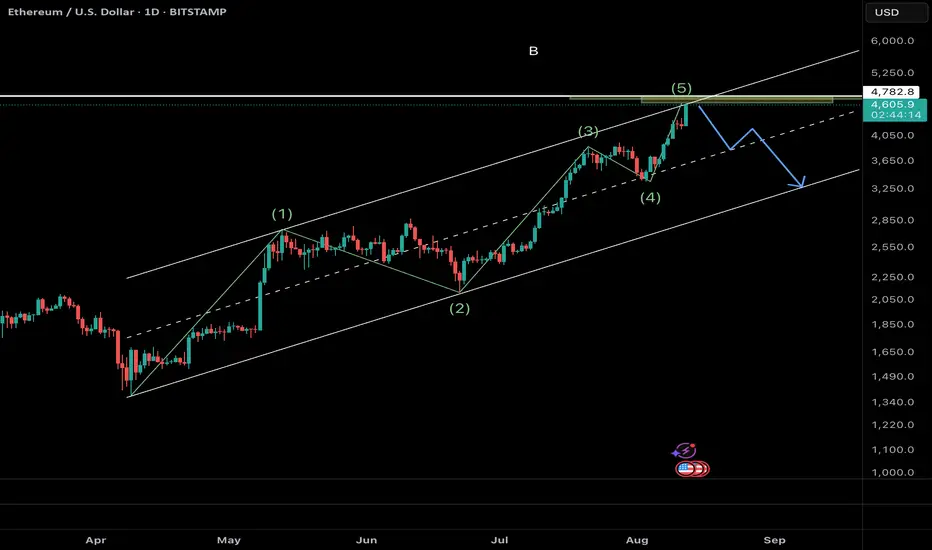
Ethereum (ETH/USD) – Elliott Wave AnalysisThe current price structure suggests that Ethereum is completing the final stages of a 5-wave impulsive advance, with the market now positioned in wave 5 of 5. Price action has reached the upper boundary of the ascending channel, coinciding with a key Fibonacci projection zone (green resistance area), which aligns with typical wave 5 termination points.
Given this confluence, the probability of a medium-to-long-term top forming here is elevated. Once wave 5 completes, a corrective phase is expected, potentially retracing towards the midline or lower boundary of the channel. The projected path (blue arrows) anticipates a significant decline, consistent with the completion of a full impulsive cycle.
Key Points:
• Structure: Impulse wave (5 of 5) nearing completion
• Confluence: Channel resistance + Fibonacci projection zone
• Outlook: High probability of reversal and corrective decline
• Targets: First support near $3,650, with deeper retracements possible toward $3,000–$2,800 if bearish momentum accelerates
This suggests caution for late long entries, as risk/reward now favors a corrective move.
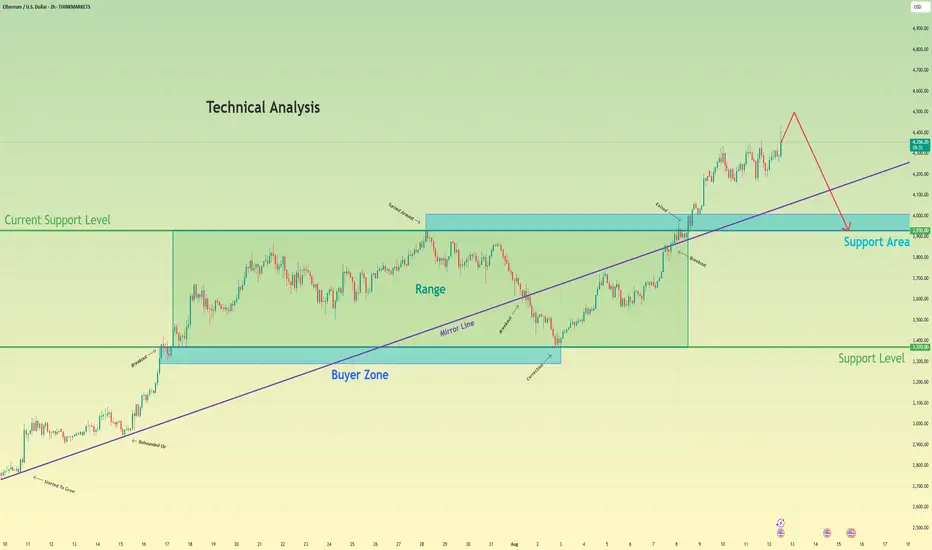
Ethereum will rise a little and then drop to support levelHello traders, I want share with you my opinion about Ethereum. Following a sustained upward trend, Ethereum entered a prolonged consolidation phase, forming a wide range between the buyer zone near 3370 and local resistance. Throughout this period, a key ascending mirror line provided consistent support, underpinning the bullish market structure and allowing for accumulation before the next major move. Recently, a decisive breakout from the top of this range occurred, propelling the asset to a new local extremum and confirming the strength of the buyers. However, the price action following this breakout has shown signs of potential exhaustion, with momentum appearing to wane at these elevated levels. The primary working hypothesis is a short, corrective scenario, which anticipates that after a potential final push to a new high, the price will undergo a sharp reversal. A key component of this thesis is the expected break of the main ascending mirror line, an event that would signal a significant shift in short-term market dynamics and confirm that sellers are taking control. Therefore, the tp for this anticipated downward move is logically placed at the 3930 level. Please share this idea with your friends and click Boost 🚀
Disclaimer: As part of ThinkMarkets’ Influencer Program, I am sponsored to share and publish their charts in my analysis.
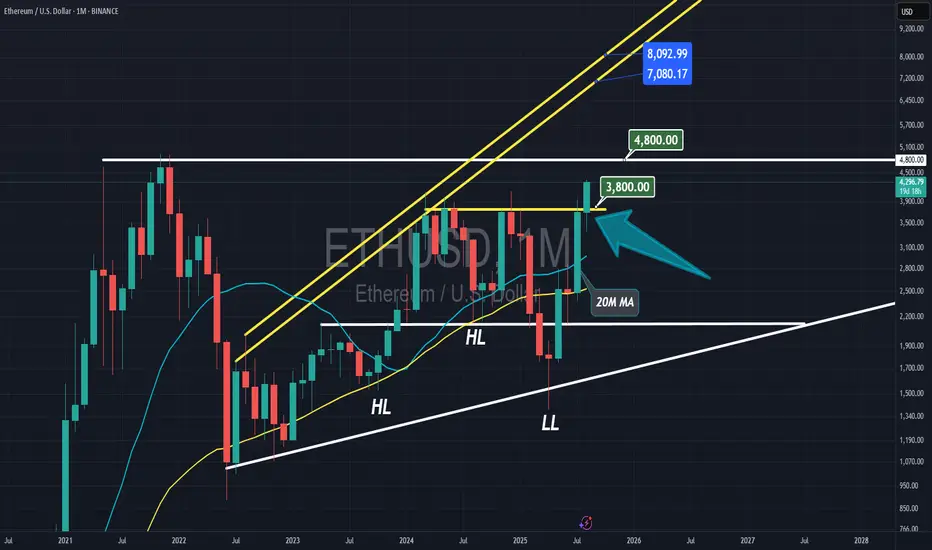
ETHEREUM MonthlyEthereum broke out past the $3,800 resistance on the monthly chart and is approaching its $4,800 all-time high. In August, we may see a breakout above this high.
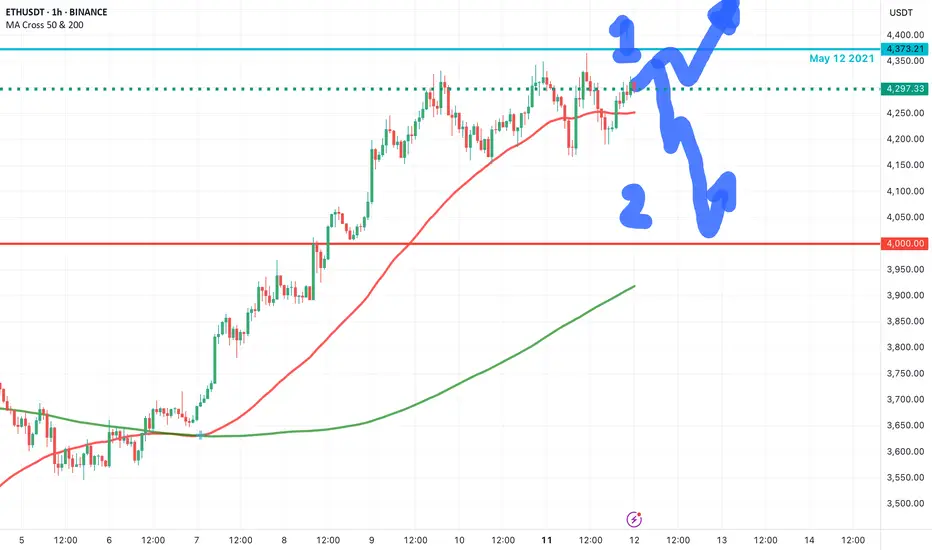
ETH at 4.5 yr resistance. Whats next ??1) if it brakes resistance it goes to $5k sooner
2) if it gets rejected at resistance it goes to $5k later
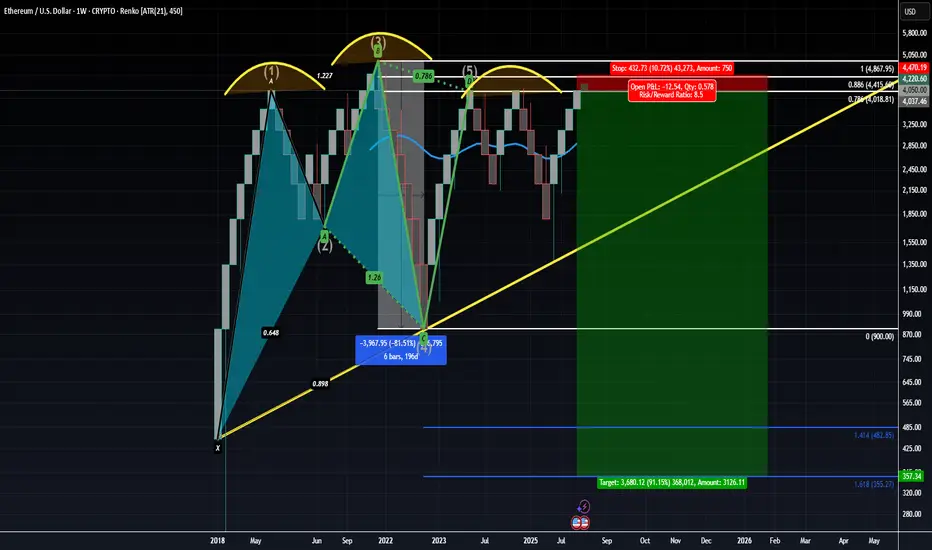
Ethereum Struggles to Complete above the 0.786 Bearish 5-0 ZoneWhile on the intra-bar price action on ETH has gotten pretty excited above the 0.786 it is still worth considering that ETH has not completed any bars above the 0.786 since the breakout and that at a moments noticed much of the current price action above the main 0.786 PCZ could later find itself being filtered out of the Renko charts as a whole depending on how many Average True Ranges above the 0.786 PCZ ETH possible move.
Based on the fact that the current candle is simply still in the projection phase I'd caution longs here and remain accumulative of longer dated puts. There is also a 2x leveraged ETF of ETH called ETHU which has OTM monthly call options trading at 20-40 dollar premiums. I'd consider farming off of those premiums in the form of Bear Vertical Spreads as a way to hedge off the costs of holding the long puts.
Overall, we are still trading at the PCZ of the Bearish 5-0 which seems to also be in the similar shape of a Bearish Head and Shoulders pattern; the measure move of which could take ETH down to around $355 upon the break of $1,600
#ETH #ETHUSDT #ETHEREUM #LONG #SWING #Analysis #Setup #Eddy#ETH #ETHUSDT #ETHEREUM #LONG #SWING #Analysis #Setup #Eddy
ETHUSDT.P Swing Long Analysis & Setup
Important area of the upper time frame for swing are identified and named.
This setup is based on a combination of different styles, including the volume style with the ict style.
Based on your strategy and style, get the necessary confirmations for this Swing Setup to enter the trade.
Don't forget risk and capital management.
The entry point, take profit point, and stop loss point are indicated on the chart along with their amounts.
The responsibility for the transaction is yours and I have no responsibility for not observing your risk and capital management.
🗒 Note: The price can go much higher than the second target, and there is a possibility of a 500% pump on this currency. By observing risk and capital management, obtaining the necessary approvals, and saving profits in the targets, you can keep it for the pump.
⚠️ Warning : The stop loss is dramatic and large. Place the stop loss based on your strategy and after getting entry and confirmation on the entry point behind the last shadow that will be created. (( This is just my opinion and is not meant to be 100% correct, so be careful with your capital. ))
Spot Investing : ((long 'buy' position)) :
🟢 Entry 1 : 1800
🟢 Entry 2 : 1500
First entry point calculations :
⚪️ SL : 1370 ((23.89%))
⚫️ TP1 : 4500 ((150%))
⚫️ TP2 : 5000 ((177.78%))
⚫️ TP3 : 8000 ((344.44%))
⚫️ TP4 : 10000 ((455.56%))
‼️ Futures Trading Suggested Leverages : 3-5-7
The World Let it be Remembered...
Dr. #Eddy Sunshine
4/4/2025
Be successful and profitable.
Do you remember my first Ethereum swing long signal?
My first swing long signal was provided on Ethereum, which was spot pumped by more than 100% and was profitable :

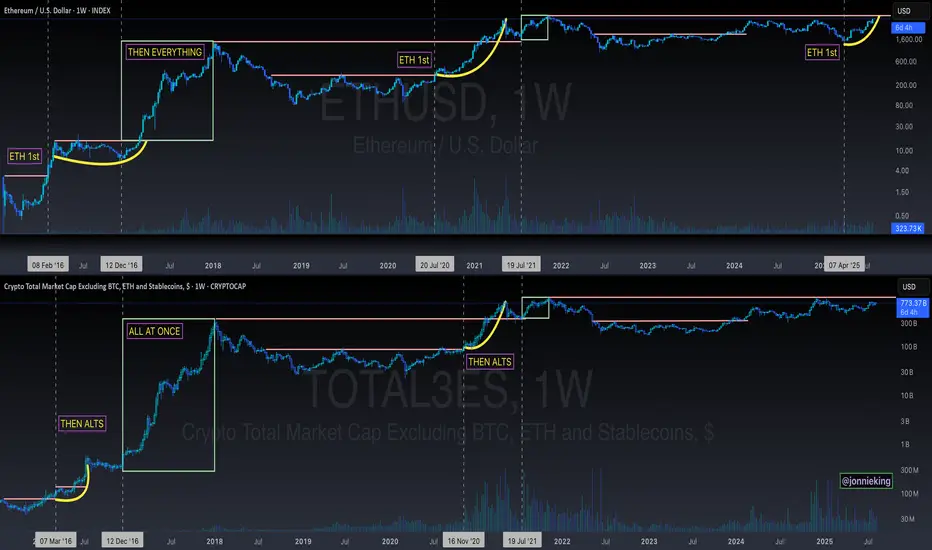
ETH > Alt Season Historical LookTHE STAGES OF ALT SEASON
ETH > Alts > market collectively corrects > Everything All Together
Alts are gonna absolutely rip your face off once ETH convincingly breaks its ATH.
SUI | SUI Network Swing Long IdeaSUI | Swing Long Idea
📊 Market Sentiment
Overall sentiment remains bullish, supported by expectations of a 0.25% rate cut in the upcoming FOMC meeting. A weakening USD and increased risk appetite across global markets are creating favorable conditions for further upside in crypto assets.
However, tomorrow’s CPI data is a key risk event for markets. It will be released at 08:30 AM NY local time, and could cause notable volatility across risk assets.
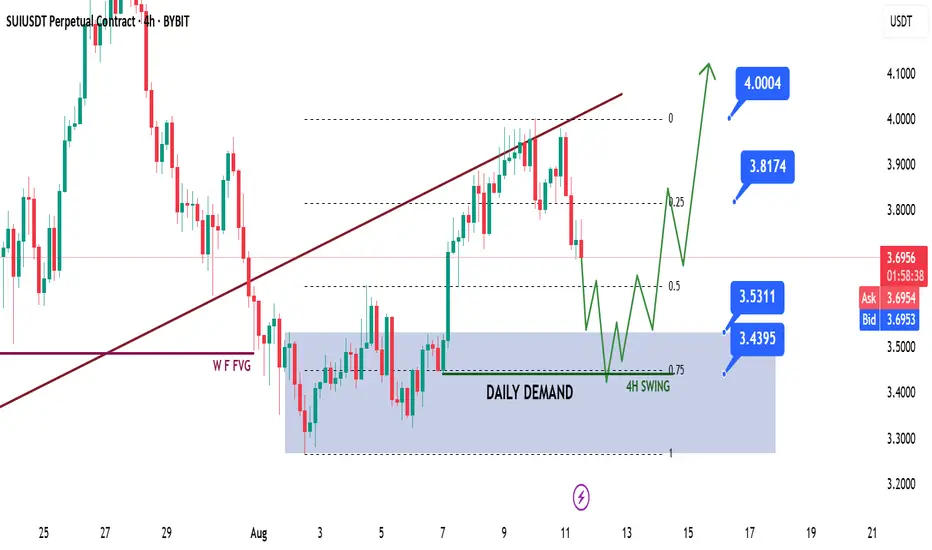
📈 Technical Analysis
Price began a retracement after a strong bullish expansion.
The move deepened following a break of the bullish trendline.
Price bounced from the Weekly Fair Value Gap (W-FVG) and retested the broken trendline, only to face rejection again.
This suggests price may still want to head lower to collect liquidity before continuing higher.
📌 Game Plan
Primary watch level: Daily demand zone (blue box) at $3.53.
This level could be enough to spark continuation higher, but ideally I’d like to see the 4H swing liquidity at $3.44 taken out first to strengthen the setup.
🎯 Setup Trigger
Wait for a 4H break of structure after the game plan levels are met.
📋 Trade Management
Stoploss: 4H swing low that caused the break of structure
Targets:
TP1: $3.81
TP2: $4.00
TP3: $4.44
Will trail stops aggressively to secure profits as the trade moves in my favor.
💬 Like, follow, and comment if this breakdown supports your trading! More setups and market insights coming soon — stay connected!
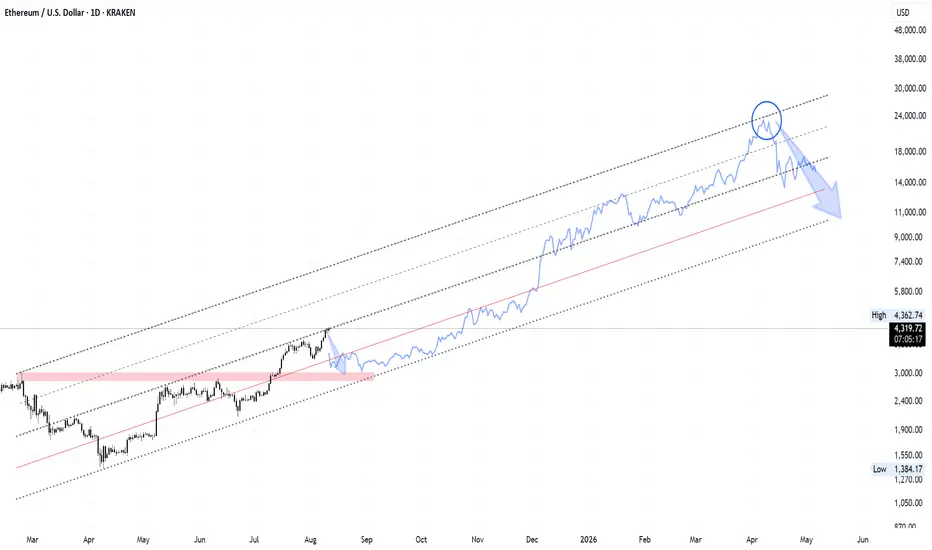
ETH ROAD TO 20K+I think we are getting closer to the final accumulation stage on ETH.
We can see a potential shape of huge channel in log scale.
After forming median of the channel I would like to see a big and fast correction near 30% from here towards 2900 support which must hold imo.
After that test of smthg around 3600 rgion and double bottom would be the best option just before few months of consolidation before breaking up and starting blow off top part.
Top of that channel depends on timing so the later the better I guess.
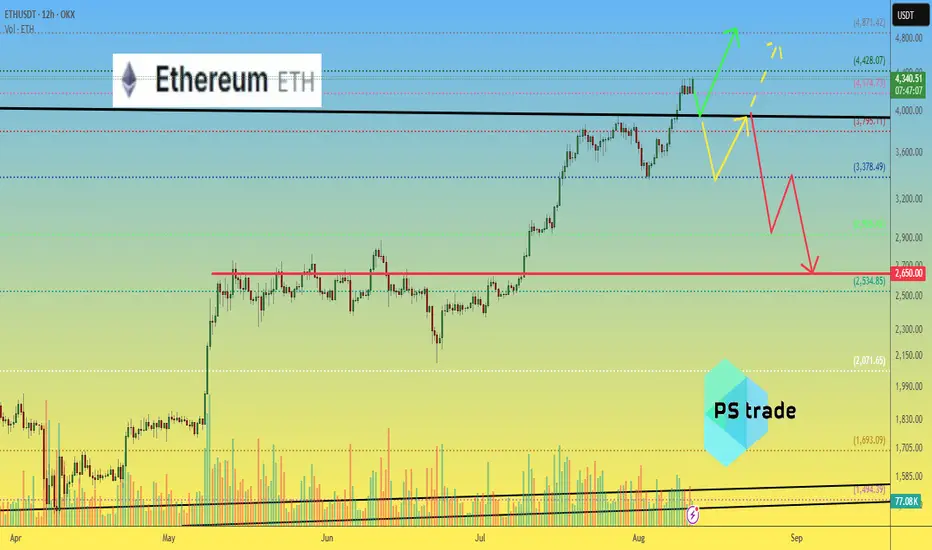
Ethereum ETH price analysis📉 Three possible scenarios for #Ethereum CRYPTOCAP:ETH :
🟢 Bullish:
Minor correction to $3950–$4000, followed by a breakout to new all-time highs (ATH).
🟡 Neutral:
Drop to $3400, bounce to $3950 — and then the decision point: breakout or breakdown?
🔴 Bearish:
Deeper correction to $2650 — possibly the last great buying opportunity before the next major rally.
👉 Which scenario for OKX:ETHUSDT resonates most with you?
Let us know in the comments!
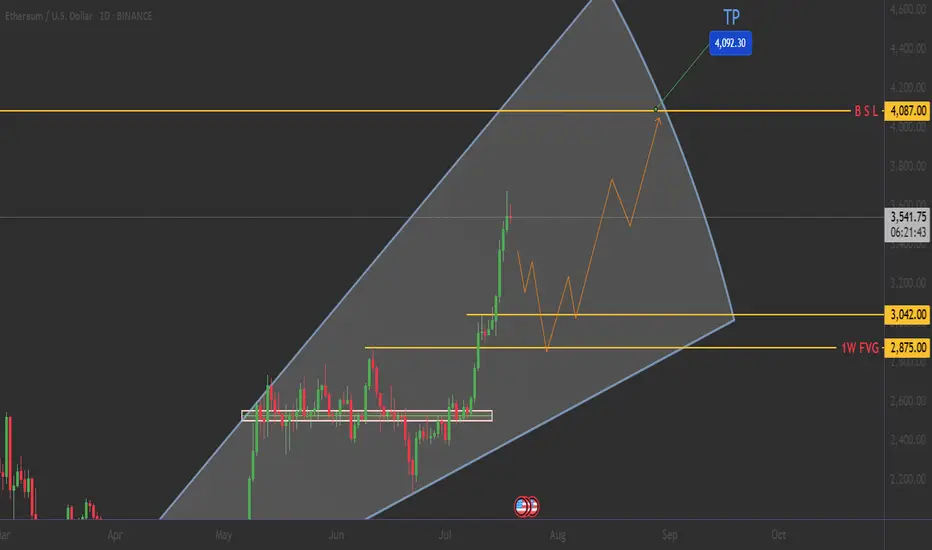
ETHEREUM: The $4,000 Triangle - Breakout or Breakdown?🎯 THE MEGA SETUP: Giant Symmetrical Triangle
🔍 What We're Looking At: 📐 Triangle Specifications:
🟢 $3,042.00 - Triangle Lower Trendline
🟢 $2,875.00 - 1W FVG (Fair Value Gap)
🔴 $4,087.00 - BSL (Buy Side Liquidity)
🔴 $4,200.00 - Psychological barrier
_______________________
🛡️ CONSERVATIVE LONG:
Entry: $2,800 - $2,850 (Triangle support bounce) 📊
Stop Loss: $2,740 (Below triangle) ❌
Targets: $3,500 → $3,800 → $4,200 🎯
! Smash that follow button for more killer setups! 🔥📊
____________ NOTE __________
⚠️ RISK MANAGEMENT
⚠️ DYOR
Remember: No setup is guaranteed. Always manage risk and never invest more than you can afford to lose.
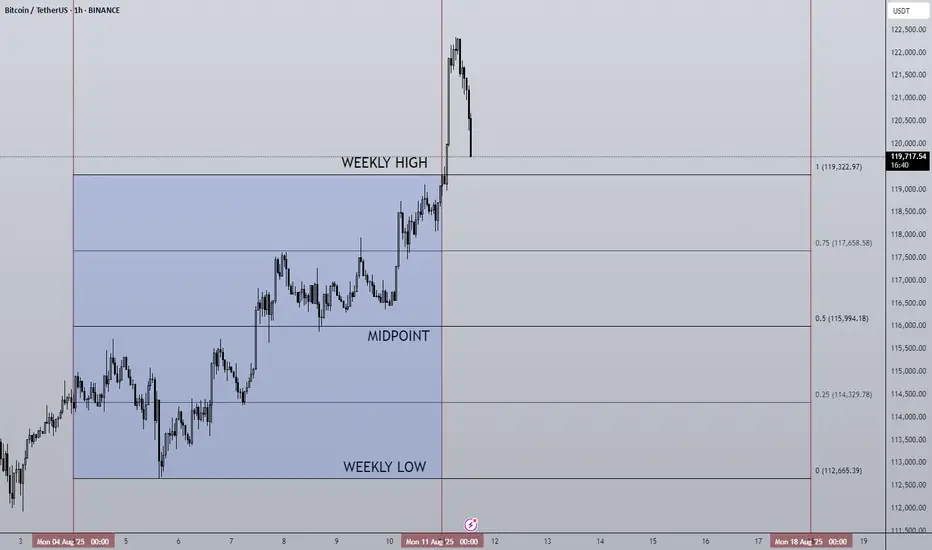
11/08/25 Weekly OutlookLast weeks high: $119,322.97
Last weeks low: $112,665.39
Midpoint: $115,994.18
BTC takes back the spotlight as the week ends! Breaking through the previous weeks high just hours after weekly close and stopping just shy of ATH. This rally comes off the back of a successful bounce from $112,000 area and mirrors the previous weeks drawdown almost perfectly setting up an interesting week ahead.
I am still wary of August seasonality, yes BTC and the broader altcoin market especially ETH have seen great gains so far this month but history shows August is not kind to the bulls;
August '24: -8.74%
August '23: -11.27%
August '22: -13.99%
August '21: +13.42%
August '20: +2.74%
August '19: -4.84%
August '18: -9.0%
Now history doesn't necessarily repeat itself but it does rhyme. Should BTC SFP and accept below the weekly high I would say a $115,000/ Midpoint retest is a logical move. RSI has been posting bearish deviations on HTF (1W&1M) which can suggest a shift in trend is coming but further proof of this would be needed before then
This week CPI & PPI take place on Tuesday and Thursday respectively. With a September interest rate cut on the horizon this data release may be more important than it has been in recent months so I'm keeping a close eye on the result.
Previous: 2.7%
Forecast: 2.8% (+0.1%)
For altcoins many have had great rallies, ETH predominantly after breaking through $4000, again many indicators are showing a local top is due so I am looking at price action context for any clues of a pullback to come, until then the trend is your friend.
Good luck this week everybody!