ETH/USD –> Falling Wedge Breakout Within Ascending ChannelHello guys!
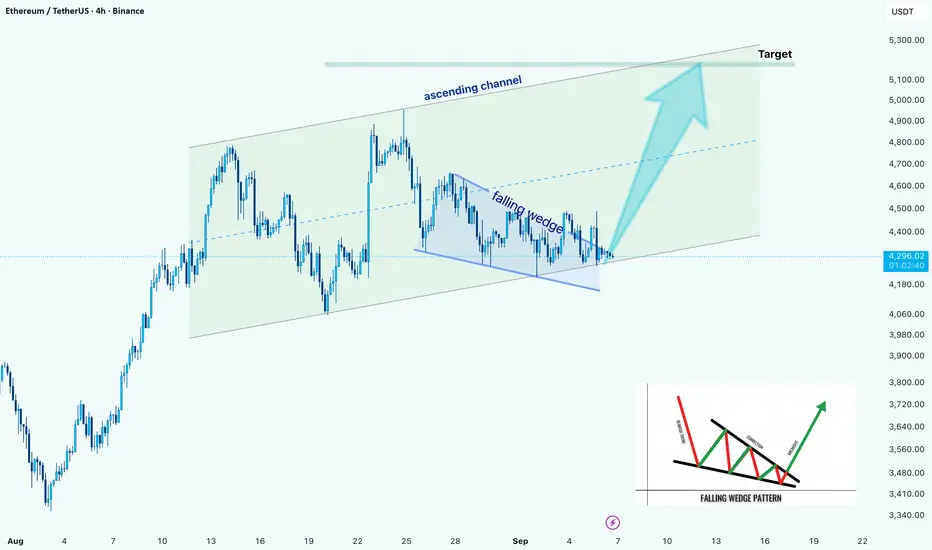
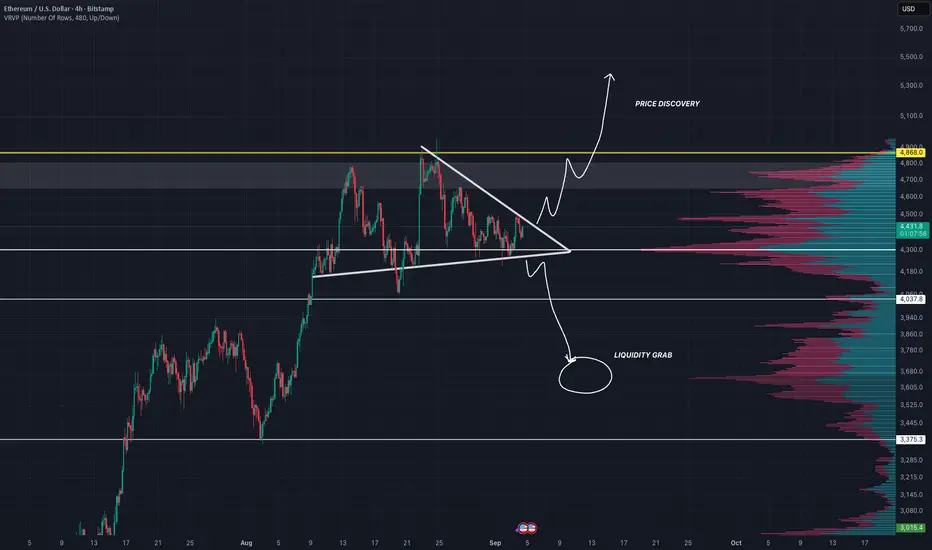
Ethereum is showing a strong technical setup on the 4H chart. Price has been respecting an ascending channel since early August, and within this structure, a falling wedge has recently formed.
Right now, ETH is testing the wedge breakout point near the bottom line of the channel. If buyers manage to hold momentum here, we could see price extending toward the channel’s upper boundary, with the next major target sitting around $5,100 – $5,300.
On the downside, failure to sustain above the wedge support may lead to a retest of the lower channel trendline around $4,100 – $4,150, which remains a critical support area for bulls to defend.
D-ETH
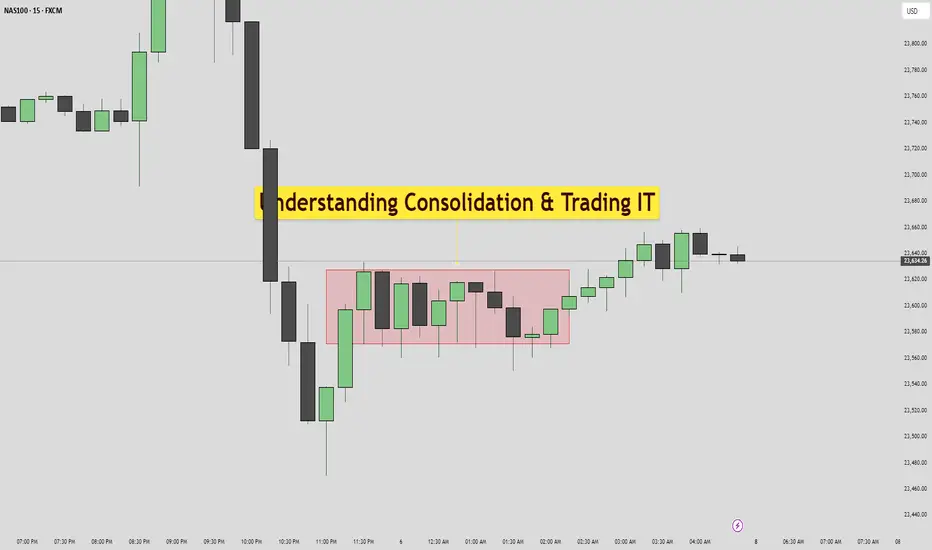
Understanding Consolidation & Trading itWhat Consolidation Is
Consolidation is a market phase where price moves sideways within a defined range, showing indecision or balance between buyers (bulls) and sellers (bears).
Characterized by low volatility, overlapping candles, and no clear trend direction.
Often occurs after strong moves (as the market pauses) or before breakouts (accumulation/distribution).
Impact on Bulls & Bears
Bulls: View consolidation near highs as accumulation (buyers building positions before a breakout upward).
Bears: View consolidation near lows as distribution (sellers unloading before a breakdown).
Both sides place stop orders outside the range → creating liquidity pools that smart money hunts.
How Traders Can Take Advantage
Range Trading – Buy near support of the range, sell near resistance, until breakout occurs.
Liquidity Strategy – Wait for fakeouts beyond consolidation, then trade in the opposite direction (stop hunt setup).
Consolidation Across Timeframes
Lower Timeframes (1m–15m):
Looks like noise but is often where scalpers range trade.
Breakouts can give small but quick moves.
Mid Timeframes (1H–4H):
Shows clear accumulation/distribution phases.
Useful for intraday & swing traders.
Higher Timeframes (Daily–Weekly):
Represents major market indecision.
Breakouts from these zones often fuel massive trend moves.
✅ Summary:
Consolidation = sideways range = balance of bulls & bears.
Inside range → fade the extremes.
Outside range → trade support & resistance or liquidity sweep.
On different timeframes → the same consolidation can be noise on 5M, but a critical accumulation on the Daily chart.
TradeCity Pro | Ethereum Consolidates in Descending Triangle👋 Welcome to TradeCity Pro!
In this analysis I want to review Ethereum for you. Ethereum is by far the most popular altcoin in the market and with a market cap of 520 billion dollars it is ranked 2nd on CoinMarketCap.
⏳ 4-Hour Timeframe
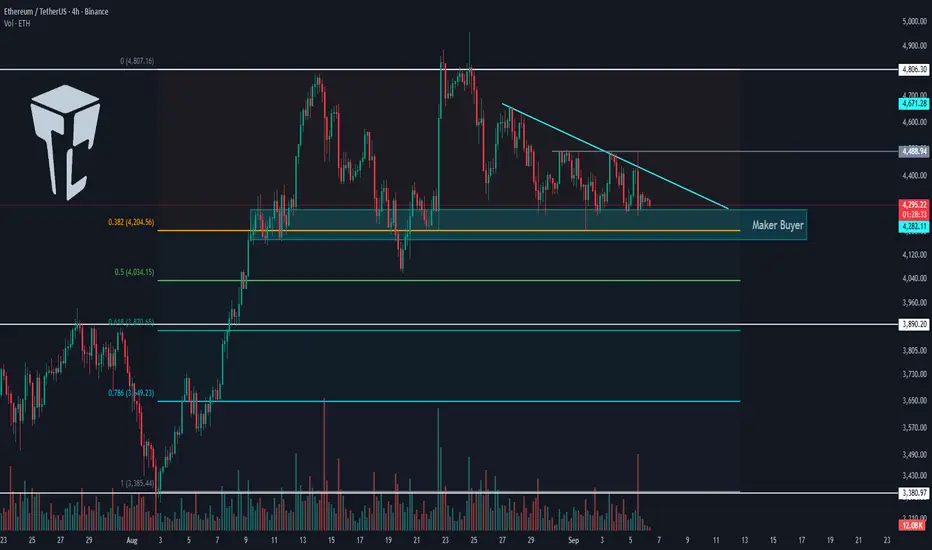
After the bullish leg that started from the bottom of 3380, Ethereum broke 3890 and reached the top of 4806, managing to register a new all-time high.
✨ Currently, the price is in a corrective and ranging phase and has corrected down to the 0.382 Fibonacci level, forming a Maker Buyer zone near this area.
⚡️ A descending trendline has also formed, where the price has tested it multiple times, creating a descending triangle between this trendline and the Maker Buyer zone.
📈 With a breakout of this trendline, we can open a long position. The trendline trigger is at 4488, and this position can be taken as a pre-breakout entry before 4806, with the main trigger being the breakout of 4806 itself.
🔽 On the other hand, if the triangle breaks to the downside, the price will move towards lower Fibonacci levels and can correct down to 3890.
💫 In my opinion, as long as Ethereum is above the 3890 level, its trend remains fully bullish, and if it is supported in this current zone, the next leg up will start even stronger.
💥 The first confirmation of a trend reversal will be if the price stabilizes below 3890, but currently, the price is still far from this level, and as long as it is above it, opening short positions is not logical.
📝 Final Thoughts
Stay calm, trade wisely, and let's capture the market's best opportunities!
This analysis reflects our opinions and is not financial advice.
Share your thoughts in the comments, and don’t forget to share this analysis with your friends! ❤️
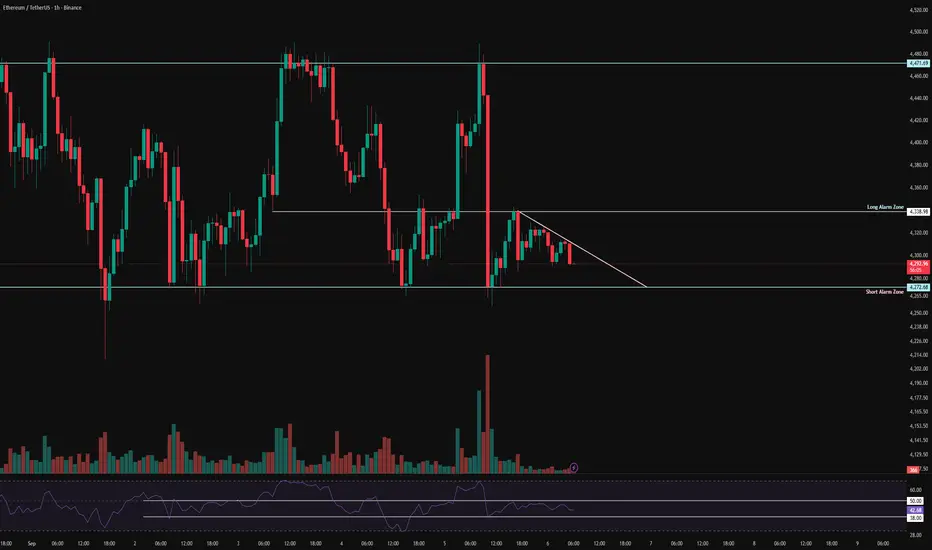
ETH 1H Analysis - Key Triggers Ahead | Day 14💀 Hey, how's it going ? Come over here — Satoshi got something for you!
⏰ We’re analyzing ETH on the 1-hour timeframe timeframe.
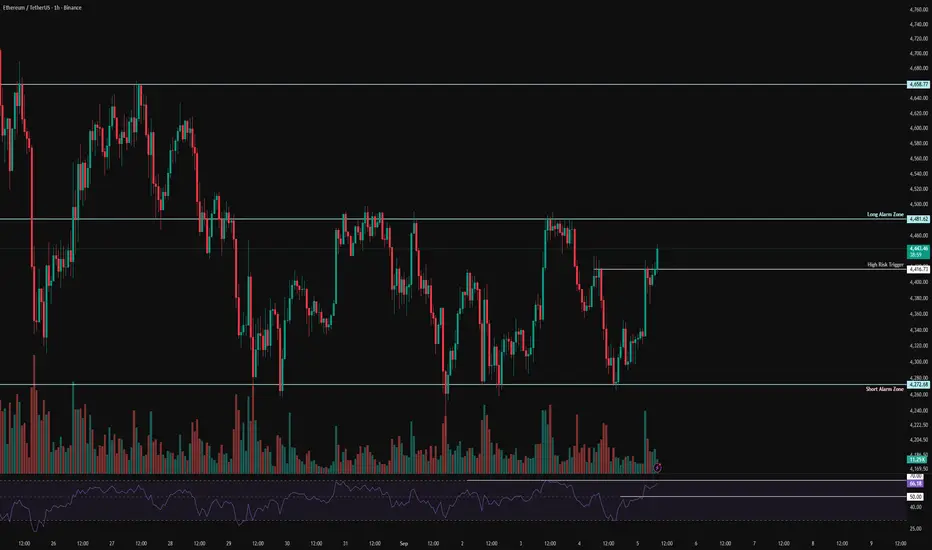
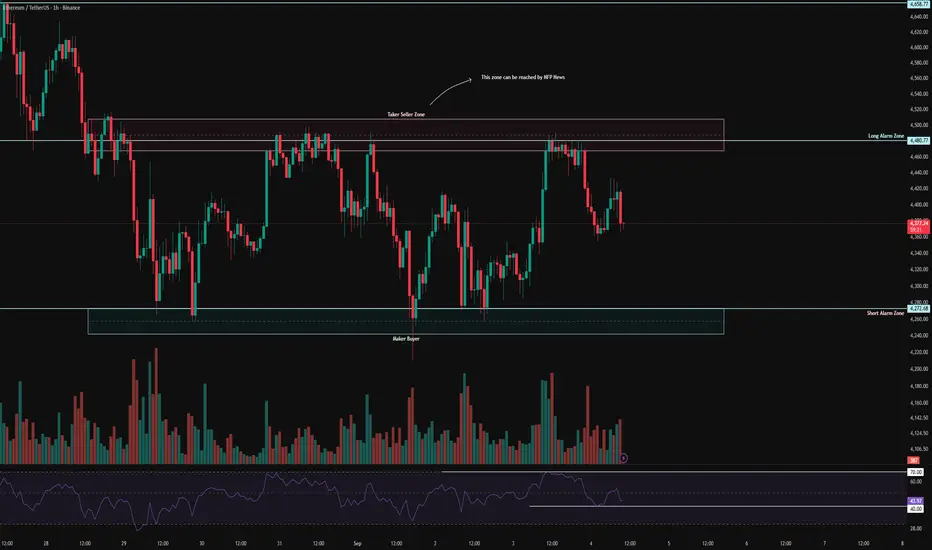
🔭 On the 1H timeframe for Ethereum, we can see that after yesterday’s news, ETH pushed upward toward the top of its range but failed to break out. From that resistance, it faced a heavy rejection, and this drop happened within just two 1H candles! At the moment, ETH is in a consolidation zone, and breaking out of this compression could provide us with an entry.
⛏ The key RSI oscillator levels are at 38 and 50. Once RSI breaks above or below these zones, Ethereum could start its next move following the effects of yesterday’s NFP news.
💰 The size and volume of red candles have increased sharply, showing strong selling pressure. The corrective bounce happened step by step, but then another fairly large red 1H candle was printed. With continued selling pressure, Ethereum may test lower price levels.
🪙 On the 1H timeframe for the ETHBTC pair, we can see it is moving inside a multi-timeframe range. Each time it reaches the bottom of the box, volume increases and the price reacts with zig-zag moves. Note that the bottom of this box is at 0.03864, which has already been tested twice. This area should be considered as a short alert zone for ETHBTC.
💡 The alert zones for Ethereum itself are at 4,272$ and 4,338$. If either of these levels is broken, ETH could start a strong move, especially considering the momentum after yesterday’s NFP News.
❤️ Disclaimer : This analysis is purely based on my personal opinion and I only trade if the stated triggers are activated .
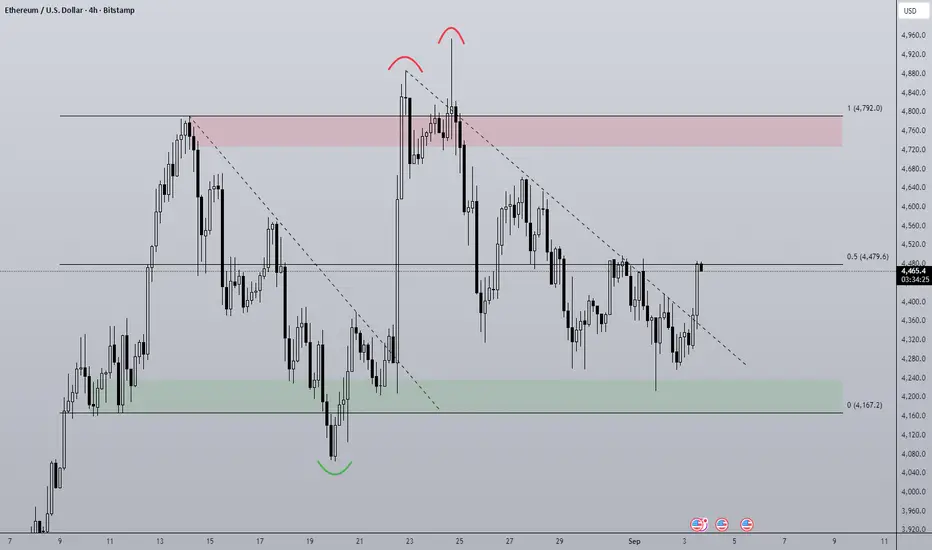
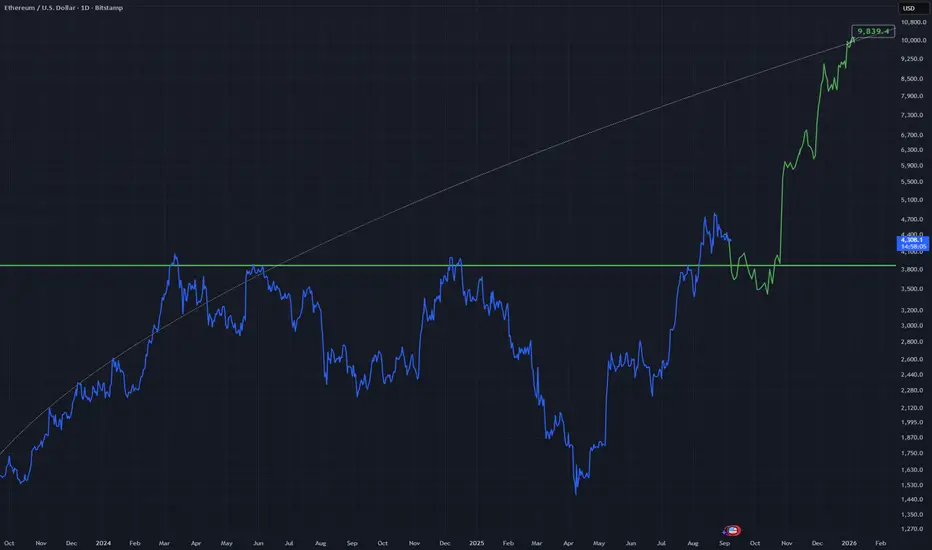
ETHUSD - ATH An idea showing a curved resistance trend line that I think could be hit as a high for price
this would put price at nearly 10K which is crazy
I suspect the white line is support due to previous breakthrough and it no longer being resistance as before.
Aim for the dotted line up.
Daily chart
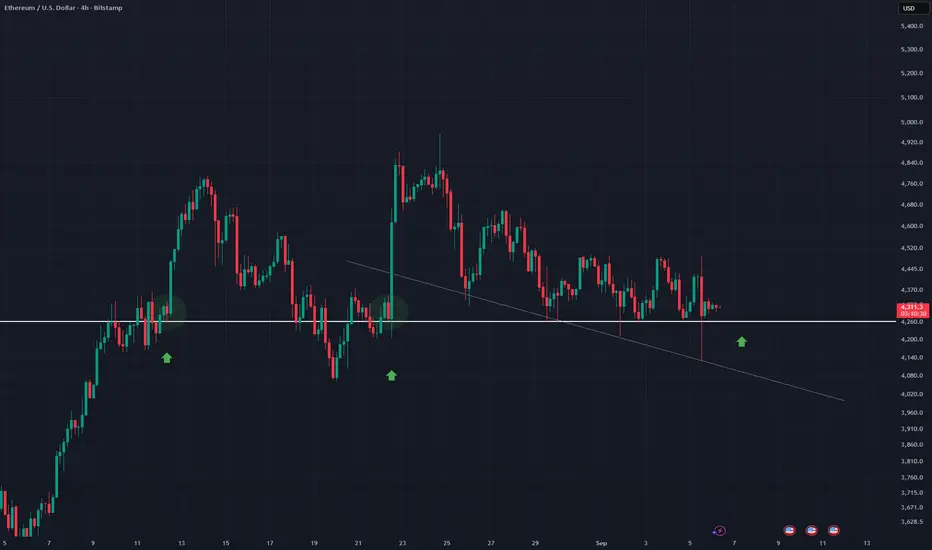
ETHUSD 4Hr - Strong Horizontal SupportETH has been hodling this horizontal support line quite well with one recent dip then sudden recovery below it
This drop below can be shown with a trend line with dotted line
I think price will hodl the horizontal and break out as predicted by the two prior breakouts along this line.
Volatility Period: Around September 7th (September 6th-10th)
Hello, traders!
Follow us to get the latest information quickly.
Have a great day!
-------------------------------------
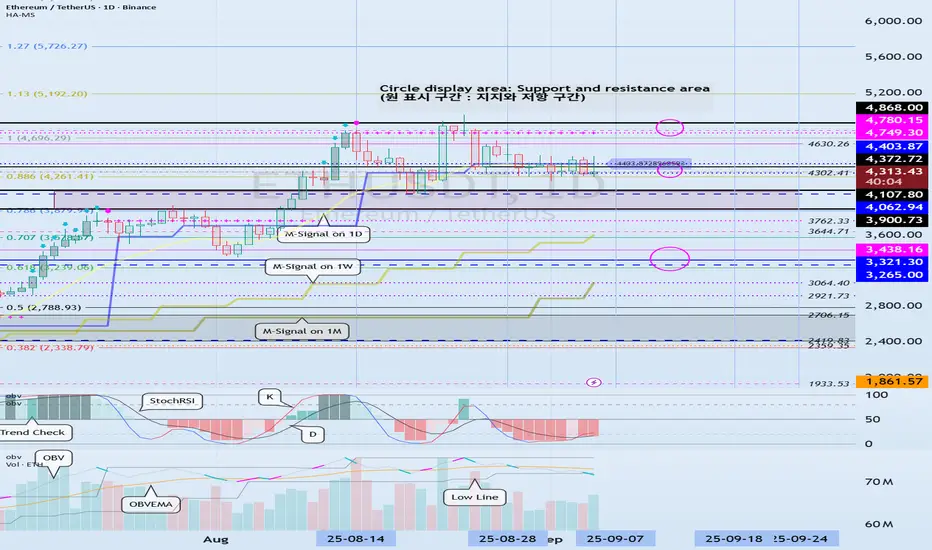
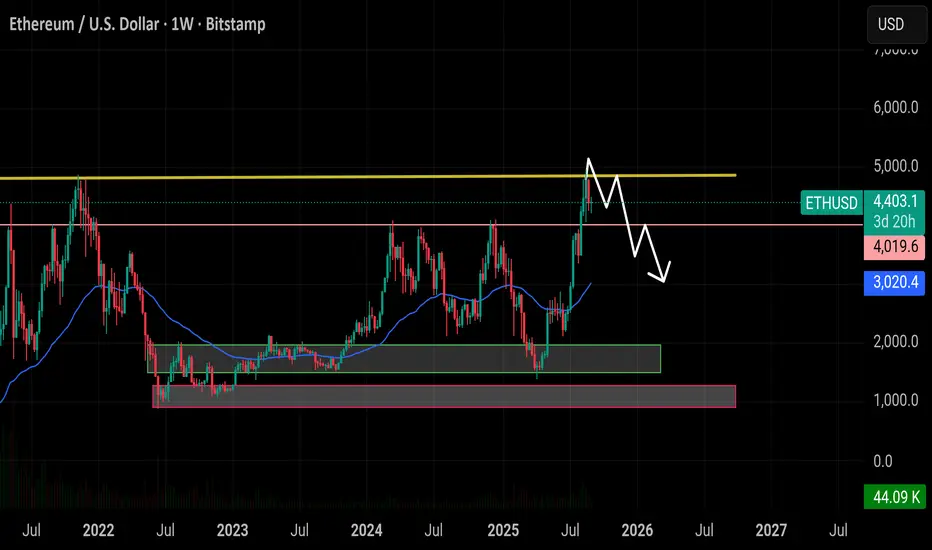
(ETHUSDT 1D Chart)
This volatility period is around September 7th (September 6th-10th).
After this period of volatility, the key question is whether the price can find support and rise above the 4403.87-4749.30 level.
-
To continue the cascading upward trend, the price must rise above 4749.30.
Therefore, we need to monitor whether the price maintains above the 4749.30-4868.0 level.
-
If resistance is encountered at 4403.87 and the price declines, it is likely to decline until it meets the HA-Low indicator.
Therefore, we need to check for support around 4302.41-4403.87.
However, there is a possibility of a rise after touching the previous all-time high (ATH) range of 3900.73-4107.80, so we need to consider a response plan.
If the price falls below 4107.80, it is expected to touch the M-Signal indicator on the 1W chart and resume the trend.
-------------------------------
The On-By-Signal (OBV) indicator is falling below the Low Line.
The TC (Trend Check) indicator is below 0.
The K value of the StochRSI indicator is showing signs of rising from the oversold zone.
If the High Line of the OBV indicator falls and forms a downward channel, it is highly likely that selling pressure will continue to dominate, so caution is advised when trading.
Therefore, the key issue this time is whether support is found around 4302.41-4403.87.
The TC (Trend Check) indicator is a comprehensive evaluation of the StochRSI, On-By-Signal (OBV), and PVT-MACD Oscillator indicators.
Therefore, if the TC indicator is below 0, selling pressure is dominant, and the price is likely to decline.
If the K value of the StochRSI indicator continues to rise, the price is likely to rise after this period of volatility.
However, for the uptrend to continue, the OBV and TC indicators must show upward trends.
-
Thank you for reading to the end.
We wish you successful trading.
--------------------------------------------------
- Here's an explanation of the big picture.
(3-year bull market, 1-year bear market pattern)
I'll explain more in detail when the bear market begins.
------------------------------------------------------
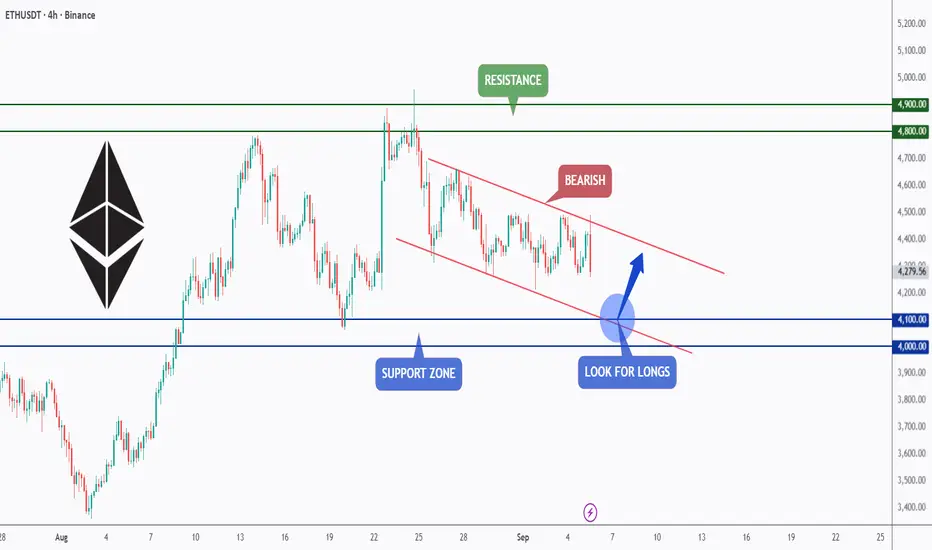
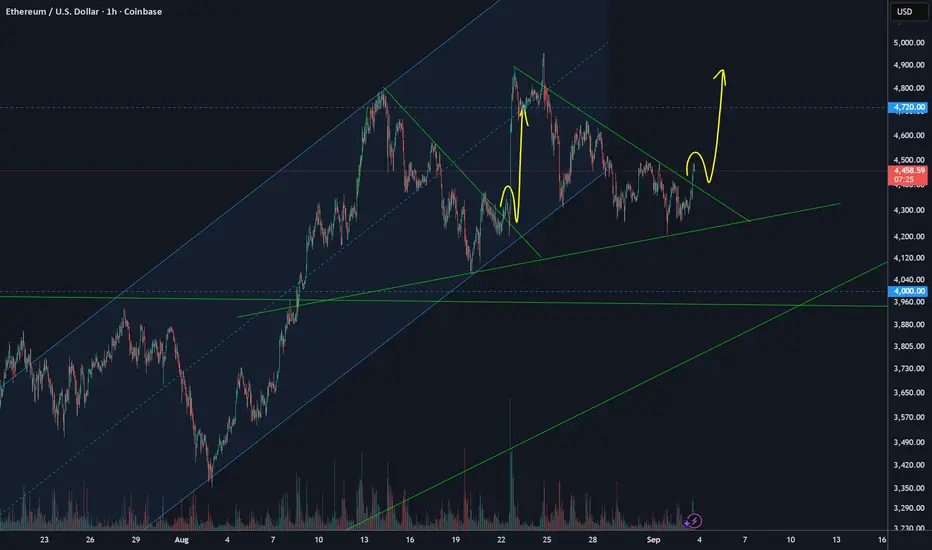
ETH – Watching the Falling Channel!Ethereum is currently trading within a falling channel on the 4H timeframe, showing short-term bearish pressure.
Price is approaching the support zone around the $4,000–$4,100 area, which also aligns with the lower boundary of the channel.
As long as this zone holds, it could act as a springboard for bullish momentum, offering a potential long setup.
A breakout from the channel would further confirm buyer strength and open the way toward the resistance zone near $4,800–$4,900.
⚠️ Disclaimer: This is not financial advice. Always do your own research and manage risk properly.
📚 Always follow your trading plan regarding entry, risk management, and trade management.
Good luck!
All Strategies Are Good; If Managed Properly!
~Richard Nasr
ETH 1H Analysis - Key Triggers Ahead | Day 13💀 Hey , how's it going ? Come over here — Satoshi got something for you !
⏰ We’re analyzing ETH on the 1-hour timeframe timeframe .
🔭 On the 1H timeframe of Ethereum, we can see that ETH has had a solid upward move and is now facing resistance at $4416. If this level breaks, price could move toward the next resistance at $4481. A early trigger for a long position is right at the current level, which I’ve already used to open a trade. I’ve also set a low-risk order around $4481, which is the top of ETH’s box structure on the multi-timeframe view.
⛏ The key RSI zones for ETH are around 50 and 70. Breaking out of these levels could trigger a strong leg. With news coming, volatility is expected to increase sharply. ETH is currently trading below 70 but above 50, which suggests long setups have more momentum.
📊 The size and volume of ETH’s green candles are increasing, showing clear buying strength. If today’s NFP news comes out positive, ETH could make a very strong upward leg.
💸 On the 1H ETHBTC chart, the pair is inside a descending channel, and within this channel, it has formed a tight box-like consolidation. The box top is at 0.03999, while the bottom sits at 0.0387. With higher volume and volatility, ETHBTC could break out, leading to either a pump or a dump in Ethereum.
💡 The alarm zones for Ethereum are set at $4416 and $4481. Breaking and holding above these levels can provide strong trading opportunities. Personally, I’ve already opened a position on the $4416 breakout, and I plan to add more size if the $4481 zone is taken out. The NFP release could bring momentum similar to last time, with sharp and powerful moves.
❤️ Disclaimer : This analysis is purely based on my personal opinion and I only trade if the stated triggers are activated .
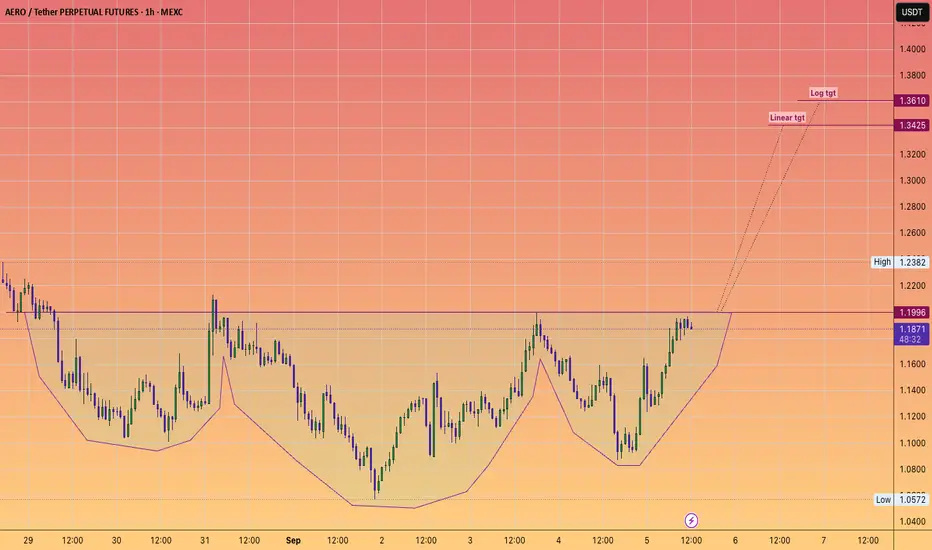
*Trade IDEA* Aerodrome to $1.35Inverse Head and shoulder is about to trigger.
"How Aerodrome Integrates with Coinbase Base DEX
Aerodrome's integration with Coinbase's Base DEX has been a game-changer for the platform. This partnership has created a powerful liquidity flywheel, with approximately 44% of Base's GDP flowing through Aerodrome. Post-integration, the platform experienced a 30% surge in trading volume and achieved a staggering $1.17 billion in 24-hour trading volume. By leveraging Coinbase's robust infrastructure, Aerodrome has simplified DeFi access for millions of users, making it a pivotal player in the Base ecosystem.
AERO Tokenomics: A Model for Sustainable Growth
Aerodrome's native token, AERO, is at the heart of its ecosystem. The platform employs dynamic emission throttling, reducing token inflation to just 1%. This ensures sustainable yields for liquidity providers while preserving the token's long-term value. Additionally, Aerodrome's ve(3,3)-style governance model incentivizes liquidity growth and rewards token holders with swap fees and staking benefits. This innovative approach has driven an 80% price surge for AERO, solidifying its appeal among investors and users alike."
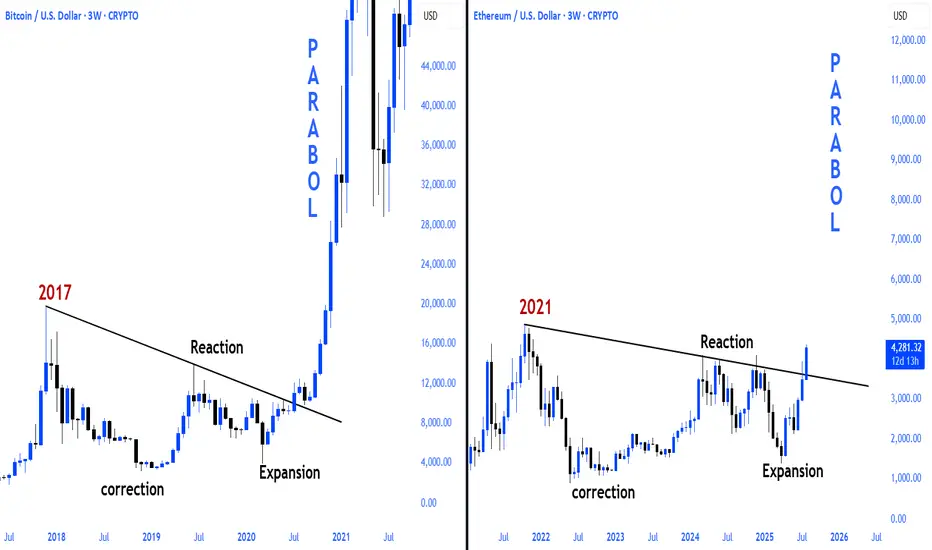
Don't sleep on Ethereum!Ethereum is following the pattern seen before the 2021 bull run of Bitcoin, and we are now in the final stages before the parabolic run for Ethereum.
CRYPTOCAP:BTC 2017\2021 vs. CRYPTOCAP:ETH 2021\2025
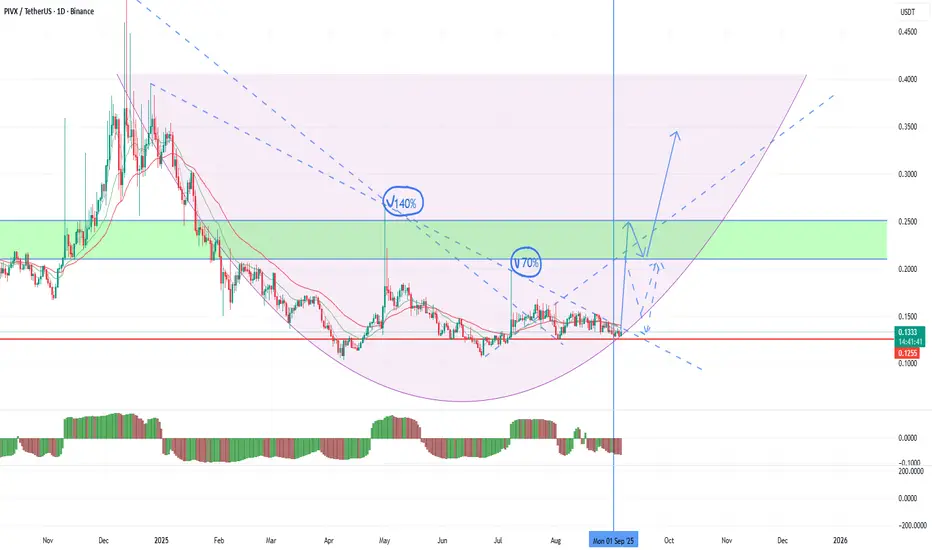
Up to 100%+ on PIVXTo date, sales in the altcoin market continue within the framework of seasonal dynamics, which are likely to last at least until the middle of the month. Binance continues to exert pressure by delaying the announcement of the assignment of the monitoring tag to new coins, under the threat of which investors are wary of further purchases. The first week of the month ends today and once again there is no announcement. The probability has increased that the tag will not be assigned this month. In this regard, I am trying to take into account the most oversold coins relative to the current market position, which can break through against seasonal sales.
Pivx looks the most interesting, which has already made a profit several times this year. The July momentum broke through one of the downtrend lines, starting a smooth trend change from strong long-term support at 0.125. This month opened above the level, as did the quarter, which could lead to a powerful growth momentum before the end of the quarter with an attempt to consolidate above 0.21-25 and profit up to 100%+. Due to the likely absence of the assignment of the monitoring tag this month, growth may begin as early as tomorrow. In this case, the trend can be quite stable. If the breakdown occurs on working days and against the background of a general drawdown of the market, then there is a high probability of a rebound from 0.21-25 with a stable trend from the second half of the month. In the new week, it is worth keeping short stops in the morning, as binance may deviate from its own rules and assign a monitoring tag in the second week of the month.
Also, fantokens are still safe this month, without entering the delisting and monitoring announcement. However, seasonal sales had a strong impact on them in the summer, and they are likely to smooth out the dynamics now. In this regard, I'm trying to take only the most oversold atm and acm.
Due to the lack of a monitoring announcement, waves of growth up to 30-40% above current levels may also result from fio chess cos, however, if seasonal sales accelerate in the new week, there is a possibility of an additional drop in prices to 20-25%.
Against the background of the general market decline, highly oversold but also dangerous coins with the bsw fis voxel bifi flm rei monitoring tag with possible growth impulses of up to 50% may be interesting for speculators. However, it should be borne in mind that if there is no growth, they may be delisted in the new month.
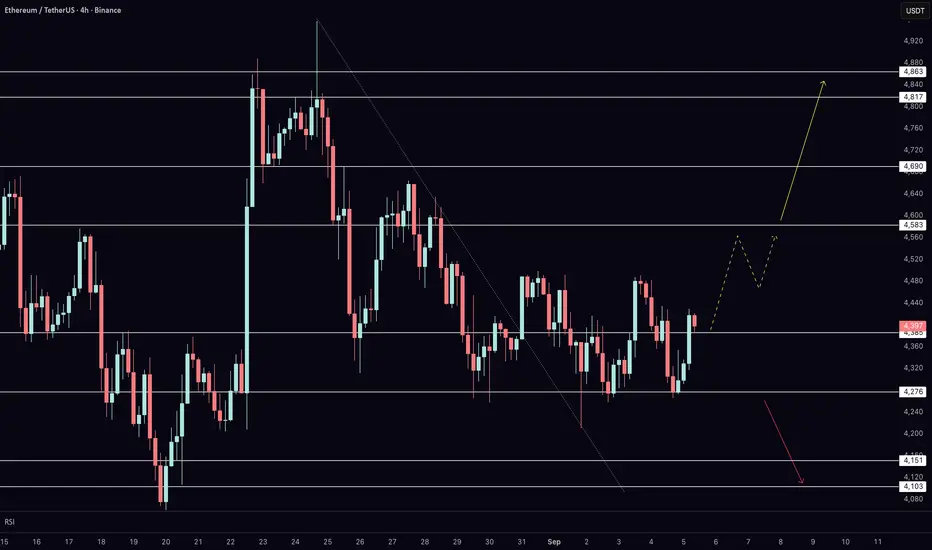
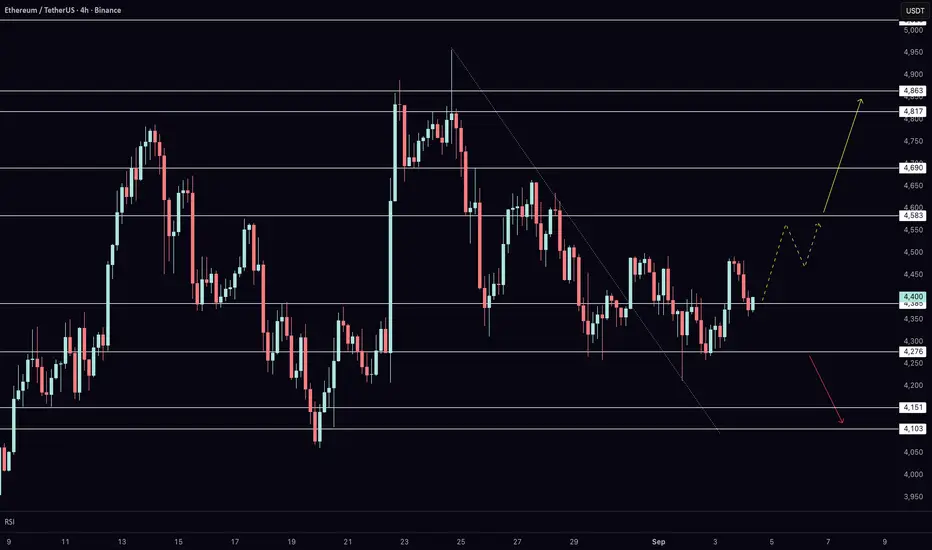
Key Levels to Watch on Ethereum Today After NFP & Bitcoin RallyEthereum is trading right at key resistance on the 4-hour chart, and today’s price action could set the tone for the next major move. After defending support at $4,276, ETH has bounced back into the $4,383 level, where buyers and sellers are now battling for control. In this video, I break down the short-term roadmap, explain the critical support and resistance levels, and outline the scenarios that could unfold depending on today’s reaction.
With the U.S. NFP release adding volatility across markets and Bitcoin showing fresh bullish momentum, Ethereum is at a decisive moment. A confirmed breakout above resistance would open the path toward $4,582, $4,689, and $4,862, while failure to hold support shifts focus back to $4,148 and $4,103. Watch closely — the coming sessions are likely to provide clarity on whether ETH is ready to extend higher.
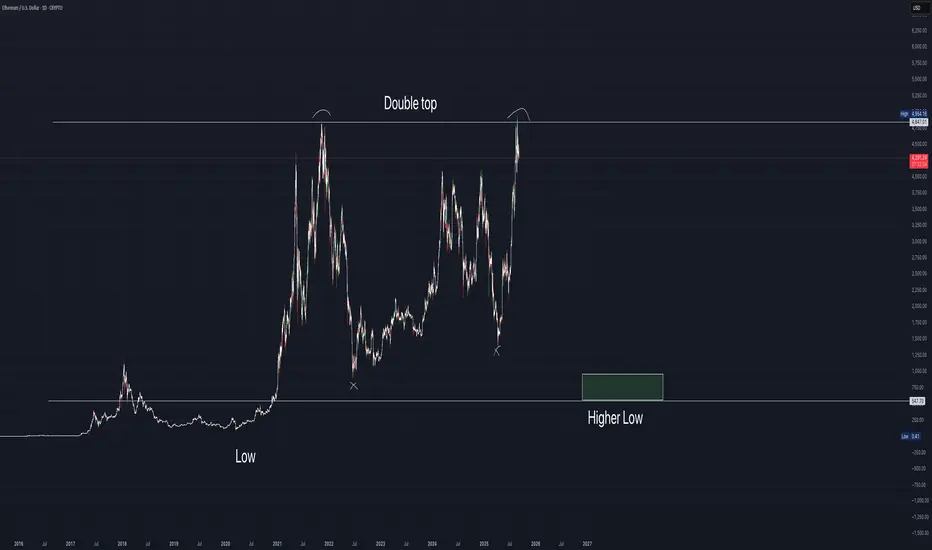
Ethereum ENDS all meme coins?We have a double top pattern here on eth the should end life of all memecoins and wash away the most if not all worthless projects from the blockchain even the first Defi project MKR is starting to be delisted. be careful out here
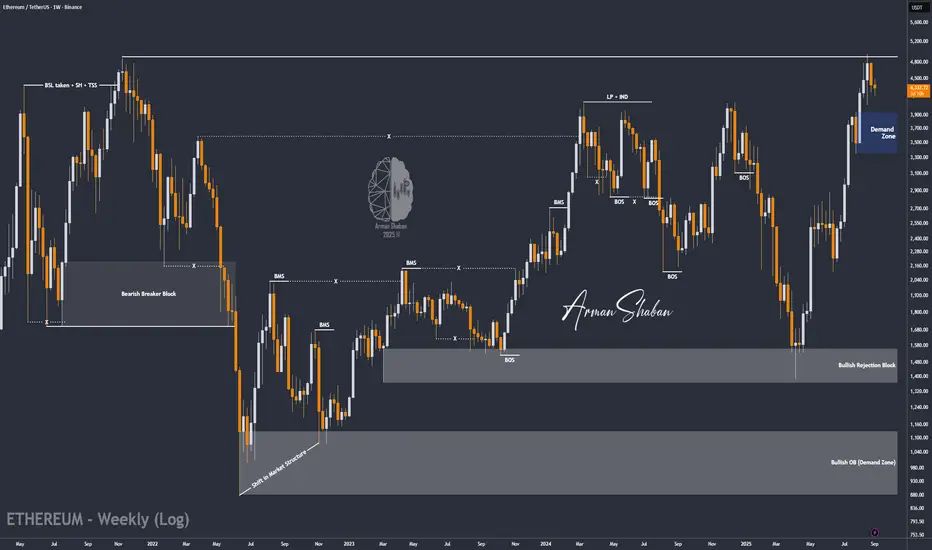
ETH/USDT | Hits $4950 ATH After 130% Rally – More Gains Ahead?By analyzing the Ethereum (ETH) chart on the weekly timeframe, we can see that, as expected, price has continued its bullish rally since our last analysis — successfully hitting all three targets at $4000, $4400, and $4900. With a remarkable 130% growth in just 77 days, Ethereum finally printed a new ATH at $4950!
Currently, ETH is trading around $4300, and as long as the price holds above the $3330–$3950 support zone, we can expect another strong bullish wave in the near future.
This analysis will be updated — stay tuned for the next move!
Please support me with your likes and comments to motivate me to share more analysis with you and share your opinion about the possible trend of this chart with me !
Best Regards , Arman Shaban
ETH 1H Analysis - Key Triggers Ahead | Day 12💀 Hey , how's it going ? Come over here — Satoshi got something for you !
⏰ We’re analyzing ETH on the 1-hour timeframe timeframe .
🔭 On the 1H timeframe of Ethereum, we can see that ETH is moving inside a very tight consolidation box along with heavy profit-taking. It has been strongly supported around the $4277 level. As a result, both the top and bottom of this 1H range appear very solid. Ethereum is currently in an accumulation phase, and it could break out of this box with tomorrow’s news. The key levels to watch are exactly the top and bottom of this range.
⛏ On the RSI, the critical zones are around 40 and 70 (Overbought). If price momentum pushes beyond these zones, Ethereum could experience a strong move. Tomorrow’s news is likely to have a significant impact on ETH volatility.
💰 The size, volume, and number of green candles are greater compared to the red ones. This structure indicates a price compression pattern. A taker-seller zone exists around $4480, where more sell orders keep activating. On the other hand, there’s a maker-buyer zone at the bottom of the box that supports ETH whenever price reaches it.
📊 On the 4H timeframe of ETHBTC, the pair is moving inside a descending channel. Each time price touches the channel’s bottom, it finds support. Currently, ETHBTC has formed a V-pattern, and if it breaks the neckline, more Bitcoin could be converted into Ethereum. However, for this breakout to happen, the RSI across the 1H–4H multi-timeframes needs to move into the Overbought zone.
💡 The alarm zones for Ethereum are set at $4272 and $4480. Breaking either of these levels could trigger a strong move. For a long setup, breaking above $4480 requires high volume and strong buying pressure to absorb the sell orders placed there. Tomorrow’s news is extremely important—most of the market is waiting for it. There’s a lot of talk about a potential interest rate cut, which will directly affect Ethereum’s trend. From a technical perspective, strong patterns have already formed, and their breakout will likely align with the NFP news release tomorrow.
❤️ Disclaimer : This analysis is purely based on my personal opinion and I only trade if the stated triggers are activated .
$ETH - Close to a breakout.CRYPTOCAP:ETH - Close to a breakout.
Ethereum is about to breakout the triangle.
Ethereum at $4,382 – Upside or Another Retest of $4,276?My main bias remains more upside. On the 4-hour chart, Ethereum is defending $4,280 support and testing $4,380 resistance. A break and hold above $4,380 opens the path toward $4,580, $4,690, and $4,860. Failure to hold $4,280 would shift focus to $4,150 and $4,100.
Do you also want me to round the prices in the full transcript I wrote earlier, so it matches this simplified style?
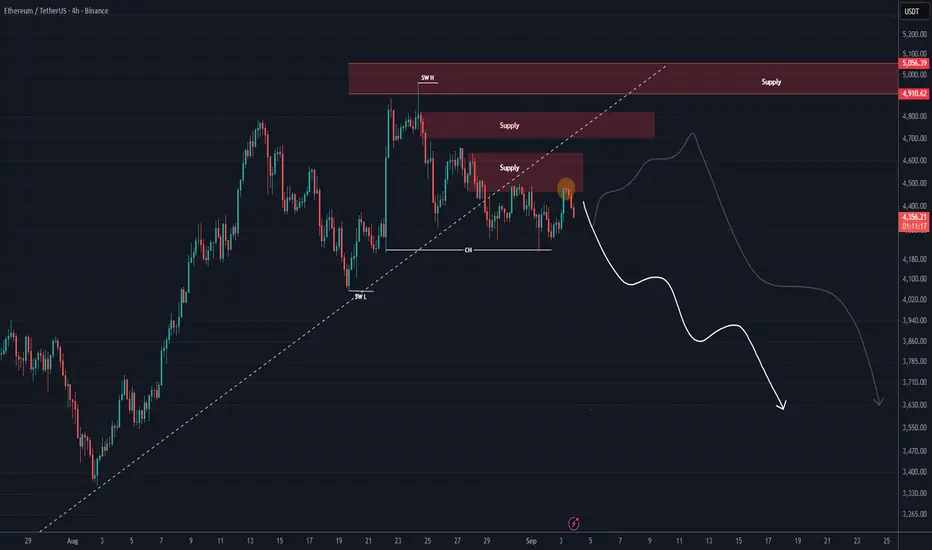
ETHERUM New Analysis | Be Careful (4H)This analysis is an update of the analysis you see in the "Related publications" section
Considering the lack of price penetration and the formation of higher highs at the first supply zone, Ethereum may have already started its drop without a recovery and could move from the current area toward the $3,700–$3,500 range. So stay alert and manage your risk carefully.
There is still a slight chance of a price rebound to the upside.
For risk management, please don't forget stop loss and capital management
Comment if you have any questions
Thank You
$ETH trading near $4,400 I’m still holding my short.CRYPTOCAP:ETH trading near $4,400 — I’m still holding my short. Strong resistance sits at $4,850–$5,100, and I’ll look to add more if we retest that zone. First downside target is $4,000, then $3,500. I’ll share updates if I close or adjust the position.
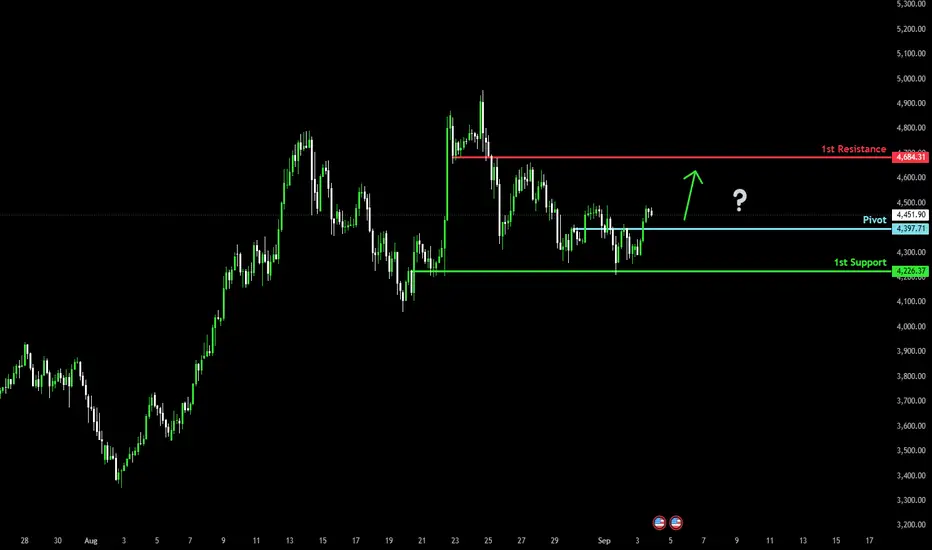
Potential bullish reversal?Ethereum (ETH/USD) is falling towards the pivot and could bounce to the 1st resistance.
Pivot: 4,397.71
1st Support: 4,226.37
1st Resistance: 4,684.31
Risk Warning:
Trading Forex and CFDs carries a high level of risk to your capital and you should only trade with money you can afford to lose. Trading Forex and CFDs may not be suitable for all investors, so please ensure that you fully understand the risks involved and seek independent advice if necessary.
Disclaimer:
The above opinions given constitute general market commentary, and do not constitute the opinion or advice of IC Markets or any form of personal or investment advice.
Any opinions, news, research, analyses, prices, other information, or links to third-party sites contained on this website are provided on an "as-is" basis, are intended only to be informative, is not an advice nor a recommendation, nor research, or a record of our trading prices, or an offer of, or solicitation for a transaction in any financial instrument and thus should not be treated as such. The information provided does not involve any specific investment objectives, financial situation and needs of any specific person who may receive it. Please be aware, that past performance is not a reliable indicator of future performance and/or results. Past Performance or Forward-looking scenarios based upon the reasonable beliefs of the third-party provider are not a guarantee of future performance. Actual results may differ materially from those anticipated in forward-looking or past performance statements. IC Markets makes no representation or warranty and assumes no liability as to the accuracy or completeness of the information provided, nor any loss arising from any investment based on a recommendation, forecast or any information supplied by any third-party.
ETH repeating itself with a nice move up incoming?It looks like a repeating pattern could be playing out in the ETH market.
Look for the retest of the breakout (as marked in yellow arrows) followed by a leg up back to test the ATH.
Ethereum 4H Range As we approach nearly a month in the range from $4000-4800 it looks like ETH is making a move once again.
Previously once hitting $4800 price gradually sold off back towards range low creating a bearish trendline, once the price broken above that level a rapid move up to range high within two candles.
Now looking at the chart we have a similar setup, strong breakout from the bearish trendline up into midpoint. Bitcoin currently retesting a key level of $112,000, should BTC flip this level I could see alts getting the greenlight to move up and Ethereum up to the highs.
Should BTC reject from $112,000 it makes sense that ETH range midpoint would be strong resistance, rejection could lead to a range low retest. Anything else that isn't either range high, range low or midpoint is noise and for me no action required, no need to over complicate it.