ETH 1H Analysis – Key Triggers Ahead | Day 4💀 Hey , how's it going ? Come over here — Satoshi got something for you !
⏰ We’re analyzing ETH on the 1-hour timeframe timeframe .
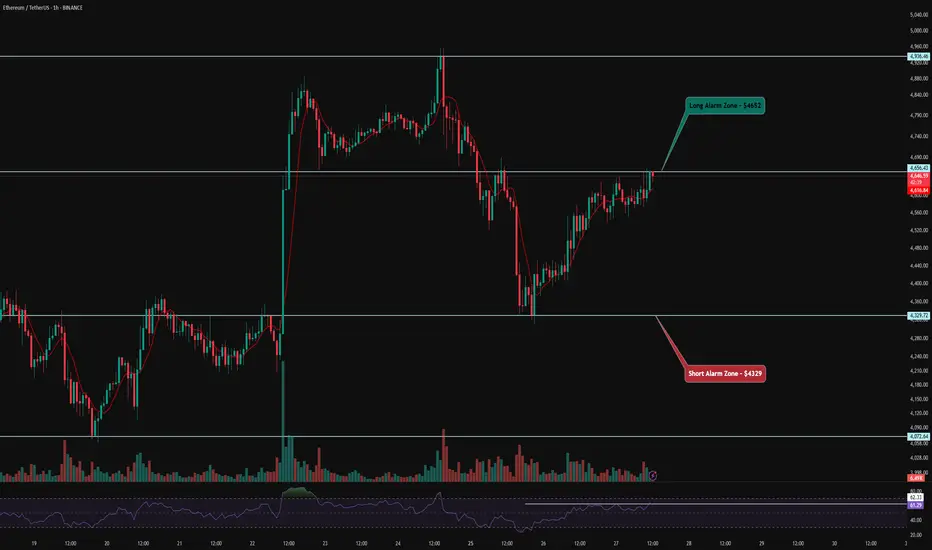
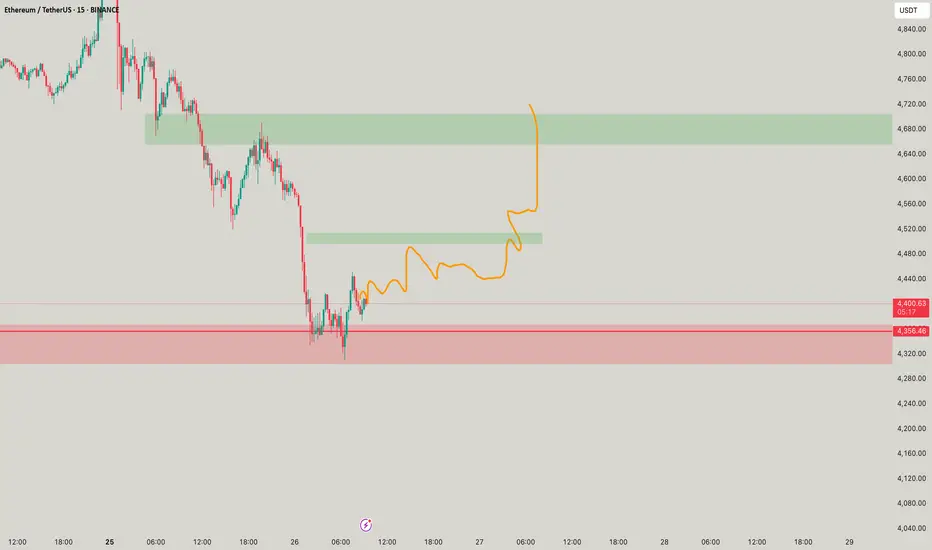
👀 On the 1H timeframe for Ethereum, we can observe that ETH is currently moving inside a V-pattern. If the price breaks out and consolidates above the neckline of this pattern, we could see a strong bullish continuation. Checking ETF flow data also shows heavy accumulation of Ethereum, which supports the bullish bias.
⚙️ The key RSI level for ETH sits around 62. Once the RSI crosses above this threshold, Ethereum has the potential to break the neckline of the V-pattern and push into the overbought zone, signaling further upside momentum.
🕯 Additionally, the volume, candle size, and number of green candles are increasing as ETH approaches this resistance. With rising trading volume, ETH could target higher price levels and potentially confirm a new all-time high.
🪙 On the 1H BINANCE:ETHBTC chart , we see a significant resistance level around 0.04274. A breakout above this zone with strong volume and volatility would provide an additional confirmation for a long position in Ethereum.
🔔 Our long setup alert zone is placed around $4652, while the short setup alert zone is positioned near $4329.
❤️ Disclaimer : This analysis is purely based on my personal opinion and I only trade if the stated triggers are activated .
D-ETH
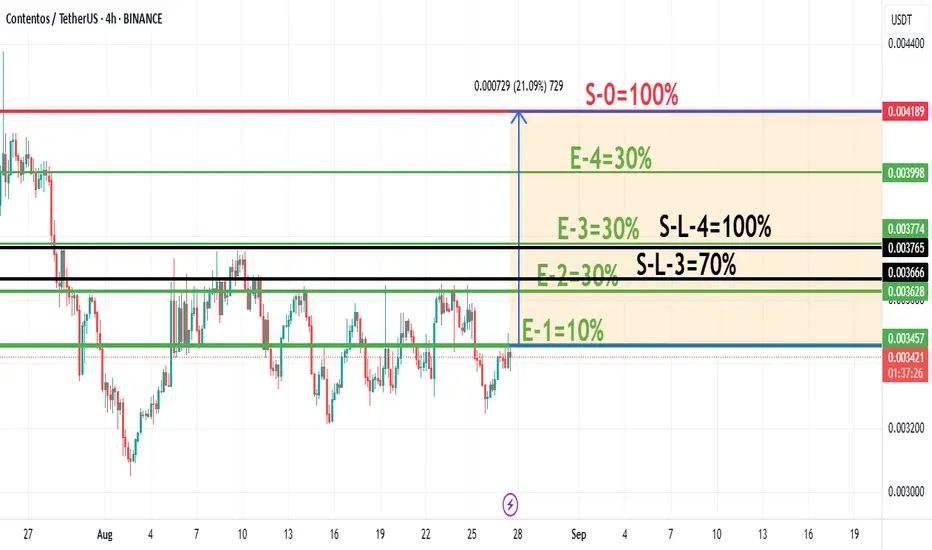
Proposed ~11% Average Gain Trade Strategy with COSThis is a 4-step buying plan where you add to your position as the price goes up. Your stop-loss automatically moves to a "breakeven" point after each phase, guaranteeing no loss if the price reverses.
1. The Entries (Buying More as it Rises):
E-1: Buy 10% at price 0.003457
E-2: Buy another 30% at the higher price 0.003774
E-3: Buy another 30% at the higher price 0.004189 (You now own 70%)
E-4: Buy the final 30% at the high price 0.008998 (You now own 100%)
2. The Exits & Risk Management (The "No-Loss" Trick):
After E-3 (70% owned), you set a Stop-Loss at S-L-3.
The S-L-3 price is set at your average purchase price for the first 70%.
If the price hits S-L-3, you sell all 70%. Since the price is at your average cost, you break even and lose nothing.
After E-4 (100% owned), you move your Stop-Loss to S-L-4.
The S-L-4 price is set at your new, higher average purchase price for the entire 100% position.
If the price hits S-L-4, you sell 100%. Again, you break even and lose nothing.
3. The Profit Target:
You sell your entire 100% position for profit at the final target price: S-0.
In simple terms: You keep buying as the price goes up. After each major purchase, you move your stop-loss to the price you paid on average, locking in a "no-loss" scenario. Your only goal is to reach the high-profit target (S-0) without being stopped out at breakeven.
* This is for educational purposes only and is not investment advice
Bitcoin | H1 Double Bottom | GTradingMethodHello Traders.
Welcome to today’s trade idea by GTradingMethod.
🧐 Market Overview:
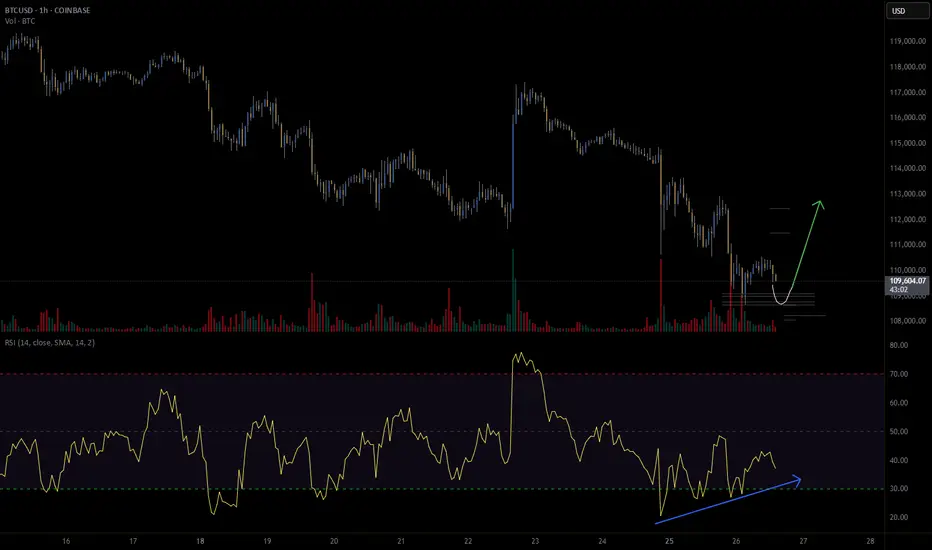
Bitcoin is trending lower while the RSI is forming higher lows, creating positive RSI divergence — a bullish signal. I’ll be watching for the hourly candle to close within range alongside confirmation from other GTradingMethod indicators before entering.
📊 Trade Plan:
Risk/Reward: 3.1
Entry: 109,104
Stop Loss: 108,234
Take Profit 1 (50%): 111,494
Take Profit 2 (50%): 112,453
💡 GTradingMethod Tip:
RSI divergence can often signal a momentum shift before price action confirms the move.
🙏 Thanks for checking out my post!
Make sure to follow me to catch the next idea and share your thoughts — I’d love to hear them.
📌 Please note:
This is not financial advice. This content is to track my trading journey and for educational purposes only.
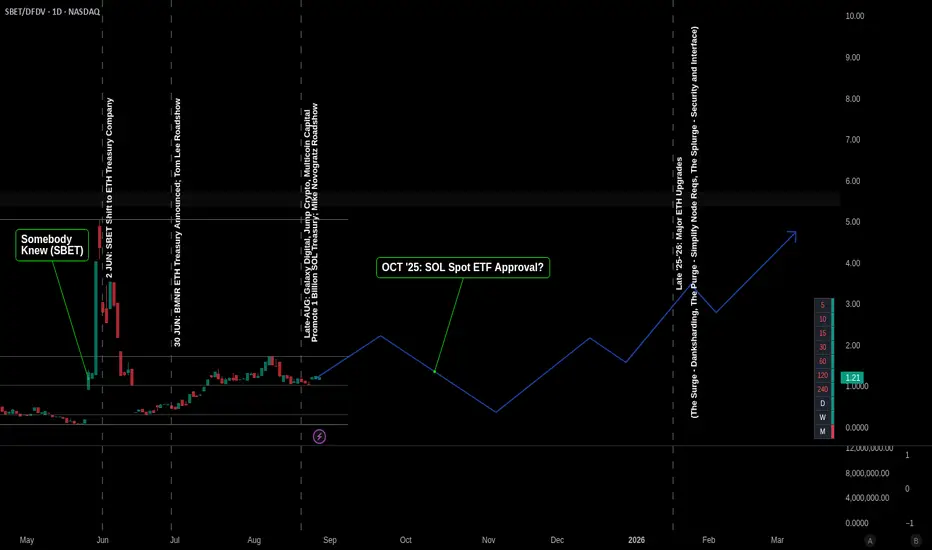
SBET vs DFDV: Which Crypto Treasury Horse Will Run Fastest?SharpLink Gaming (SBET) and DeFi Development Corp. (DFDV) are prime examples of the MicroStrategy model applied to different digital assets, Ethereum and Solana, respectively.
SharpLink Gaming, formerly an online gaming company, has made a dramatic and public pivot to become one of the world's largest corporate holders of Ether (ETH). Its strategy is to act as a direct and transparent vehicle for investors to gain exposure to the Ethereum ecosystem. The company actively raises significant capital through equity offerings, such as its recent multi-billion dollar ATM program, to fund its ETH acquisitions. It also generates yield by staking its ETH, which is a key part of its business model. The company's stock price and market narrative are now almost exclusively tied to the performance of its growing ETH treasury, making it a high-beta proxy for Ethereum.
DeFi Development Corp. has a similar, dedicated focus on Solana (SOL). The company's business is centered on accumulating, compounding, and providing exposure to SOL. DFDV's core strategy is to grow its "SOL per share" metric, which is its equivalent to MicroStrategy's Bitcoin per share. To achieve this, DFDV also engages in aggressive capital raises. Like SharpLink, it also generates revenue by actively participating in the ecosystem through staking, operating its own validator nodes, and exploring other on-chain opportunities.
In essence, both companies have fundamentally transformed their business models to serve as publicly-traded, regulated treasury vehicles for their respective assets. They both use financial engineering, like capital raises, to grow their holdings and create a leveraged play for investors. The primary difference is the underlying asset—ETH for SBET and SOL for DFDV—and the specific ecosystem activities they engage in to generate additional value beyond simple price appreciation.
Market Cap
Comparing the market capitalization of Ethereum (ETH) and Solana (SOL) is crucial for understanding the capital flows needed for one to outperform the other. As of late August 2025, ETH's market cap is approximately $429 billion, while SOL's is about $87 billion, meaning ETH is nearly 5 times larger.
For SOL to outperform ETH, it must grow at a much faster rate. Due to its smaller size, SOL requires a proportionally smaller amount of new capital to achieve a significant price increase. For example, to close the market cap gap by 10%, SOL would need an additional $43 billion in inflows, which would cause its price to more than double. In contrast, for ETH to achieve the same proportional gain (e.g., a 10% increase), it would need over $40 billion in new capital inflows.
Essentially, SOL has a higher beta and a lower monetary hurdle to achieve significant percentage gains. A steady inflow of tens of billions of dollars would have a much more dramatic impact on SOL's price than on ETH's. However, with ETH's sheer size and institutional backing, particularly with the recent launch of spot ETFs, it can absorb and channel much larger capital flows, which is a key reason its price is less volatile. Therefore, SOL's smaller size makes it more sensitive to inflows, making it easier for it to outperform ETH on a percentage basis, especially during a retail-driven bull market.
Impact of Spot ETFs
A significant number of spot Ethereum ETFs have already been approved and are trading in the United States. Following the approval of the initial 19b-4 filings in May 2024, the SEC subsequently declared several S-1 registration statements effective in July 2024, allowing the ETFs to begin trading. There are currently nine SEC-approved spot ETH ETFs from major issuers like BlackRock, Fidelity, and Grayscale. There are currently no approved SOL spot ETFs in the United States. However, several applications are under active consideration by the SEC. Filings from major issuers such as Bitwise and 21Shares have been submitted, but the SEC has consistently delayed its decision on them. There is a general expectation that if the SEC continues to follow the precedent set by Bitcoin and Ethereum, a Solana ETF could be the next in line for approval. In summary, a clear distinction exists: ETH spot ETFs are a reality, with multiple products already trading, while SOL spot ETFs are still in the application and review phase, awaiting a decision from the SEC.
Summary
While ETH has had relative outperformance in August 2025 against Bitcoin and most large-cap alts, the approval of Solana spot ETFs will provide a significant tailwind for SOL and SOL treasury companies like DFDV. While Ethereum is the strongest horse among the alts, has experienced no downtime, and gas fee transactions on the main chain have become much cheaper than they were the last cycle, hot money will quickly allocate capital towards the highest-beta alts and crypto treasury companies as ETFs are approved; possibly on a rolling basis if underlying assets are approved at different times in Q4. However, expect ETH and SBET to do exceptional through 2026 as ETH hits mainstream adoption through ERC-20 based tokenized stocks, prediction markets, etc. and as spot ETF inflows accelerate.
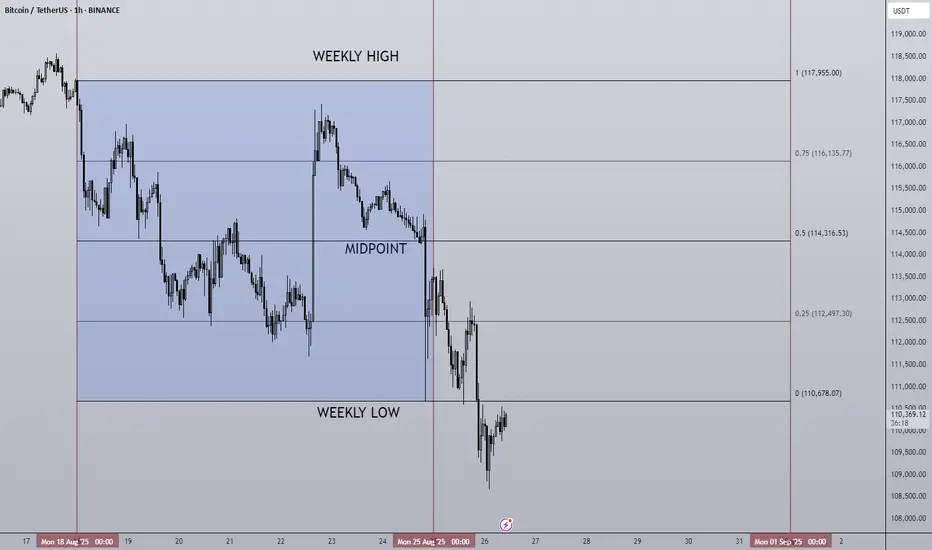
25/08/25 Weekly OutlookLast weeks high: $117,955
Last weeks low: $110,678.07
Midpoint: $114,316.53
This weekly outlook is a day late due to a public holiday but what happened last week is clear. A sell-off from Monday all the way until Sunday and as suggested in the last weeks outlook the $108,000-$111,000 level did provide the support BTC bulls were looking for, after a 6.2% drop from high to low despite a Friday rally thanks to the FED chairs speech.
Looking at the chart it is in my opinion not ideal for the bulls, my reasoning for this:
August/September seasonality coming into play. Historically a poor return in this period of the year.
Heavy sell-off despite good macro news implies exhaustion on the buy side.
Monthly close towards the end of this week, window dressing/de-risking takes place and increases the sell-side pressure.
Daily bearish structure confirmed with new lower high and lower low set.
So what does this mean for this week? Locating an area on the chart I'd like to see BTC strength from,. For me that would be 1D 200 EMA level at ~$103,000. Since September 2023 BTC has used the 1D 200 EMA as a springboard for each of its rallies and so for this bullrun to continue price must continue to respond positively off the level. The RSI would have likely reached oversold adding confluence to potential Long entries.
In a bullish scenario we could see the weekly low get reclaimed, this has routinely happened in the past and often leads to a test of the midpoint, this would be a good short term play but my gut says the overall higher timeframe (next month) is continued sell-off.
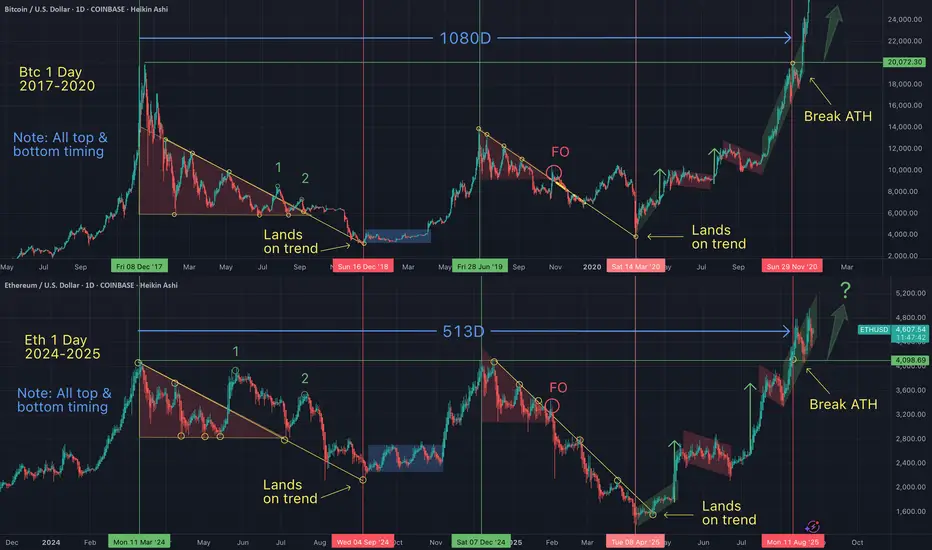
Eth - These chart patterns are repeating over & over If we learn to identify common patterns we will note that they are occuring over and over...on every asset (that has a chart)...on every timeframe. When in doubt, zoom out.
I can help you see the matrix.
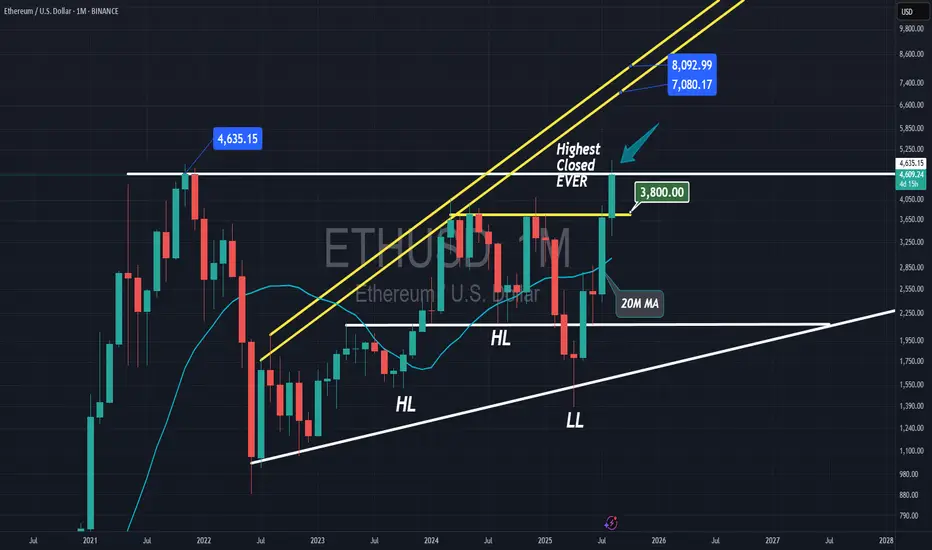
ETHEREUM highest monthly CANDLEEthereum aims to close its highest monthly candle above $4,635, strongly bullish.
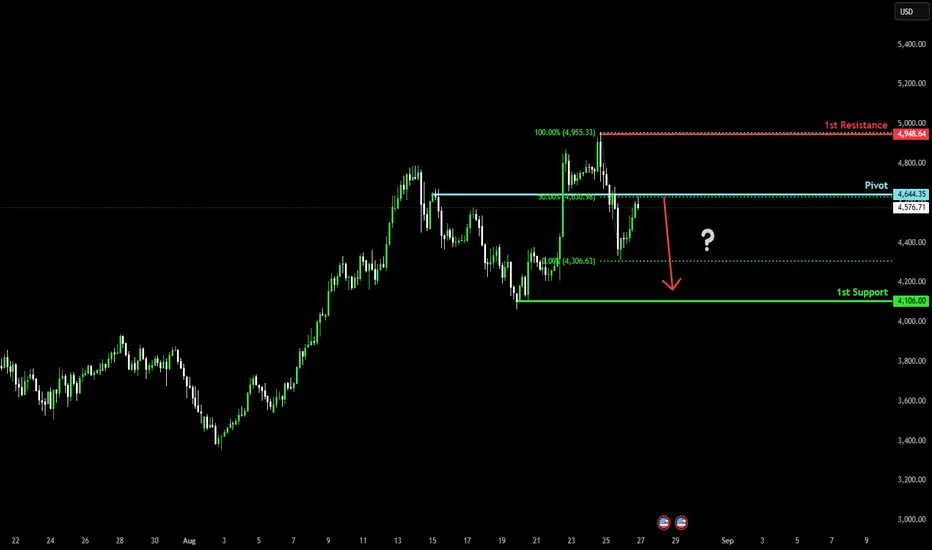
Bearish reversal off 50% Fibonacci resistance?Ethereum (ETH/USD) is reacting off the pivot which is a pullback resistance that aligns with the 50% Fibonacci retracement and could drop to the swing low support.
Pivot: 4,644.35
1st Support: 4,106.00
1st Resistance: 4,948.64
Risk Warning:
Trading Forex and CFDs carries a high level of risk to your capital and you should only trade with money you can afford to lose. Trading Forex and CFDs may not be suitable for all investors, so please ensure that you fully understand the risks involved and seek independent advice if necessary.
Disclaimer:
The above opinions given constitute general market commentary, and do not constitute the opinion or advice of IC Markets or any form of personal or investment advice.
Any opinions, news, research, analyses, prices, other information, or links to third-party sites contained on this website are provided on an "as-is" basis, are intended only to be informative, is not an advice nor a recommendation, nor research, or a record of our trading prices, or an offer of, or solicitation for a transaction in any financial instrument and thus should not be treated as such. The information provided does not involve any specific investment objectives, financial situation and needs of any specific person who may receive it. Please be aware, that past performance is not a reliable indicator of future performance and/or results. Past Performance or Forward-looking scenarios based upon the reasonable beliefs of the third-party provider are not a guarantee of future performance. Actual results may differ materially from those anticipated in forward-looking or past performance statements. IC Markets makes no representation or warranty and assumes no liability as to the accuracy or completeness of the information provided, nor any loss arising from any investment based on a recommendation, forecast or any information supplied by any third-party.
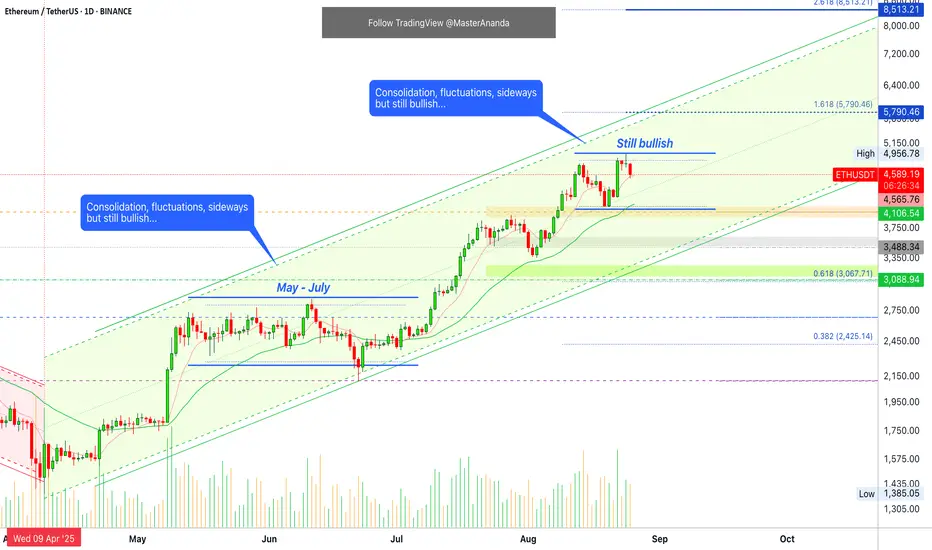
Ethereum · Crash or Higher?I see Ethereum and I look at Ethereum and all I see is rising prices. I can see the potential for a retrace and the bearish signals short-term but still, all I see is rising prices and a rising trend, it will continue.
Here we have a very strong rising trend and it seems Ether is peaking. There was a high 10 days ago and now we are seeing a double-top. Yesterday was a new all-time high and the candle ended with a small real body and large upper wick. This can be read as bearish but also as resistance being challenged.
Trading volume is standard for a continuation. All general signals are bullish. The trend is bullish. The market tendencies are bullish. The sentiment is bullish, etc.
Between May and July we had a period of sideways action, two months. Something similar can happen but instead of two months, two weeks or four weeks. I believe this one will be shorter than the last.
Prices can drop just to recover the next day. Prices can continue rising without a drop. It is hard to predict the very short-term.
Ethereum is bullish on all timeframes and no signals point to a top being present.
The day with high bearish volume 14-August was matched by a day of high bullish volume 22-August. So the market remains positive on the upside. The market bias continues bullish.
Ethereum is bullish long-term, and we expect to continue rising as long as the action is happening above $4,100. If it moves below, we will rethink.
Thank you for reading.
Namaste.
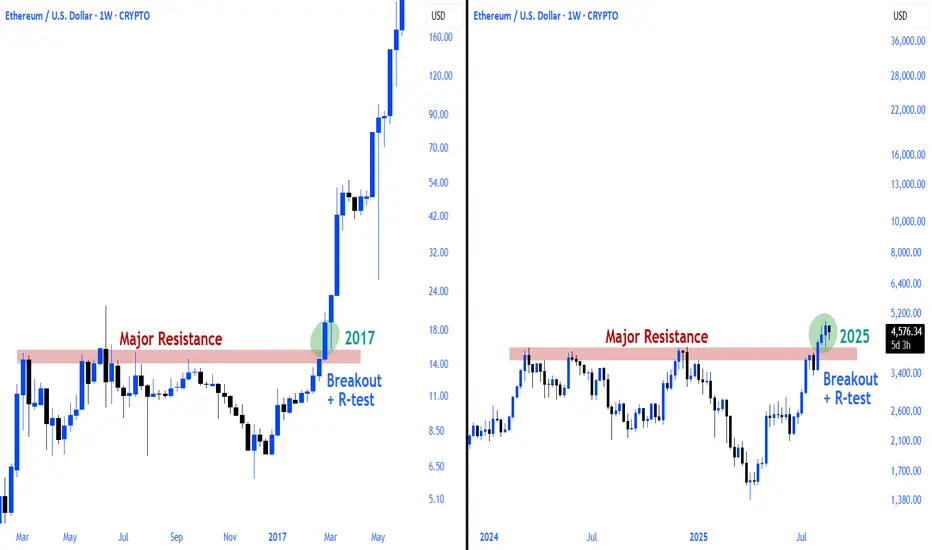
Zoom out Ethereum $ETHEthereum seems to be repeating the process that started the 2016-2017 mega run.
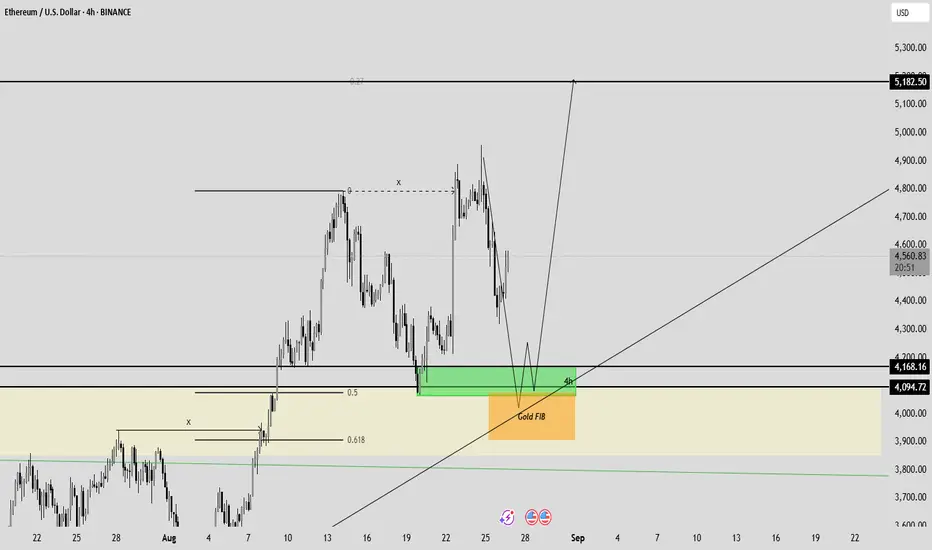
ETH Long Setup 4000$ was a resistance and its now support so he come 1 time back we hit ATH and now we come back for the final Move much conflunce Trendline FiB engulf lets go
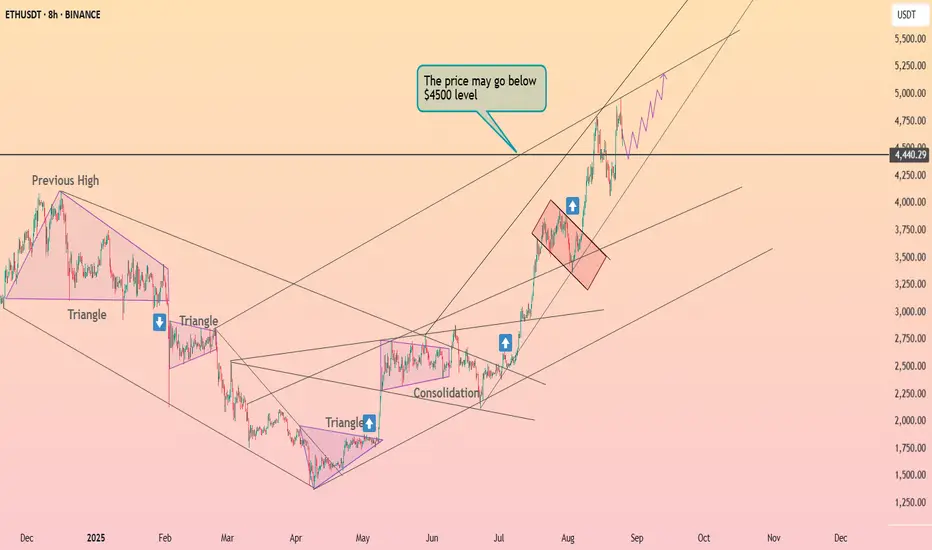
Ethereum above the $4400 ┆ HolderStatBINANCE:ETHUSDT on the 1D chart is consolidating after a steep rally from triangle breakouts. Price action is hovering above $4,440, with potential to briefly dip below $4,500 before recovering higher. As long as $4,400 holds as support, the broader bullish channel targets remain at $5,000–5,200.
ETH 4H Analysis – Key Triggers Ahead | Day 3💀 Hey , how's it going ? Come over here — Satoshi got something for you !
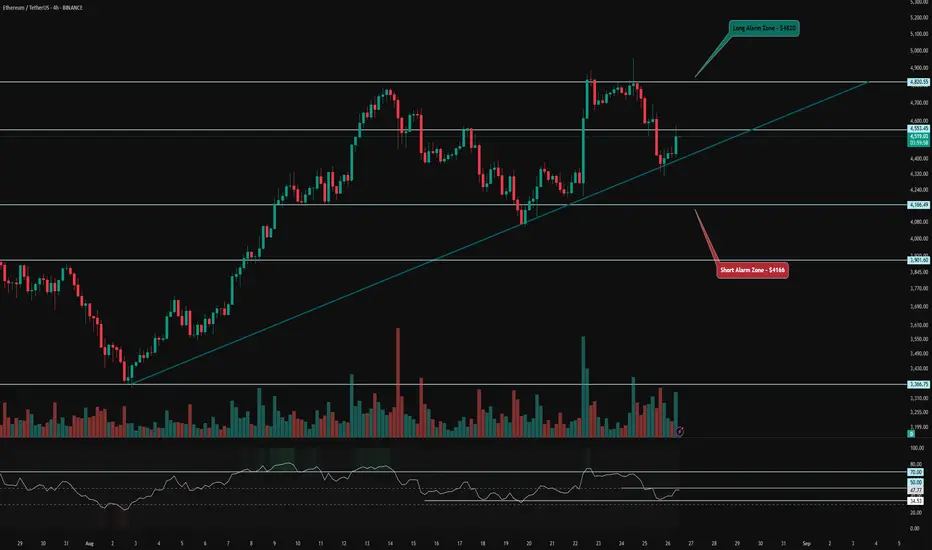
⏰ We’re analyzing ETH on the 4-hour timeframe timeframe .
👀 We’re observing the 4-hour Ethereum chart, and ETH is trading within a 4-hour box. The ceiling of this box is at the $4,820 level, and the floor is at $4,166. The floor was once faked out, showing a reaction toward the ceiling but got rejected from this area. Buyer makers have kept the price near the midline of the box. A trendline has been drawn from the box’s lower level, and each time ETH hits this trendline, it has shown an upward reversal. Breaking and holding above the midline of the box could push ETH toward the ceiling, with the midline acting as an early trigger .
⚙️ Key RSI levels are at 50 and 70. With increased volatility, long trades on Ethereum could drive it upward, and crossing the 50 level could push ETH’s price into the upper part of the box, giving it another chance to test breaking the 70 level and setting a new high. If rejected and this scenario fails, ETH could experience a deep correction, as it hasn’t entered oversold territory or seen a deep correction for several days .
🕯 The size and volume of green candles have increased compared to red candles, which prevents a deep correction in ETH. However, yesterday in ETFs, people bought a significant amount of Ethereum, and this weakness in the corrective trend suggests that ETH has a stronger tendency to rise and climb .
🪙 We’re observing the 4-hour ETH/BTC index chart, and ETH has a strong support level against Bitcoin at 0.03972, where increased volume triggered a reversal. There’s also a resistance level at 0.04275, and breaking this level with increased volume and RSI entering overbought territory could confirm a long trade for ETH .
🔔 Our trading alarm zones for ETH positions are at $4,820, where breaking this level could signal a long position. An early trigger for a long trade could be at $4,553, where breaking this level increases the likelihood of breaking the ceiling of the 4-hour box. The short trade alarm zone is at $4,166, where breaking this level could initiate a deep correction for ETH .
❤️ Disclaimer : This analysis is purely based on my personal opinion and I only trade if the stated triggers are activated .
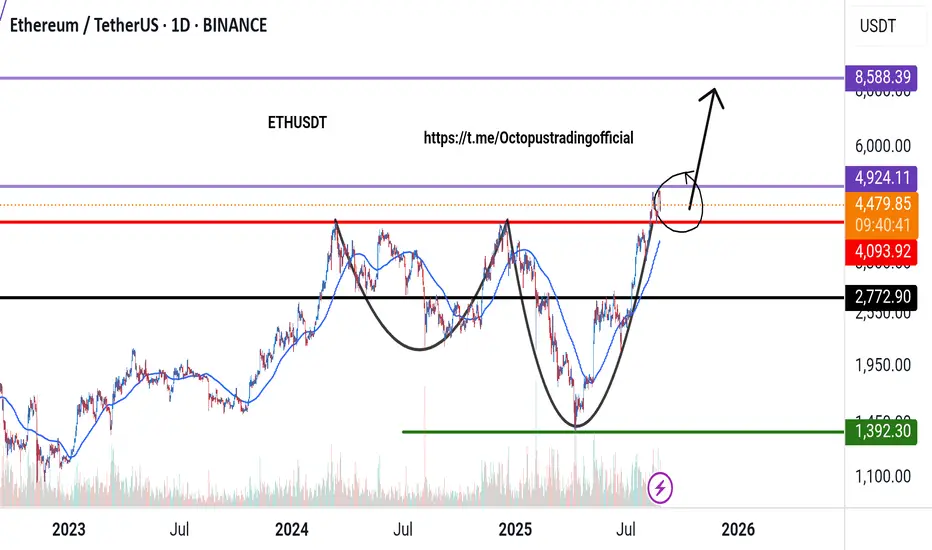
ETHUSDT ETHEthereum has shown bullish strength in recent weeks and has formed several positive patterns. I believe it will target the $8,500 level after breaking the top at $4,900.
HYPE Swing Long IdeaHYPE Swing Long Idea
📊 Market Sentiment
Overall sentiment remains bullish, supported by expectations of a 0.25% rate cut in the upcoming FOMC meeting. A weakening USD and increasing global risk appetite are creating favorable conditions for further upside in crypto assets.
📈 Technical Analysis
HYPE is showing relative strength compared to other crypto assets.
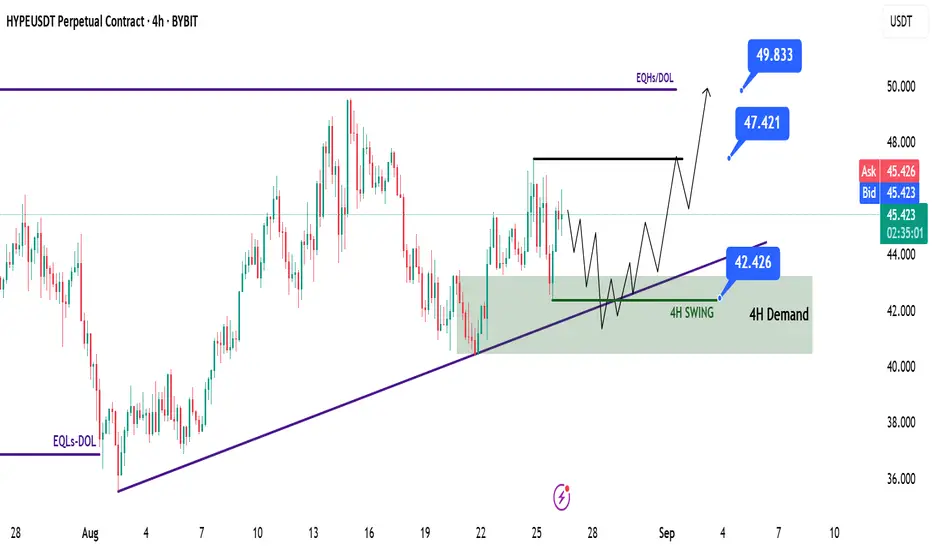
Price bounced from the bullish trendline, forming a 4H demand zone.
It tapped into this 4H demand zone again and found support, confirming buyers’ interest.
📌 Game Plan
I will be watching for a return to the 4H demand zone and a run of the first tap at $42.4 to initiate a potential all-time high move.
I will also be looking for either a tap or deviation from the bullish trendline, followed by a close back above it.
🎯 Setup Trigger
I will be waiting for a 4H–1H market structure shift before entering the trade.
📋 Trade Management
Stoploss: 4H–1H swing low confirming the BOS
Targets:
TP1: $47.4 – Internal High
TP2: $49.8 – All-Time High
💬 Like, follow, and comment if you find this setup valuable!
⚠️ Disclaimer: This content is for informational and educational purposes only and does not constitute financial, investment, or trading advice. Always do your own research before making any financial decisions.
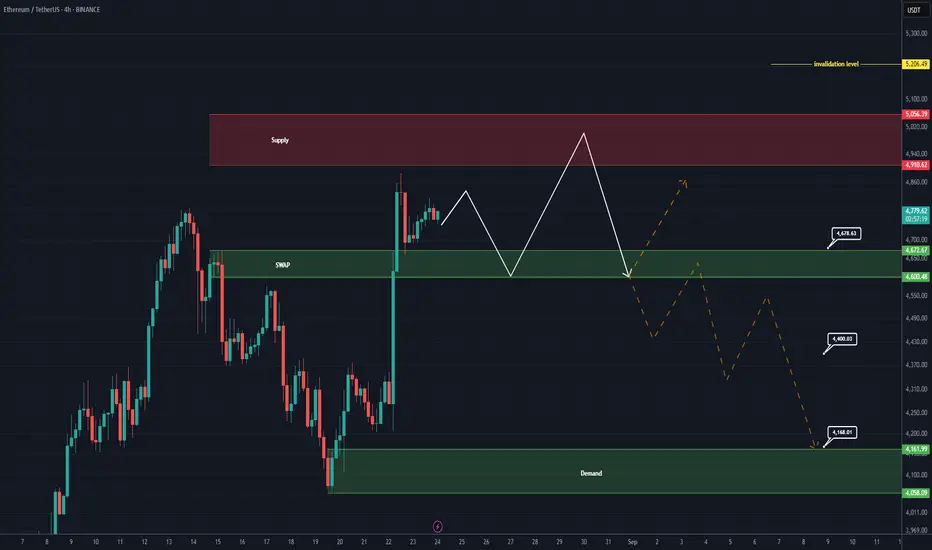
Ethereum New Analaysis (4H)Now, Ethereum may face a serious correction after making one more high. So pay close attention to the $4900–$5000 zone.
For this bearish scenario to play out, the SWAP zone on the 12H or daily timeframe must be broken and price must hold below it.
A daily candle closing above the invalidation level would nullify this analysis.
For risk management, please don't forget stop loss and capital management
When we reach the first target, save some profit and then change the stop to entry
Comment if you have any questions
Thank You
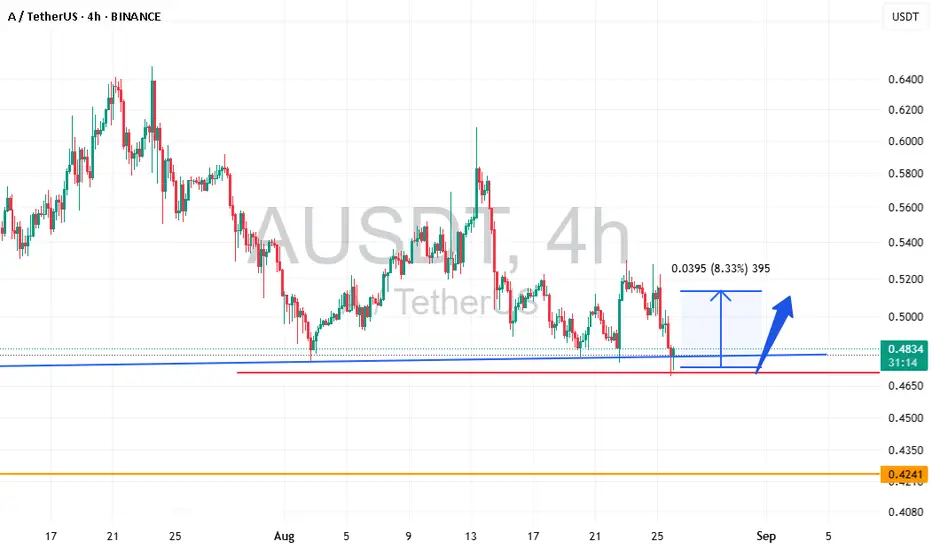
AUSDT bulish This AUSDT currency has reached the oversold area and should experience a growth of at least 8%. In this strategy, I buy spot and wait for the target. The win rate of this strategy is above 80%. If the next stage drops further, I will enter with 2 times the volume, which happens in one out of every 8 transactions. Capital management is the main pillar of trading.
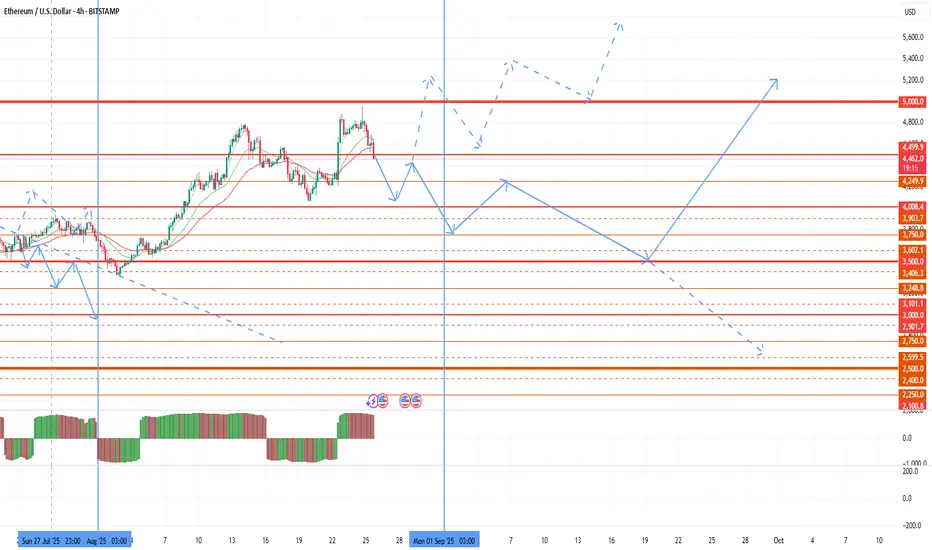
Attention, seasonal sales!Today we have moved on to the seasonal sales period, and I want to review the market situation once again. As I wrote in my last review, in order to continue active trading, I am waiting for another delisting and assignment of the monitoring tag, after which we can identify more reliable and attractive tools for speculators. However, this year binance continues to make the footsteps. After ether's growth was too fast to form a trend, a significant pullback was prevented in July. This prevents further purchases and consolidation above 5k. At the same time, there was no delisting and assignment of the monitoring tag, which preserves the threat of drawdown for altcoins and reduces the activity of buyers. As a result, the seasonal August purchases were repaid.
The next seasonal wave of market growth is from the end of September to the beginning of November. In the next three weeks, it is worth preparing for a bear attack and, hopefully, another assignment of the monitoring tag, after which it will be possible to identify altcoins that are safe for operation.
Before the closing of the current monthly candle, there is still a possibility of the last bull attack in the second half of the week with a possible 5k takeover, however, only with a clear signal, which may be negative data on US GDP or a sharp rise in brent oil above $ 70 followed by a breakout of the last monthly candle for EUR/USD. But for now, for 3-4 weeks, the probability of a retest of 3500 on ether prevails at least, followed by a resumption of growth from the end of September if the bulls hold 3500.
As expected, fan tokens have shown themselves to be the most interesting and confident in such a market picture due to strong oversold conditions, but today I have also finished work with them before the likely seasonal decline.
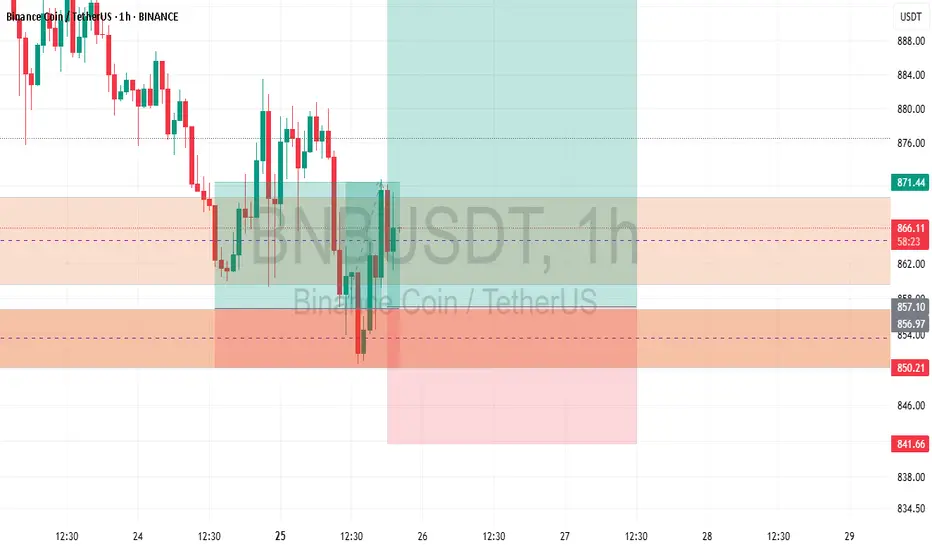
BNB tuched its TPThe first position reached its target with reward 2
Please go and see the previous analysis.
I am waiting for a new high to be recorded
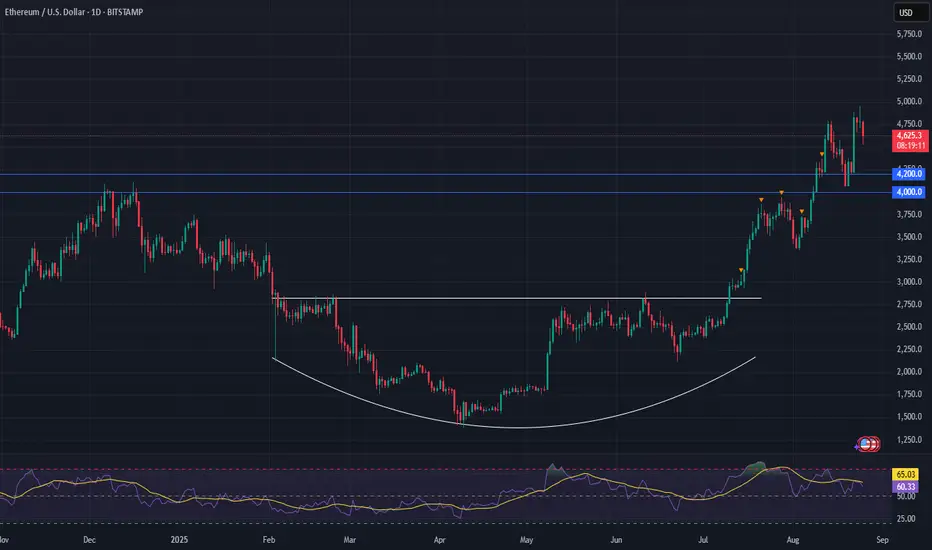
Ethereum Breaks $4K — Eyes on $5K and BeyondEthereum has been the top-performing asset since the April 7 low, breaking through resistance and solidifying its position as the backbone of the stablecoin ecosystem. The trend remains firmly bullish as long as ETH continues its pattern of higher highs and higher lows.
The breakout above the $4,000–$4,200 zone turned former resistance into new support, giving bulls the upper hand. Momentum now shifts toward retesting the former all-time high region at $4,800–$5,000, with upside potential extending into the next cycle.
📈 Technical Highlights:
✅ Short-term resistance: $4,800–$5,000 (former ATH)
✅ Medium-term target: $7,000 baseline
✅ Extended objective: $8,000 possible
🛡️ Key support: $4,000–$4,200 (new floor)
📣 Takeaway:
Ethereum’s structure remains a textbook bullish setup. As long as it holds above $4,000, the path favors further upside. Breakouts above $5,000 could fuel the next leg higher, while current levels may offer strong opportunities for trend-followers and long-term investors.
#Ethereum #ETH #Crypto #Trading #TechnicalAnalysis #EthereumPrice #Bullish #CryptoTrading #Altcoins #Breakout
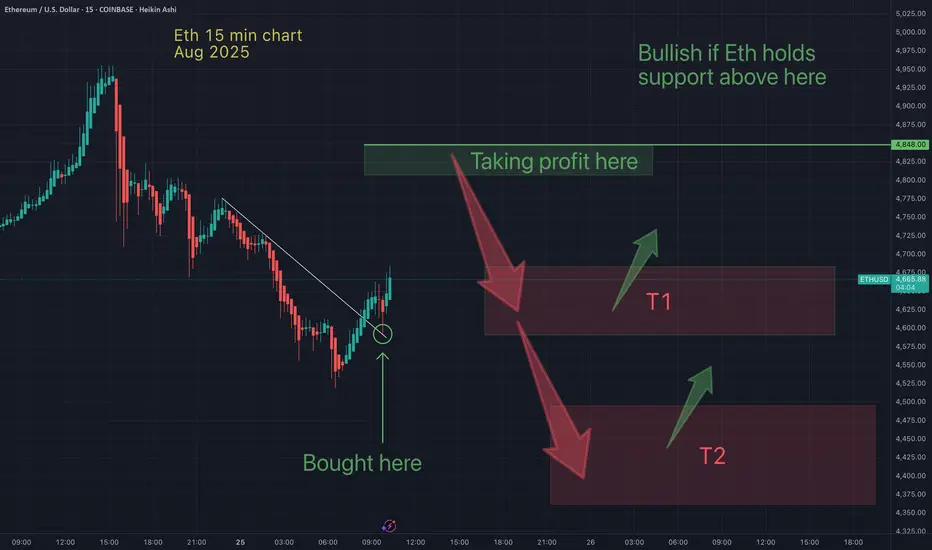
Did Eth just bottom? My Eth take profit targets.Did Eth just bottom. My guess is that was a local bottom. But I wouldn't be surpresed if Eth gets a lower low. I hope I wrong, but if we do get another lower low, that would be an ideal entry point for me.
May the trends be with you!
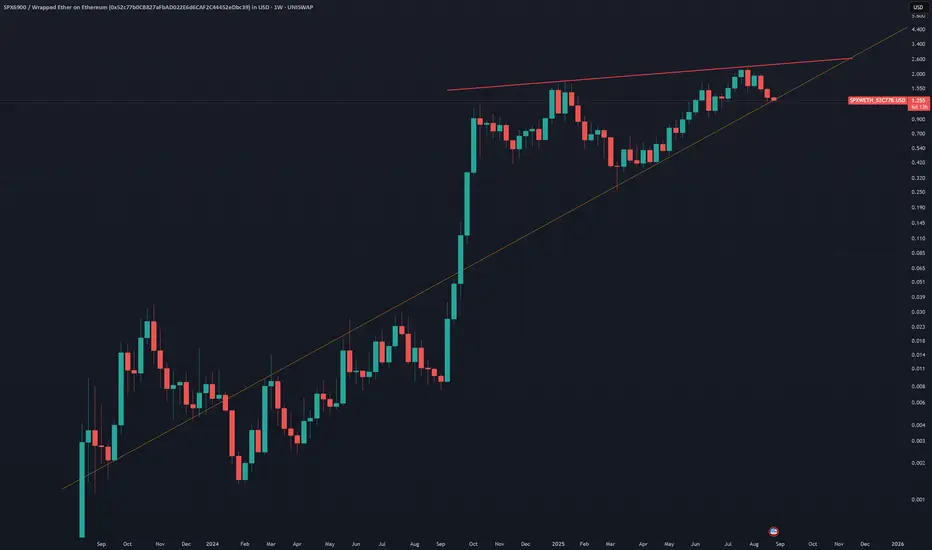
SPX 6900 looking weak , big drop coming?SPX has been a monster for most of 2025 but now showing signs of weakness , weekly lower high trend was the first warning.
Now formed massive rising wedge would be careful with this for now wait until its under one dollar to pick up some more.
This trendline is very important , see how the monthly closes on this one.