ETH - Gives you another chanceETH ~ 3946 good for the last move to 4950 i shall say this is a good place for DCA!
D-ETH
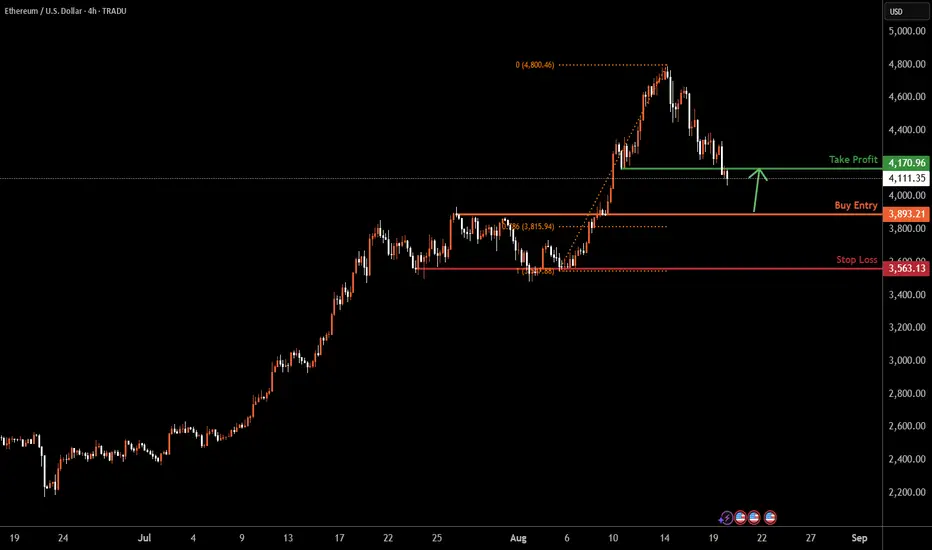
ETHUSD H4 | Bullish bounce off pullback supportEthereum (ETH/USD) is falling towards the buy entry of 3,893.21, which is a pullback support that is slightly above the 78.6% Fibonacci retracement and could bounce to the take profit.
Stop loss is at 3,563.13, which is a multi-swing low support.
Take profit is at 4,170.96, which is a pullback resistance.
High Risk Investment Warning
Trading Forex/CFDs on margin carries a high level of risk and may not be suitable for all investors. Leverage can work against you.
Stratos Markets Limited (tradu.com ):
CFDs are complex instruments and come with a high risk of losing money rapidly due to leverage. 65% of retail investor accounts lose money when trading CFDs with this provider. You should consider whether you understand how CFDs work and whether you can afford to take the high risk of losing your money.
Stratos Europe Ltd (tradu.com ):
CFDs are complex instruments and come with a high risk of losing money rapidly due to leverage. 66% of retail investor accounts lose money when trading CFDs with this provider. You should consider whether you understand how CFDs work and whether you can afford to take the high risk of losing your money.
Stratos Global LLC (tradu.com ):
Losses can exceed deposits.
Please be advised that the information presented on TradingView is provided to Tradu (‘Company’, ‘we’) by a third-party provider (‘TFA Global Pte Ltd’). Please be reminded that you are solely responsible for the trading decisions on your account. There is a very high degree of risk involved in trading. Any information and/or content is intended entirely for research, educational and informational purposes only and does not constitute investment or consultation advice or investment strategy. The information is not tailored to the investment needs of any specific person and therefore does not involve a consideration of any of the investment objectives, financial situation or needs of any viewer that may receive it. Kindly also note that past performance is not a reliable indicator of future results. Actual results may differ materially from those anticipated in forward-looking or past performance statements. We assume no liability as to the accuracy or completeness of any of the information and/or content provided herein and the Company cannot be held responsible for any omission, mistake nor for any loss or damage including without limitation to any loss of profit which may arise from reliance on any information supplied by TFA Global Pte Ltd.
The speaker(s) is neither an employee, agent nor representative of Tradu and is therefore acting independently. The opinions given are their own, constitute general market commentary, and do not constitute the opinion or advice of Tradu or any form of personal or investment advice. Tradu neither endorses nor guarantees offerings of third-party speakers, nor is Tradu responsible for the content, veracity or opinions of third-party speakers, presenters or participants.
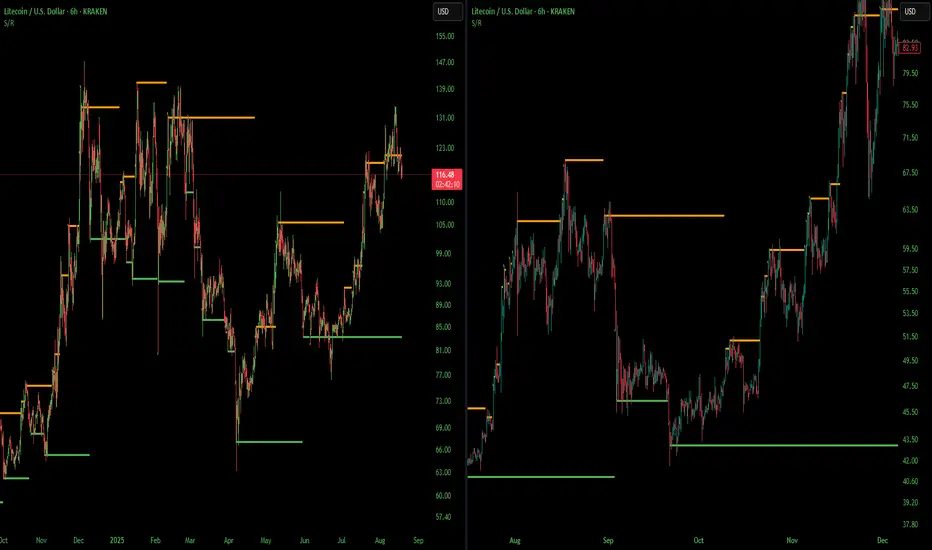
Not Exact But Man Does It Look Similar LTCUSDI had pointed this out in a previous chart but i thought I would zoom in and show how similar these look. I think its launch time, last time LTC was at this point it did a 10x in a month. Alt season starts when Litecoin says so. Not financial advice just my opinion. Thank you
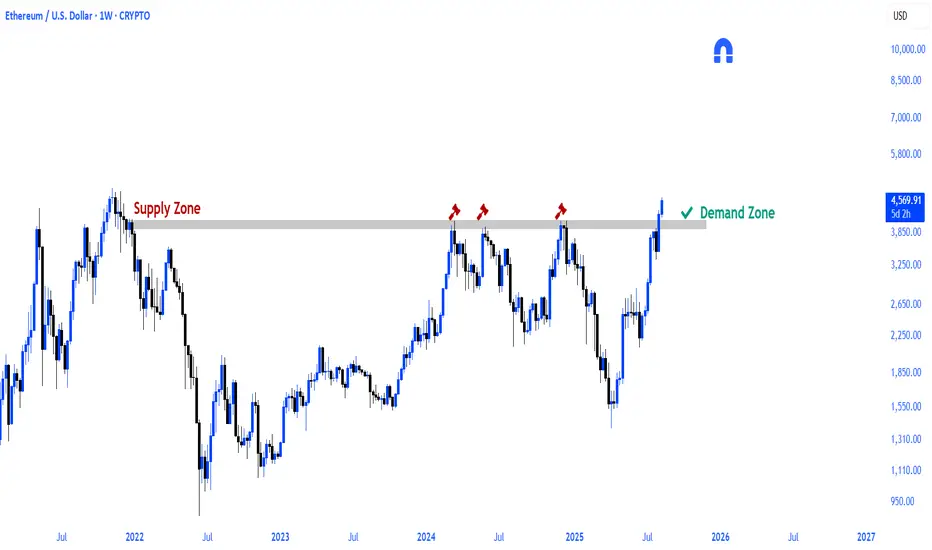
ETHEREUM PARABOL SEASON CODED!
CRYPTOCAP:ETH The 190-week major resistance (supply zone) has been broken, and the current zone will now function as a (demand zone.)
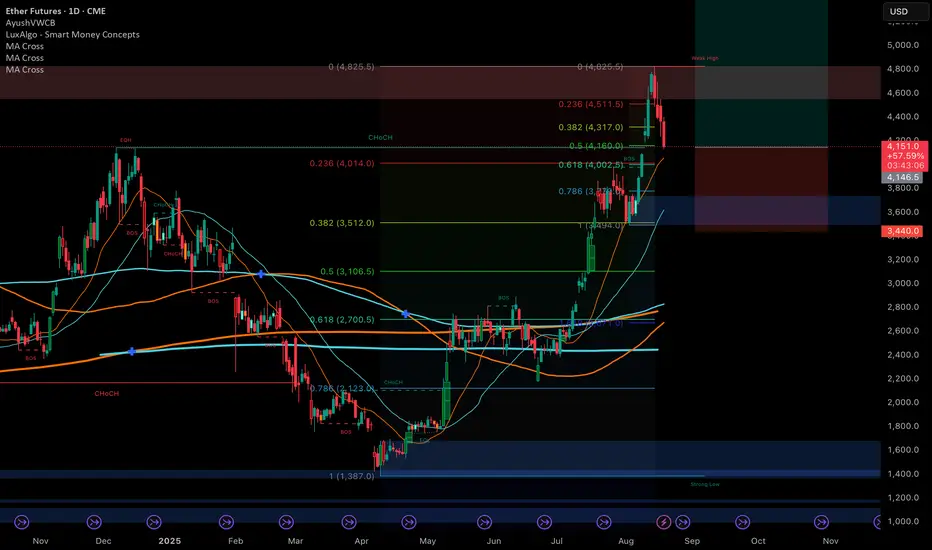
ETHUSD - Expect a bounce ... now? lets go above ATHLong time no see !
I was in vacations with the cult of the CME Gap that I joined
Soooo, Eth took some logic profits, it was a quasi straight line from 2400 to 4800 (not mentionning that its coming before from under 1500), a 10% correction is totally ok
we are actually in the middle of the last CME GAP, its filling daddy
Dec 2024 high
100 MA 4H
0.5 fib resistance from last low
0.236 is 4K so we still have room to be in denial if it dips more
as you can see thats a lot of convergences, not even talking about BTC, BTC.D, USDT.D, GOLD and all the other tickers aligning perfectly for the big ritual of the big last leg of the big bull run (B.R.B.L.L.B.B.R.) (I know how to make it since those vacations)
Sooo SL is slightly under first bullish Order Block that u can see in this chart @ around 3440, yes sry I can't mess with the levs even with this perfect entry opportunity
TP1 : 7000
TP2 : 9000
TP3 : 11000 (0.618 fib extension)
Will update the TPs if momentum changes
XX
not advise
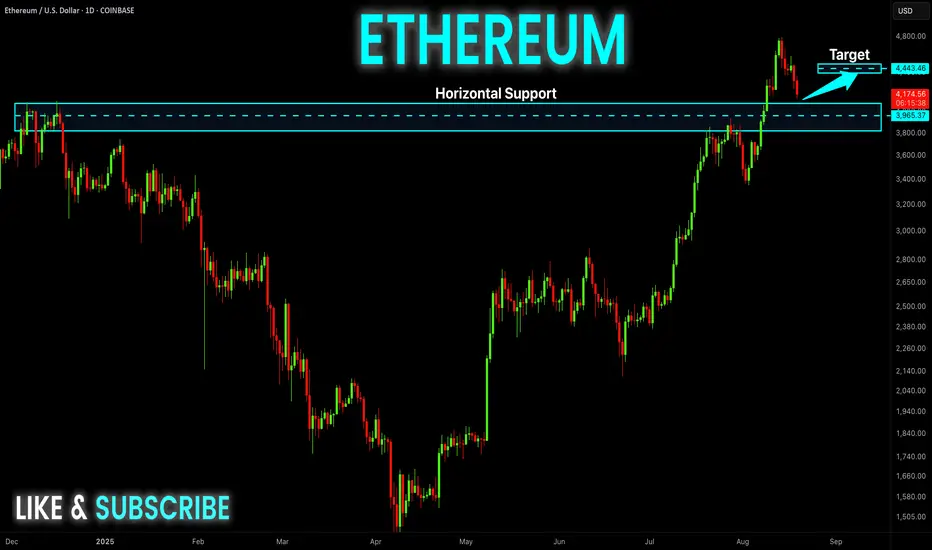
ETHEREUM Strong Support Ahead! Buy!
Hello,Traders!
ETHEREUM is falling down
Now but as it is trading in a
Strong uptrend we are
Bullish biased so after it
Hits the strong horizontal
Support level below at 4,000$
A strong bullish rebound
Is to be expected
Buy!
Comment and subscribe to help us grow!
Check out other forecasts below too!
Disclosure: I am part of Trade Nation's Influencer program and receive a monthly fee for using their TradingView charts in my analysis.
ETH daily chart possible scenarioLooks like we heading towards 3900 strong support zone in coming days and bounce toward new ATH 5k+ in couple weeks. Any thoughts?
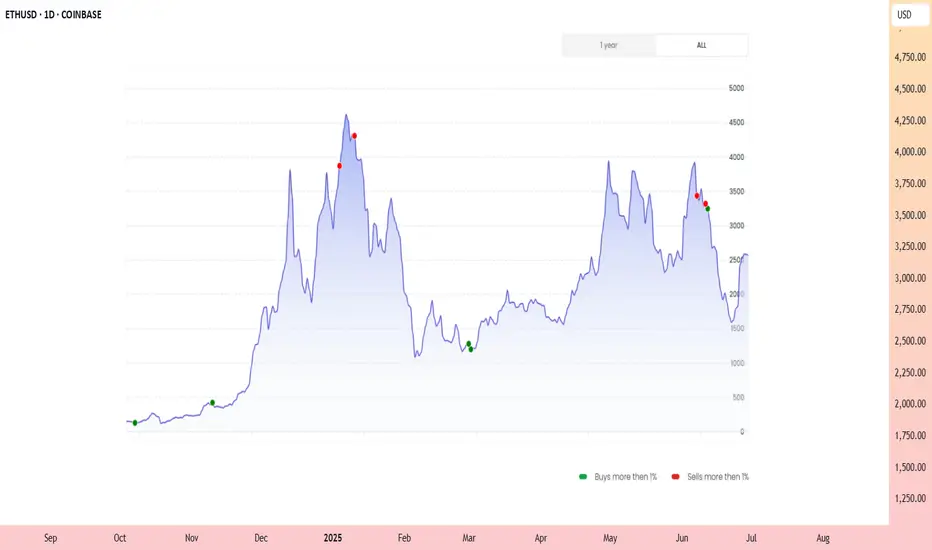
The altcoin season begins with Ethereum ┆ HolderStat🔁 Wallet 0xc005…5f7 rotated via Binance: sent 851k USDT to the exchange, then withdrew 116.68 ETH (~$515k) back day later. DefiLlama shows ETH/L2 net inflows outpacing stable hoarding today—classic risk-on rotation. Expect on-chain deployment into majors or high-liquidity blue-chip alts next.
🔝 Score: 21 | Balance: ~$500k | Results: $49.3k→$756.5k (+1,535%, 16 trades; avg buy $830 / sell 3,613; age 67m; rating 136).
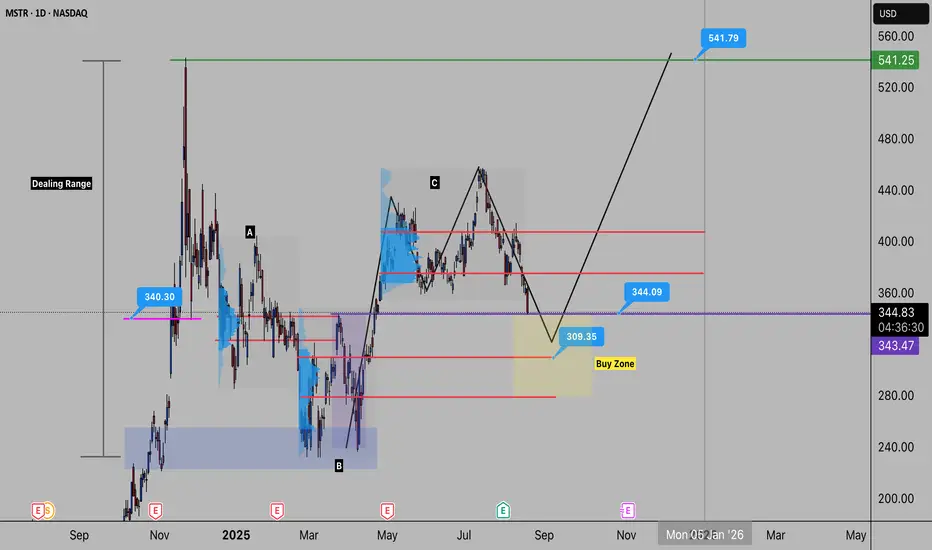
Buy the F out of MSTR? - Bullish IdeaI’m watching MicroStrategy (MSTR) closely here — the chart is setting up for what looks like a strong bullish opportunity.
(the content below is documenting the chart from left to right)
🔎 Key Observations
Demand Zone: Back in August 2024, price reacted strongly from the $225 zone, rallying ~100%. Clear evidence of institutional demand.
Current Structure: Price has been ranging between $225 – $550. The midpoint zone (~$325–$375) is where the most important reactions are likely to form.
Volume Zones:
Zone A → Already tested.
Zone B → Untested, showing potential bullish reaction.
Zone C → Looks bearish on the surface, but could be a manipulation zone (push down to fill institutional orders).
Liquidity Sweep: The purple zone shows price ran weekly highs, reversed, then closed back above — a classic liquidity grab, suggesting institutions may defend this area.
🧩 Market Structure & Pattern
Structure shows a bullish impulse with a crab pattern forming.
Completion expected around 50–61.8% retracement, possibly as deep as 78.6%.
Buy zone of interest: $325.
🎯 Trade Plan
Entry Zone: $325 area.
Targets:
First resistance: $375–$400 (must clear here).
Final target: $550.
Bias: Bullish, holding for continuation higher as long as $225 remains protected.
✅ To summarize: I’m bullish on MicroStrategy here. Watching for a buy reaction around $325 with a target of $550. Price will need to prove itself through the $375–$400 zone before continuation.
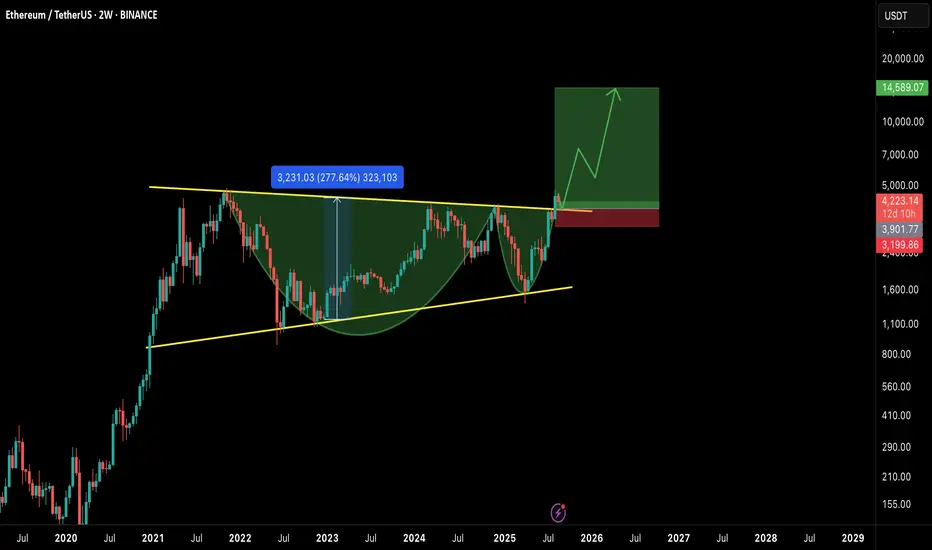
ETH/USDT – Mega Breakout on Higher Timeframe!Ethereum has confirmed a massive breakout on the 2W timeframe, breaking through a multi-year cup & handle and also ascending triangle formation. This is one of the strongest bullish continuation patterns and could fuel ETH into a new long-term rally. 🚀
📊 Chart Analysis
Pattern: Cup & Handle on the 2W chart.
Breakout Zone: Around $4,000–$4,300, now acting as support.
Measured Move Target: ~$14,500 (based on cup depth).
Stop Loss Zone: ~$3,200 (below major support).
✅ Bullish Factors
Multi-Year Accumulation: ETH has spent years consolidating below $4K, and this breakout confirms strength.
High R:R Setup: Risk is limited while the potential upside is ~3x from current levels.
Market Cycle Timing: BTC dominance topping out + potential altseason rotation favors ETH’s outperformance.
Strong Structure: Break above resistance aligns with long-term moving averages flipping bullish.
⚠️ Risk Factors
Macro events (FOMC, inflation data) could cause temporary retracements.
A weekly close back below $4K would invalidate the breakout.
BTC volatility may suppress ETH in the short term before altseason kicks in.
🎯 Targets
TP1: $6,500
TP2: $9,500
TP3: $14,500 (full measured move target)
📌 Conclusion
ETH is showing one of the strongest technical breakouts in years. If $4K+ holds as support, the path to new ATHs and beyond looks wide open. This setup could define the next phase of the bull market.
Bulls are in control — it’s ETH’s time to shine. 🌟
🔔 What’s your target for ETH in this cycle? $10K or higher? Let me know in the comments
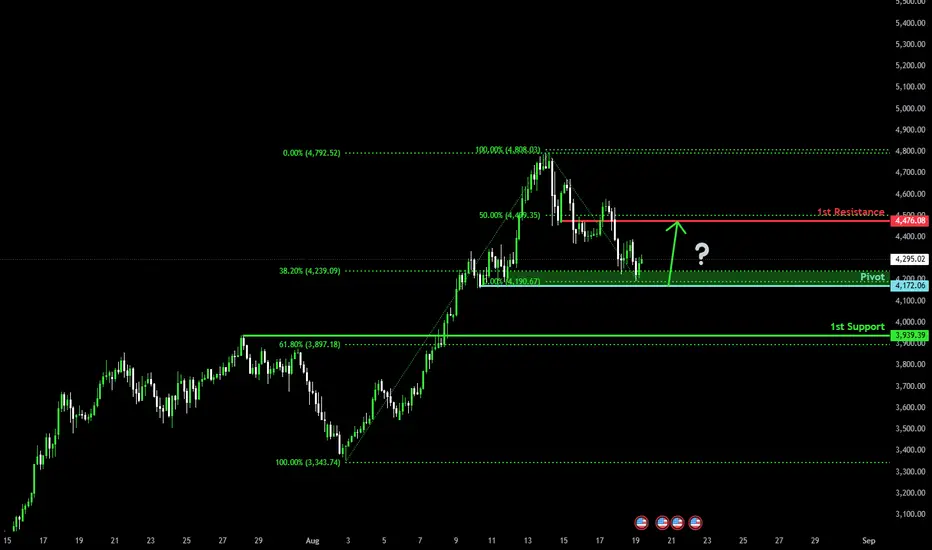
Bullish bounce off multi swing low aupport?Ethereum (ETH/USD) is falling towards the pivot and could bounce to the 50% Fibonacci resistance.
Pivot: 4,172.06
1st Support: 3,939.39
1st Resistance: 4,476.08
Risk Warning:
Trading Forex and CFDs carries a high level of risk to your capital and you should only trade with money you can afford to lose. Trading Forex and CFDs may not be suitable for all investors, so please ensure that you fully understand the risks involved and seek independent advice if necessary.
Disclaimer:
The above opinions given constitute general market commentary, and do not constitute the opinion or advice of IC Markets or any form of personal or investment advice.
Any opinions, news, research, analyses, prices, other information, or links to third-party sites contained on this website are provided on an "as-is" basis, are intended only to be informative, is not an advice nor a recommendation, nor research, or a record of our trading prices, or an offer of, or solicitation for a transaction in any financial instrument and thus should not be treated as such. The information provided does not involve any specific investment objectives, financial situation and needs of any specific person who may receive it. Please be aware, that past performance is not a reliable indicator of future performance and/or results. Past Performance or Forward-looking scenarios based upon the reasonable beliefs of the third-party provider are not a guarantee of future performance. Actual results may differ materially from those anticipated in forward-looking or past performance statements. IC Markets makes no representation or warranty and assumes no liability as to the accuracy or completeness of the information provided, nor any loss arising from any investment based on a recommendation, forecast or any information supplied by any third-party.
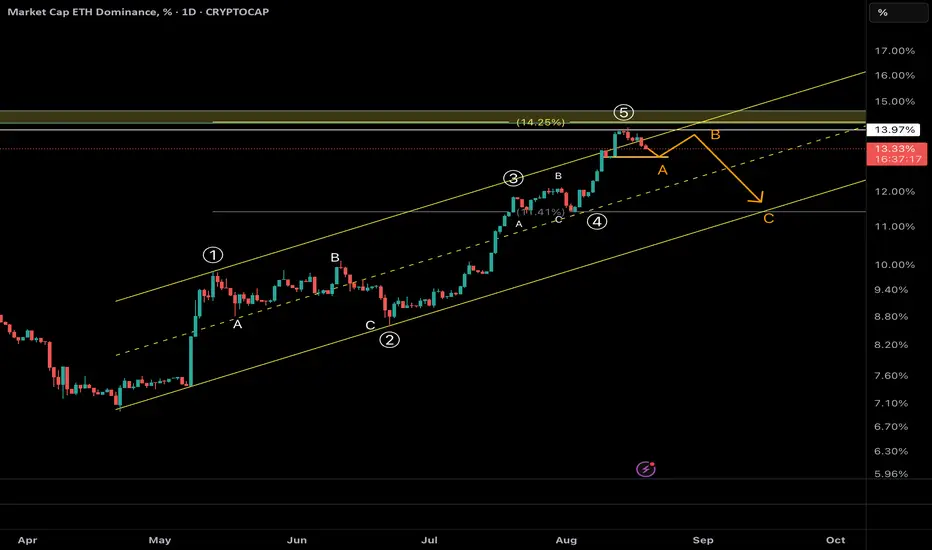
ETH.D : 5-Wave Bull Run Over –Bitcoin to Outshine EthereumeEthereum Dominance (ETH.D) has completed a textbook 5-wave impulsive rally on the weekly timeframe, signaling the end of its upward cycle and entry into a deep corrective phase. As of August , ETH.D at 13.37% is rejecting the key order block at ~14%, hinting at weakening momentum. This shift favors Bitcoin's outperformance, as capital rotates from ETH to BTC, potentially boosting BTC/ETH ratio and Bitcoin returns during the downturn.
NeoWave Wave Count (Daily Chart):
The rally from ~10.5% lows unfolded in 5 waves: Wave 1 to ~11.41%, Wave 2 correction to ~10.11%, Wave 3 extended to ~13.97% (161.8% of Wave 1), Wave 4 shallow to ~13.32%, and Wave 5 topping at 13.97% with the 1.618 Fib extension (1.141%).
Monowave count (~55-70 subwaves) validates the impulse, with alternation (Wave 2 deep/time-extended, Wave 4 shallow/short). The ascending channel (yellow) has been touched multiple times, and the recent rejection confirms exhaustion.
Weekly Chart Insight:
On the weekly TF, ETH.D has hit a major order block at ~14% (1.425%), not the channel top, coinciding with the 1.618 Fib extension from 2023 lows and historical resistance from 2018 highs (~52%). This multi-year descending channel holds firm, with price failing to break the OB—suggesting reversal to midline ~12.5% or lower (38.2%-50% Fib retrace of rally).
Why Bitcoin Outperforms From Here:
As ETH.D corrects (likely a Zigzag or Flat, targeting 11%-12%), Bitcoin gains dominance, driving better returns for BTC holders. Expect BTC/ETH ratio to climb (current ~12.5, target 14-15), with Bitcoin yielding 10-20% superior performance in risk-off environments. If ETH.D drops below 12.5%, correction accelerates to 10% (78.6% Fib), amplifying BTC's edge.
Trade Idea (Bearish ETH.D / Bullish BTC):
Entry: Short ETH.D (or long BTC/ETH pair) below 13.32% on BOS confirmation in weekly.
Targets: TP1 at 12.5% (channel midline), TP2 at 11% (50% Fib).
Stop Loss: Above 14.25% (OB high, R:R ~1:3).
Sizing: 1-2% capital; trail stops on midline breaks. Watch dominance flips—crypto rotations can spark quick BTC pumps.
ETH bulls, pivot to BTC now! #ETHDominance #NeoWave #BitcoinOutperformance #CryptoAnalysis
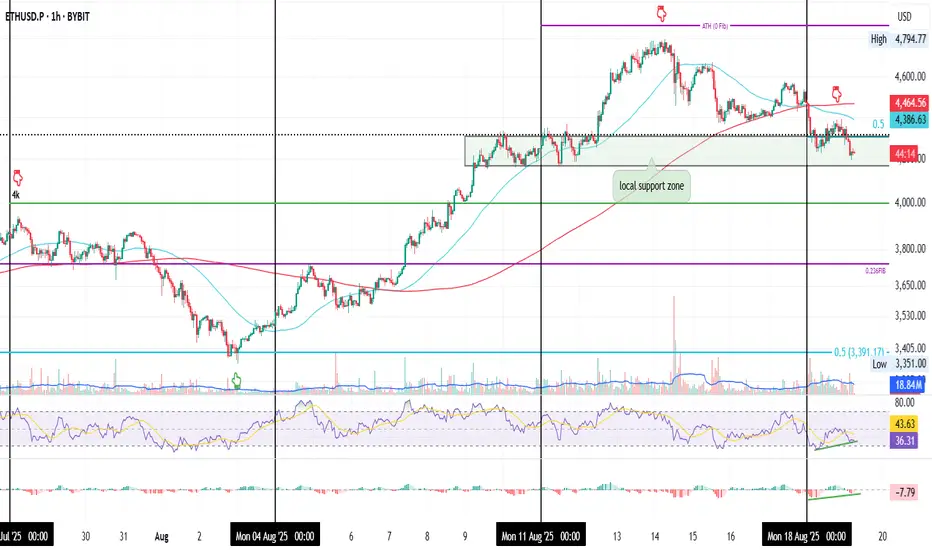
ETH 1H | Signs of a Bottom, But Needs Confirmation
ETH on the 1H timeframe
ETH has lost the 0.5 Fib at $4310 and is now testing the local support zone.
1. A death cross occurred at the start of the week.
2. RSI and MACD are both showing bullish divergence.
3. Price is trying to hold local support.
Put together, these signs could signal a potential bottom, but confirmation is key.
If support holds, the setup strengthens. Until then, we watch it unfold.
Always take profits and manage risk.
Interaction is welcome.
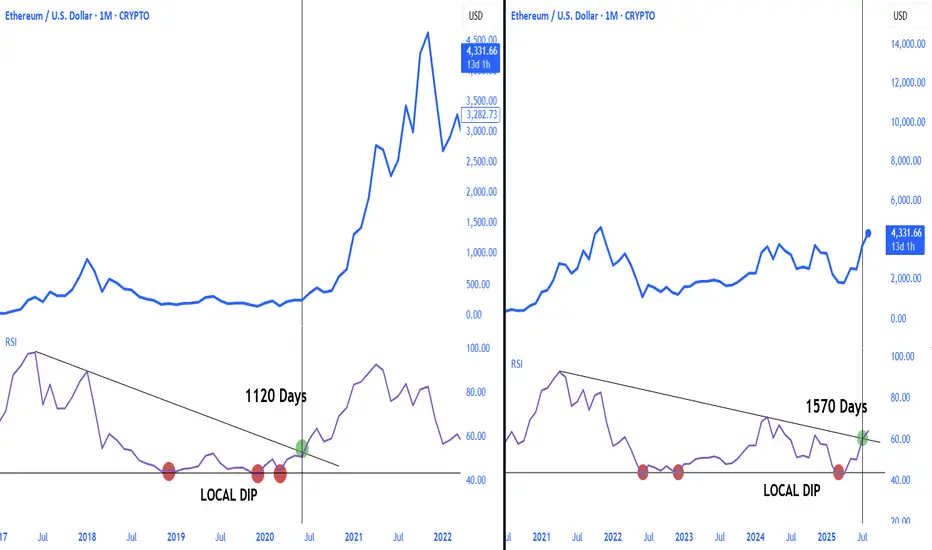
Ethereum at the beginning of a parabolic run As confirmed by Ethereum's RSI, the major breakout that occurred 1,570 days later confirms the start of a parabolic run.
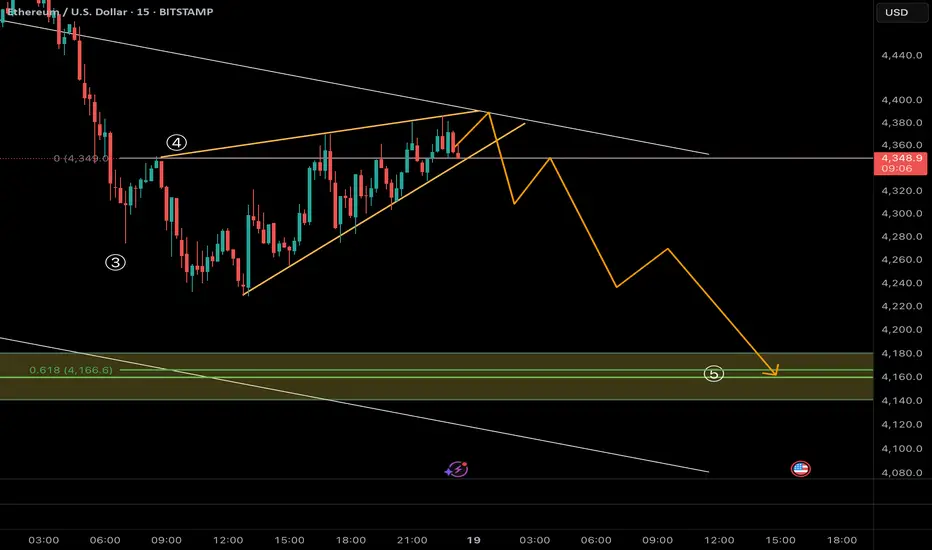
Close view of ETH Short Description : the possible next Move of ETH Shown in graph. ETH can drop to 4100 as 5th wave of correction pattern
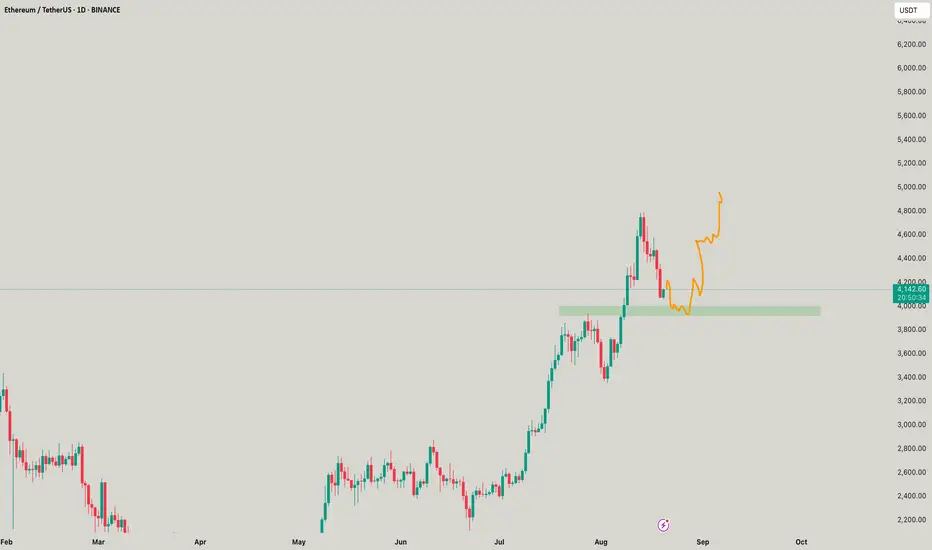
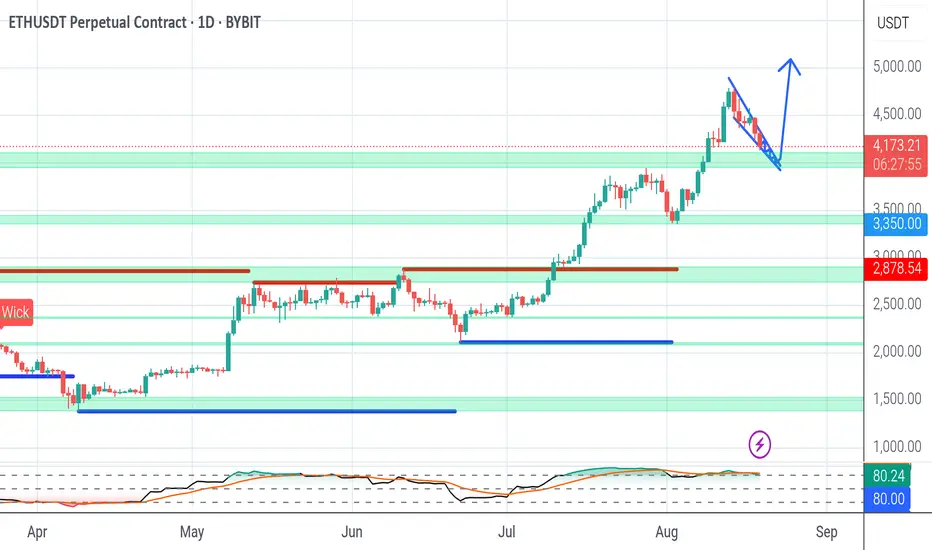
ETH - Eyes on a New All-Time High?ETHUSDT has been on fire lately, following a textbook bullish structure of Impulse → Fakeout → Impulse.
After breaking above the previous range in July, ETH confirmed strength with a sharp impulse move, only to shake out weak hands via a fakeout retest before pushing higher again. 📈
Currently, ETH is in the midst of another impulsive leg, with the next major target sitting at the ATH around $4,876.
📊 Key Notes:
- Fakeouts have served as liquidity grabs before strong rallies 🏹
- Current momentum favors the bulls 🐂
- As long as price holds above the last breakout zone (~$4,050–$4,150), the path of least resistance remains up.
🎯 Next Stop: ATH and beyond if bullish pressure sustains.
📚 Always follow your trading plan regarding entry, risk management, and trade management.
Good luck!
All Strategies Are Good; If Managed Properly!
~Richard Nasr

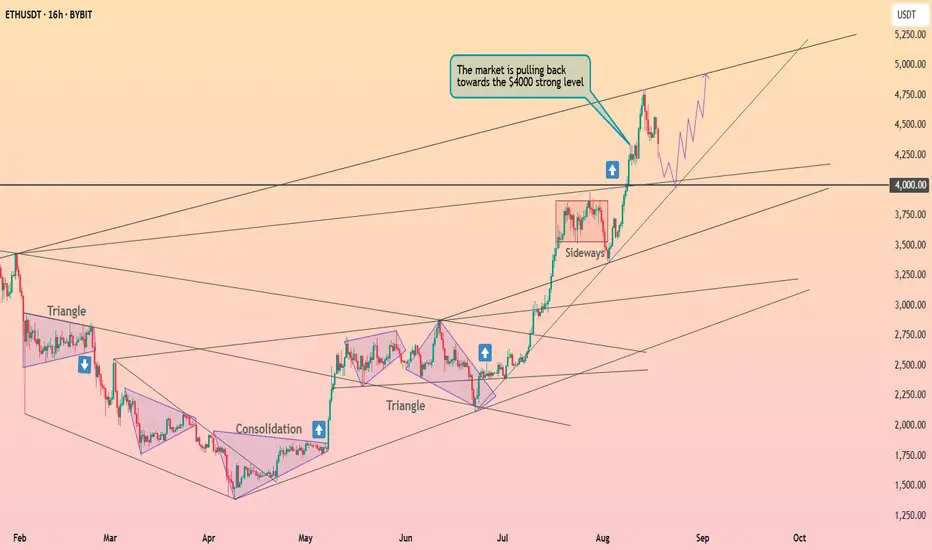
Ethereum will consolidate above $4k ┆ HolderStatBYBIT:ETHUSDT on the 16h chart is pulling back after strong rallies, retesting the $4,000 support level. Sideways and consolidation phases remain visible, showing demand. As long as $4,000 holds, targets at 4,600–5,000 stay valid.
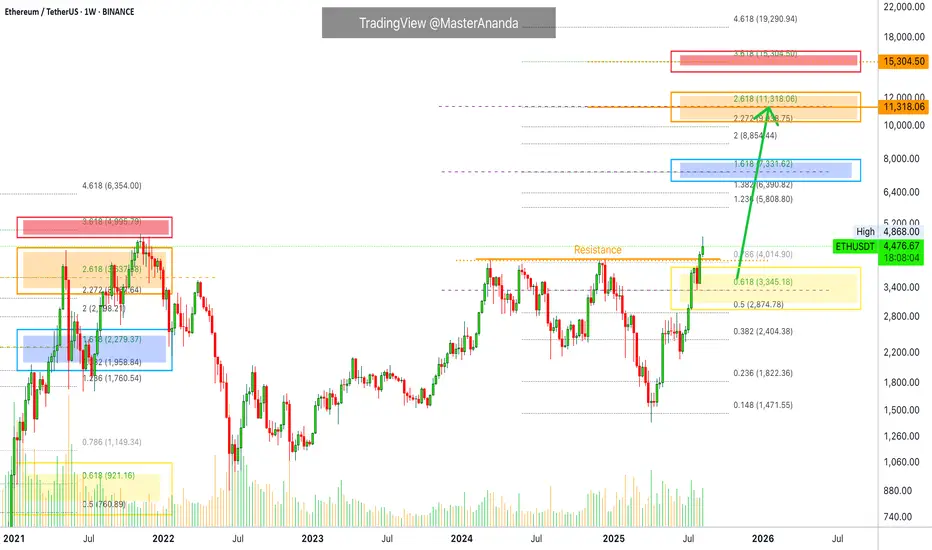
Ethereum's Bullish Market Conditions Intact —$11,111 NextNothing changes here. I am looking at the weekly timeframe and it seems Ether is ultra-bullish, it is literally growing above resistance.
The very insistent and annoying resistance from March 2024 was broken just last week. And as ETHUSDT trades above this level, it started to grow. This week is the first week above resistance and the chart looks great.
Things can change. But things can change. We can see multiple red candles show up and lower prices but this isn't what we have on the chart today. Right now we have strong bullish action, strong bullish candles, strong momentum, the break of resistance, the highest prices in four years and accumulating bullish volume. The chart doesn't point down rather it is saying "additional growth."
Ethereum will continue growing. Just think about it: One day ETHUSDT is trading at $1,500 and starts to go up. Four months later, ETH is trading at $5,000.
Thanks a lot for your continued support.
The next target is $6,000 to stop blank at $7,330 to continue rising until we go beyond $10,000, a price tag of $11,111 for this 2025/26 bull run. There is enough time in 2025 for ETH to produce a full bullish cycle. This chart doesn't need 2026. If it extends, better.
Namaste.
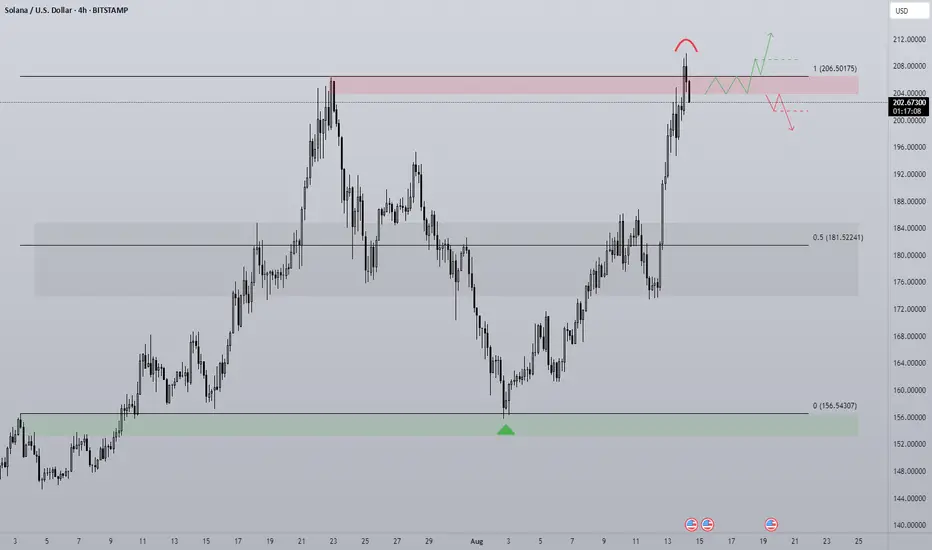
SOL - Breakout or Rangebound?For me this chart is quite simple with two options, a bullish and bearish scenario. SOL is currently rangebound but the massive momentum in the broader market has opened the door to a potential breakout of this trading environment.
To look at the context of the chart we has a clear push from the midpoint up to range high, very little in the way of pullbacks until price breaks up above the old local high. We know that generally stop losses hide behind a key high or low and so price trading into it with such momentum is something to note when entering a trade at this level.
Liquidations for SOL are currently 50:50 long and short and so this balance shows no clear liquidation event in one particular way, at least not yet.
Bullish scenario -
SOL continues the rally above the range, strong volume to confirm that price is ready to expand beyond the area that failed in the past. A retest of $206 with a strong bounce gives this move a higher probability and proof buyers are still willing to buy at the level. Idea is invalid should price accept back below the range high, signifying buyers are not ready to sustain rally continuation.
Bearish scenario -
Price accepts below range high and shows that buyers are not willing to expend beyond the range. Naturally a retreat would then follow as the bears defend the same point that they successfully defended in the past (range high). Any price action that resembles chop within the red box would be a non action area as there is an area of balance giving no clear clue of direction either way.
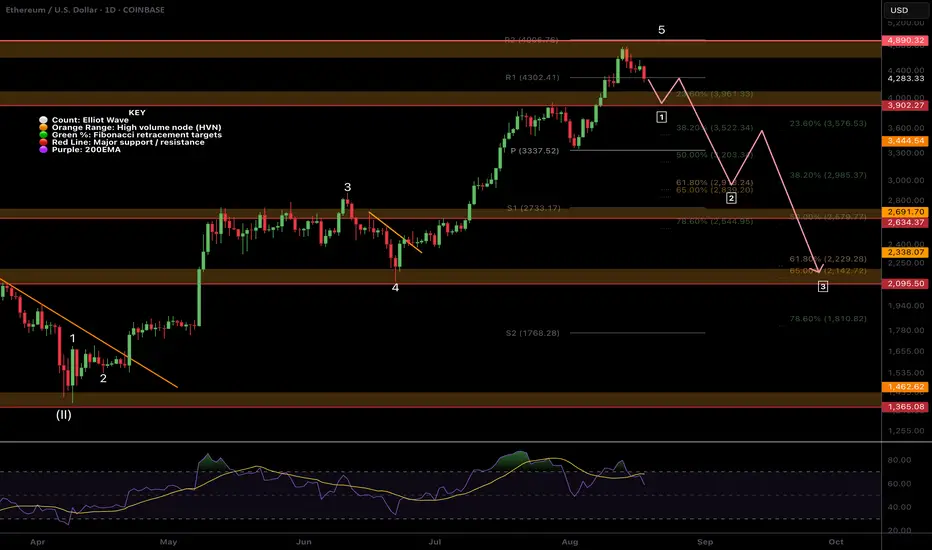
$ETH Topping Without All Time High?Has the most anticipated all time high of the year been cancelled? The crowd does not get what it wants! Everyone from CNBC to my grandmas goldfish have been bullish on ETH for the past few months so what a fitting psychological mess it would be if we significantly pulled back here!
Firstly it may just be a temporary set back to the High Volume Node support at $3900 before a move to all time high. Even then I am expecting a deeper pullback to set us up for all time high in Q4. Losing this support bring up the ascending daily 200EMA right at the Fibonacci golden pocket, which you can see is the wave 3 high!
The next target, which is my next buy level, is the larger degree Fibonacci golden pocket, major support High Volume Node and wave 4 bottom at $2100. This would be a capitulation area for many!
RSI has printed confirmed bearish divergence with plenty of room to fall.
Safe trading
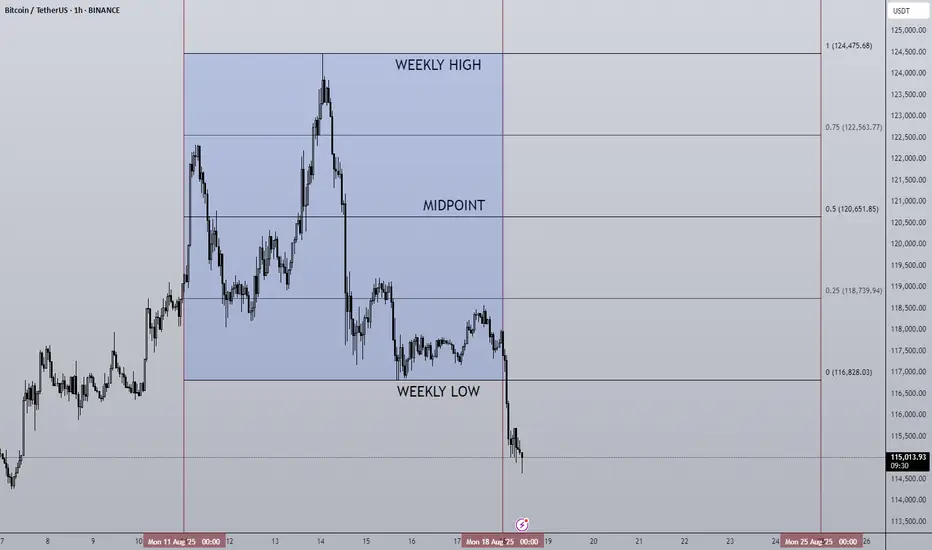
18/08/25 Weekly OutlookLast weeks high: $124,475.68
Last weeks low: $116,828.03
Midpoint: $120,651.85
Another new ATH for BTC but are there signs of weakness beginning to show?
Last week Bitcoin hit a new ATH just shy of $124,500, a remarkable achievement but the reaction from that level to me is not a good one. Using the RSI indicator it is clear that on the daily time frame both the July top and now the most recent top form a bearish divergence. Higher time frame bearish divergences are strong trend reversal indicators. On the hour timeframe both tops also formed a local bearish divergence, to me this is a double sign of an exhausted rally.
This is not to say the end of the cycle is here by no means, what it does suggest is that the bulls are tired and a correction could be round the corner. From here I think logically the $111,000 & $108,000 levels could provide support this week on any pullback continuation. From a macro perspective we still have rate cuts to come next month, An ever growing M2 Global Money Supply to feed the market and a hungry institutional investor race to acquire digital assets. All this points towards the bullaun continuing but In my opinion after a cooling off period, after all August and September are famously bad months for BTC for returns.
Ethereum on the other hand continues to impress this a record $2.85B ETF net Inflows. $3.75B net inflows for digital assets as a whole. No break of ATH as yet but the momentum is certainly there. BTC will need to stand strong for ETH to push past $4,800.
This week I'm keeping a close eye on how BTC reacts to any pullbacks, judging market order flow to see if this is a shallow pullback or maybe a prolonged one that results in a rangebound environment.
FED chair Powell does speak this week so possible volatility should he announce anything significant.
Good luck this week everybody!
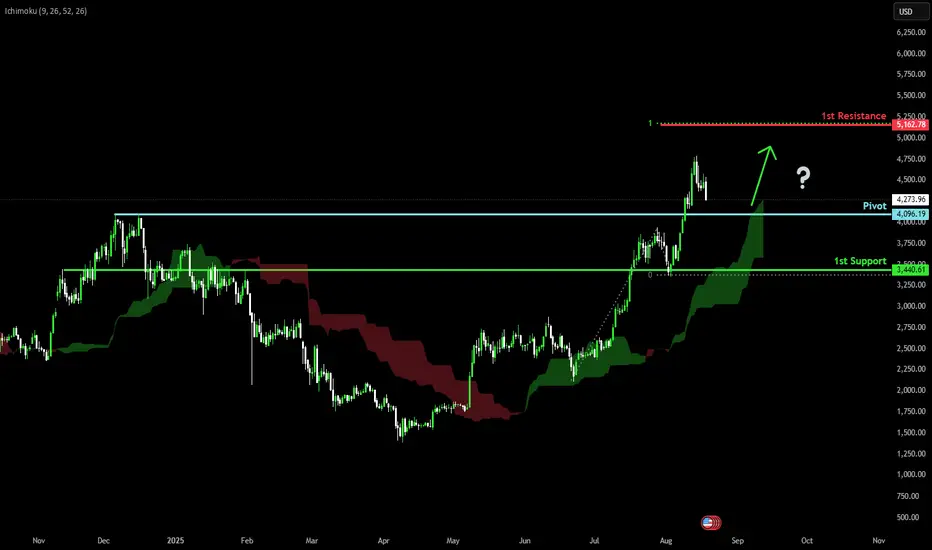
Falling towards pullback support?Ethereum (ETH/USD) is falling towards the pivot, which has been identified as a pullback support and could bounce to the 1st resistance.
Pivot: 4,096.19
1st Support: 3,440.61
1st Resistance: 5,162.78
Risk Warning:
Trading Forex and CFDs carries a high level of risk to your capital and you should only trade with money you can afford to lose. Trading Forex and CFDs may not be suitable for all investors, so please ensure that you fully understand the risks involved and seek independent advice if necessary.
Disclaimer:
The above opinions given constitute general market commentary, and do not constitute the opinion or advice of IC Markets or any form of personal or investment advice.
Any opinions, news, research, analyses, prices, other information, or links to third-party sites contained on this website are provided on an "as-is" basis, are intended only to be informative, is not an advice nor a recommendation, nor research, or a record of our trading prices, or an offer of, or solicitation for a transaction in any financial instrument and thus should not be treated as such. The information provided does not involve any specific investment objectives, financial situation and needs of any specific person who may receive it. Please be aware, that past performance is not a reliable indicator of future performance and/or results. Past Performance or Forward-looking scenarios based upon the reasonable beliefs of the third-party provider are not a guarantee of future performance. Actual results may differ materially from those anticipated in forward-looking or past performance statements. IC Markets makes no representation or warranty and assumes no liability as to the accuracy or completeness of the information provided, nor any loss arising from any investment based on a recommendation, forecast or any information supplied by any third-party.
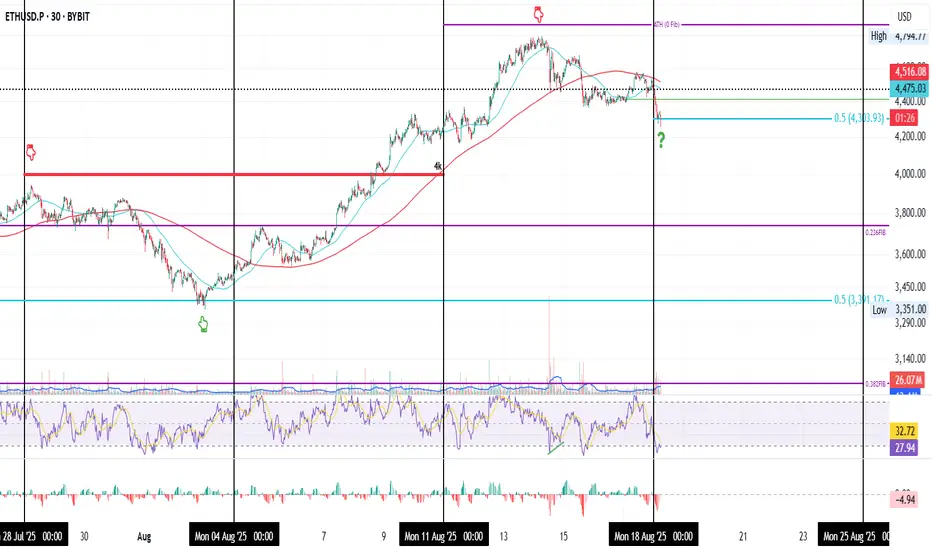
ETH’s Predator Move on the 30min time rame
This is ETH on the 30min timeframe over the past 3 weeks.
It started on Monday, July 28, when price was rejected at the $4K resistance after a Sunday night pump. What followed was nearly half a week of chop, then a drop that found support at the 0.5 Fib = $3391 (the midpoint between the 0.382 and 0.236 levels). From there, ETH rallied +43% to its ATH.
Last week, the same scenario repeated: price rejected from ATH (0 Fib), chopped half a week, then fell Sunday night, this time finding support at the 0.5 Fib = $4303 (the midpoint between the 0.236 and 0 levels).
Now the question is: will this 10% drop be enough to reload for another attempt at ATH, or will price need to retrace deeper to gather the liquidity needed?
One thing is certain: this is a leverage flush. If you’re riding high leverage, understand that you are the prey, and price is the predator. To survive, you need to shed some leverage weight before it catches you.
Always take profits and manage risk.
Interaction is welcome.