GBPJPY Breakout and Potential RetraceHey Traders, in the coming week we are monitoring GBPJPY for a buying opportunity around 196.600 zone, GBPJPY was trading in a downtrend and successfully managed to break it out. Currently is in a correction phase in which it is approaching the retrace area at 196.600 support and resistance zone.
Trade safe, Joe.
D-GBPJPY
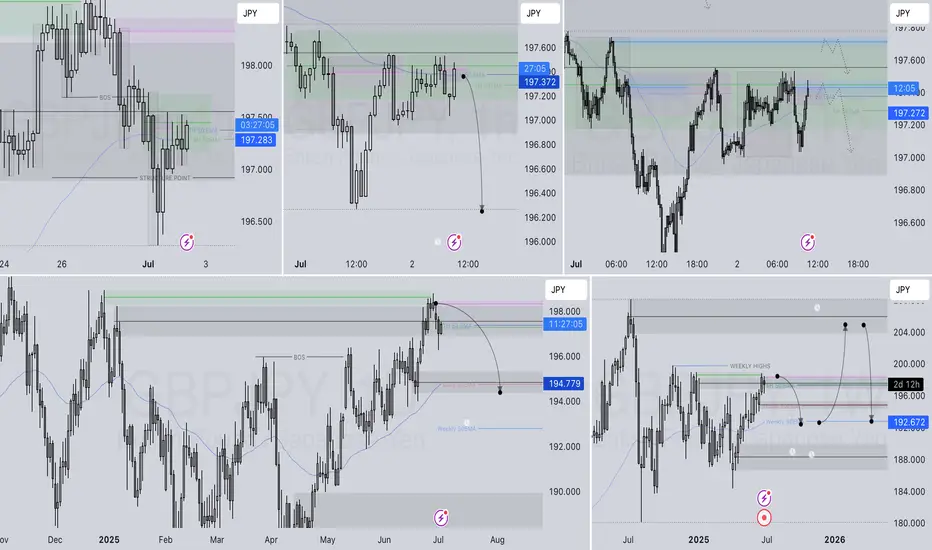
Forex. Orderflow. [30.06--04.07]Covering forex pairs. Thoughts and weekly runs and GJ for possible expansion next week
Having a sore throat bear with that

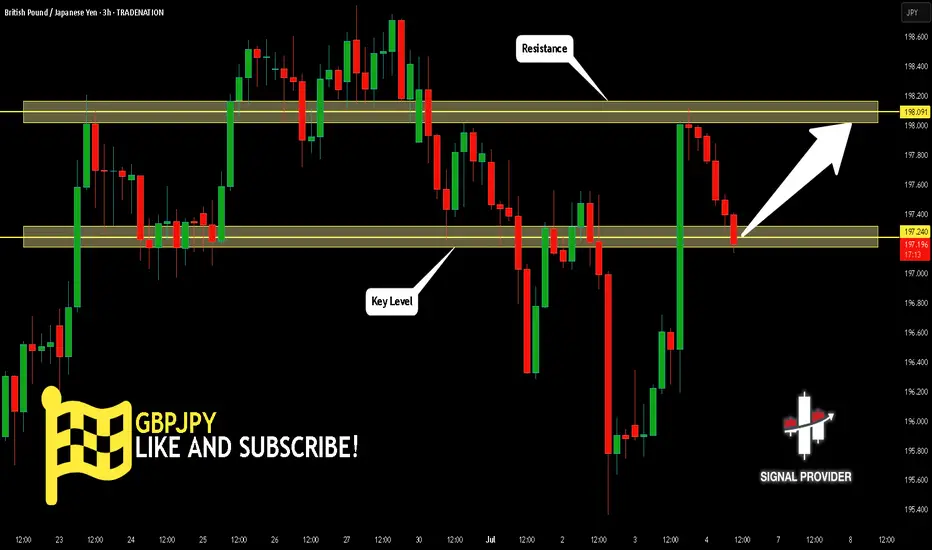
GBPJPY Will Go Up! Buy!
Please, check our technical outlook for GBPJPY.
Time Frame: 3h
Current Trend: Bullish
Sentiment: Oversold (based on 7-period RSI)
Forecast: Bullish
The market is approaching a key horizontal level 197.240.
Considering the today's price action, probabilities will be high to see a movement to 198.091.
P.S
Please, note that an oversold/overbought condition can last for a long time, and therefore being oversold/overbought doesn't mean a price rally will come soon, or at all.
Disclosure: I am part of Trade Nation's Influencer program and receive a monthly fee for using their TradingView charts in my analysis.
Like and subscribe and comment my ideas if you enjoy them!
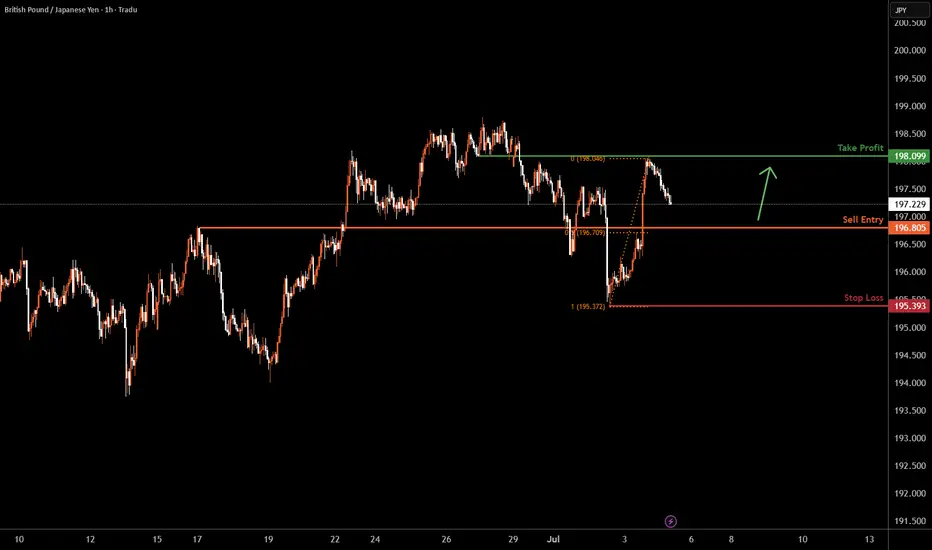
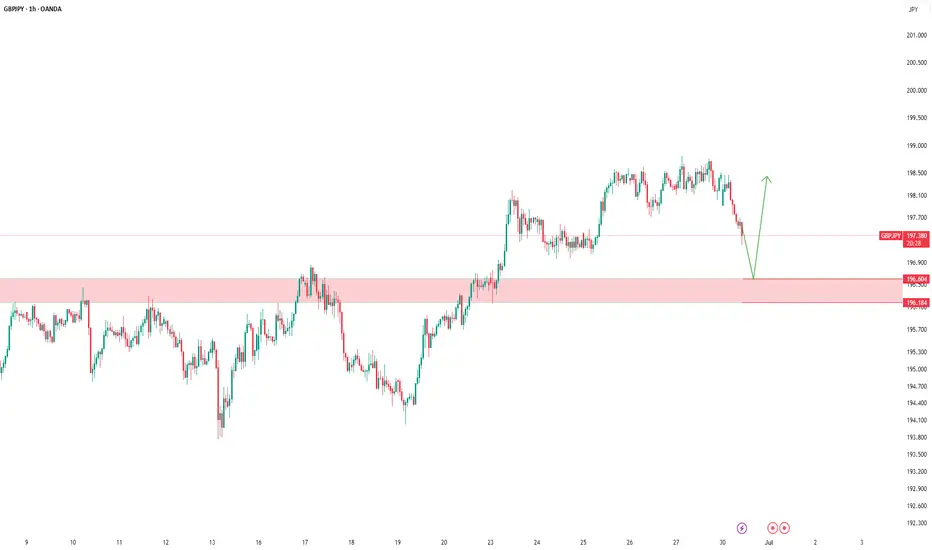
GBPJPY H1 I Bullish RiseBased on the H1 chart analysis, we can see that the price is falling toward our buy entry at 196.80, which is a pullback support that aligns closely with the 50% Fib retracement.
Our take profit will be at 198.09, an overlap resistance level.
The stop loss will be placed at 195.39, a swing low support.
High Risk Investment Warning
Trading Forex/CFDs on margin carries a high level of risk and may not be suitable for all investors. Leverage can work against you.
Stratos Markets Limited (tradu.com ):
CFDs are complex instruments and come with a high risk of losing money rapidly due to leverage. 63% of retail investor accounts lose money when trading CFDs with this provider. You should consider whether you understand how CFDs work and whether you can afford to take the high risk of losing your money.
Stratos Europe Ltd (tradu.com ):
CFDs are complex instruments and come with a high risk of losing money rapidly due to leverage. 63% of retail investor accounts lose money when trading CFDs with this provider. You should consider whether you understand how CFDs work and whether you can afford to take the high risk of losing your money.
Stratos Global LLC (tradu.com ):
Losses can exceed deposits.
Please be advised that the information presented on TradingView is provided to Tradu (‘Company’, ‘we’) by a third-party provider (‘TFA Global Pte Ltd’). Please be reminded that you are solely responsible for the trading decisions on your account. There is a very high degree of risk involved in trading. Any information and/or content is intended entirely for research, educational and informational purposes only and does not constitute investment or consultation advice or investment strategy. The information is not tailored to the investment needs of any specific person and therefore does not involve a consideration of any of the investment objectives, financial situation or needs of any viewer that may receive it. Kindly also note that past performance is not a reliable indicator of future results. Actual results may differ materially from those anticipated in forward-looking or past performance statements. We assume no liability as to the accuracy or completeness of any of the information and/or content provided herein and the Company cannot be held responsible for any omission, mistake nor for any loss or damage including without limitation to any loss of profit which may arise from reliance on any information supplied by TFA Global Pte Ltd.
The speaker(s) is neither an employee, agent nor representative of Tradu and is therefore acting independently. The opinions given are their own, constitute general market commentary, and do not constitute the opinion or advice of Tradu or any form of personal or investment advice. Tradu neither endorses nor guarantees offerings of third-party speakers, nor is Tradu responsible for the content, veracity or opinions of third-party speakers, presenters or participants.
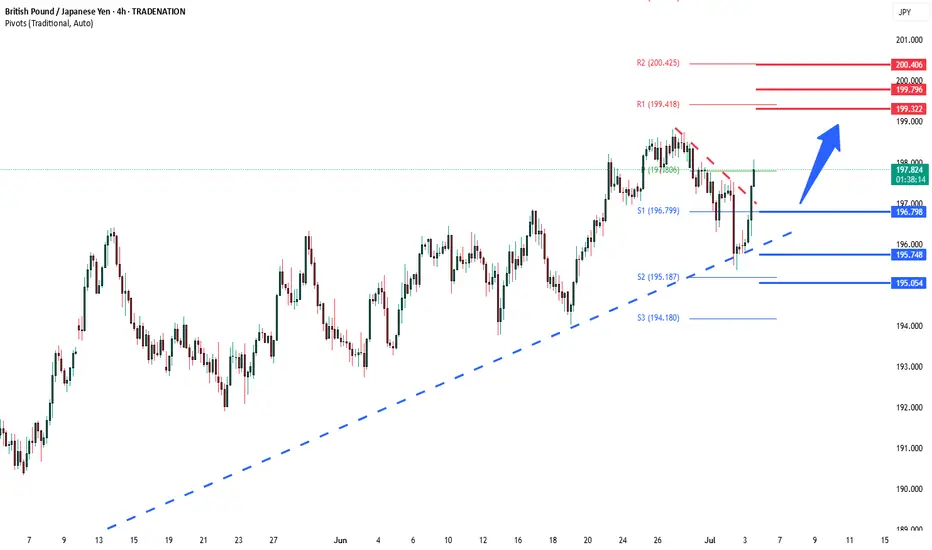
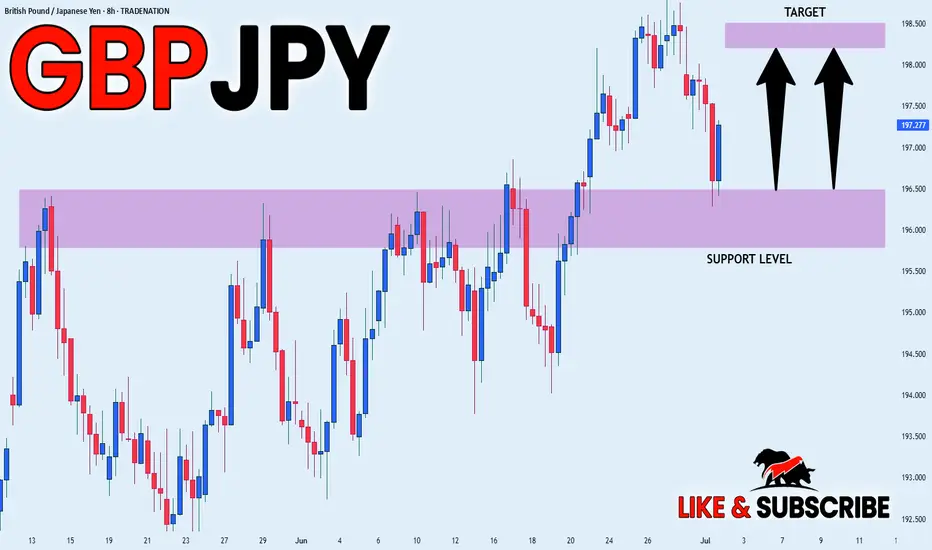
GBPJPY uptrend continuation breakoutKey Support: 196.75
This level marks the prior consolidation zone and serves as a critical pivot. A corrective pullback toward 196.75 followed by a bullish reversal would validate the uptrend, with upside targets at:
199.20 – Initial resistance and short-term target
199.70 – Minor resistance zone
200.40 – Longer-term breakout objective
However, a daily close below 196.75 would invalidate the bullish scenario, potentially triggering a deeper retracement toward:
195.80 – Near-term support
194.80 – Key downside level in a bearish reversal
Conclusion:
As long as 196.75 holds, the bias remains bullish, favoring continuation toward the 199–200 zone. A confirmed break below this support would shift momentum, opening the door for a broader corrective decline.
This communication is for informational purposes only and should not be viewed as any form of recommendation as to a particular course of action or as investment advice. It is not intended as an offer or solicitation for the purchase or sale of any financial instrument or as an official confirmation of any transaction. Opinions, estimates and assumptions expressed herein are made as of the date of this communication and are subject to change without notice. This communication has been prepared based upon information, including market prices, data and other information, believed to be reliable; however, Trade Nation does not warrant its completeness or accuracy. All market prices and market data contained in or attached to this communication are indicative and subject to change without notice.
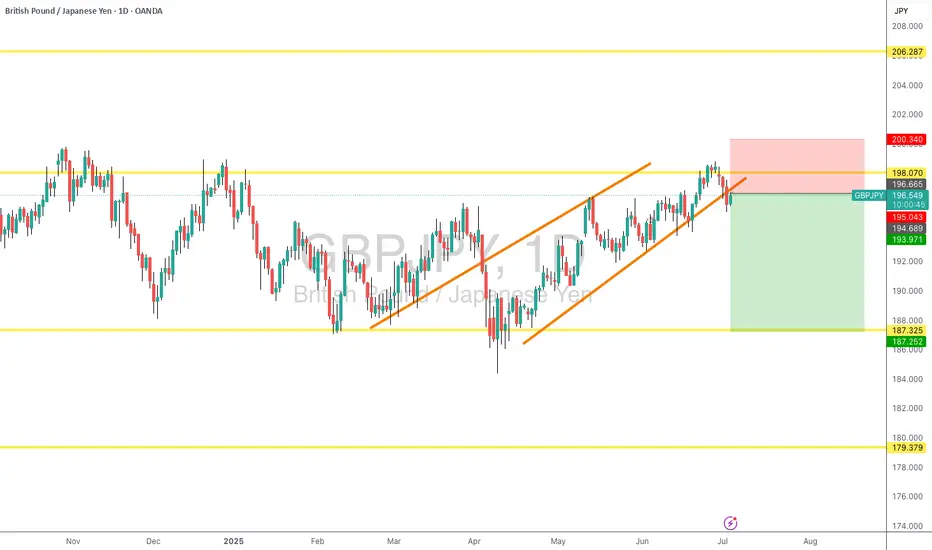
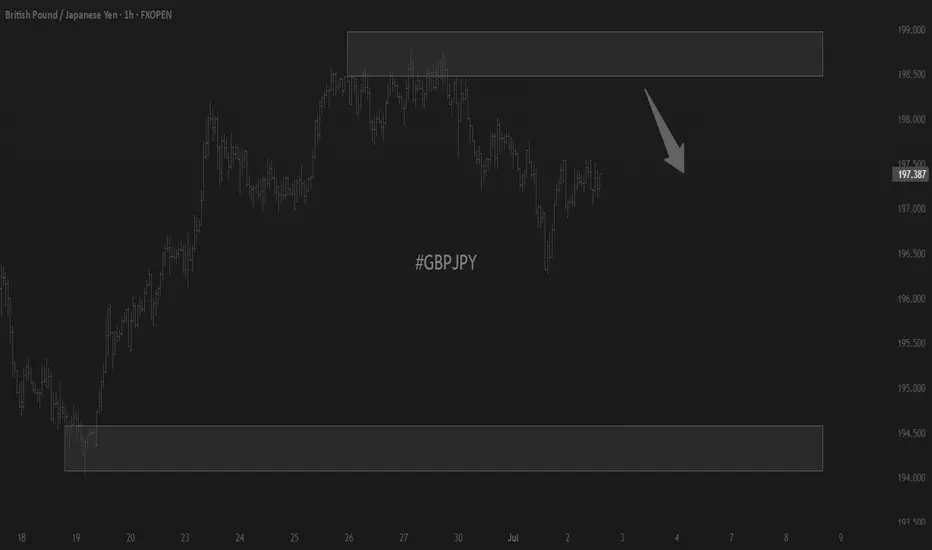
GBP/JPY SELL SETUP - Range Resistance RejectionGBPJPY is showing classic range-bound behavior with a clear rejection setup at key resistance.
📊 Market Analysis
Timeframe: Daily
Bias: Bearish (within established range)
Pattern: Range-bound market with resistance rejection
🎯 Trade Setup
Entry: 196.400 - 196.800 (on rejection candles)
Stop Loss: 199.200 (above range high)
Take Profit 1: 192.500 (mid-range)
Take Profit 2: 189.500 (range support)
📈 Technical Reasons
✅ Multiple rejections at 198.480 resistance level
✅ Range-bound market structure intact
✅ Bearish rejection candle formation
✅ Risk-reward ratio 1:2 to 1:3
🔍 Key Levels
Resistance: 198.480 (range top)
Support: 189.365 (range bottom)
Invalidation: Break above 199.200
⚠️ Risk Management
Position size: 1-2% of account
Watch for any break above resistance with volume
Weekly bias remains bullish - be ready to exit if range breaks up
💡 Trade Plan
Looking for price to respect the established range and move back toward support levels. This is a counter-trend trade within the range structure.
Remember: Trade your plan, plan your trade. Always manage risk first!
GBPJPY: Bullish Impulse May Take Price To 205! 700+ Pips MoveGBPJPY is in steady bullish move in other words it is in impulse move; price has not yet exhausted and there is still extended bullish move to completed before bears takes control over. Please use accurate risk management while trading and do your own analysis.
LIKE
COMMENT
SHARE
Good luck.
Team Setupsfx_

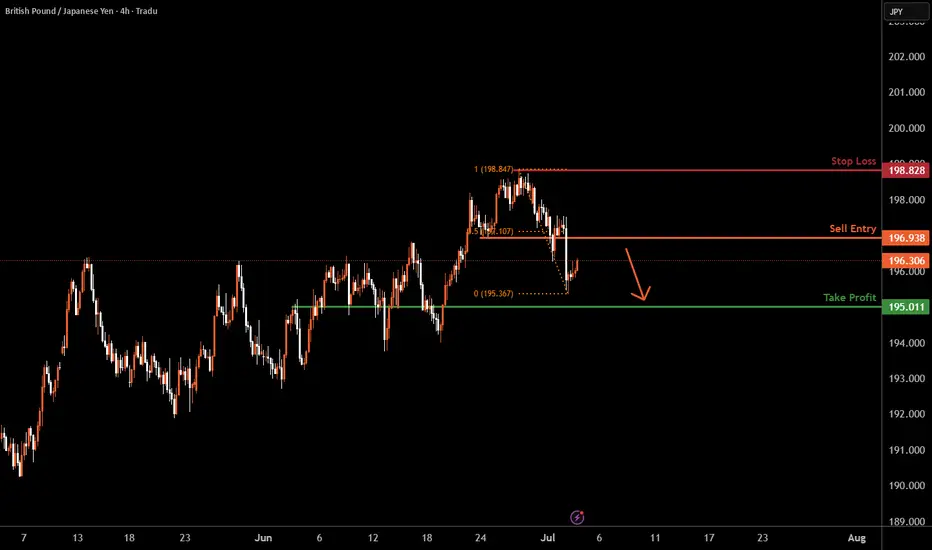
GBPJPY H4 I Bearish Reversal Based on the H4 chart, the price is approaching our sell entry level at 196.93, a pullback resistance that aligns with the 50% Fib retracement.
Our take profit is set at 195.01, a pullback support.
The stop loss is set at 198.82, a swing high resistance.
High Risk Investment Warning
Trading Forex/CFDs on margin carries a high level of risk and may not be suitable for all investors. Leverage can work against you.
Stratos Markets Limited (tradu.com ):
CFDs are complex instruments and come with a high risk of losing money rapidly due to leverage. 63% of retail investor accounts lose money when trading CFDs with this provider. You should consider whether you understand how CFDs work and whether you can afford to take the high risk of losing your money.
Stratos Europe Ltd (tradu.com ):
CFDs are complex instruments and come with a high risk of losing money rapidly due to leverage. 63% of retail investor accounts lose money when trading CFDs with this provider. You should consider whether you understand how CFDs work and whether you can afford to take the high risk of losing your money.
Stratos Global LLC (tradu.com ):
Losses can exceed deposits.
Please be advised that the information presented on TradingView is provided to Tradu (‘Company’, ‘we’) by a third-party provider (‘TFA Global Pte Ltd’). Please be reminded that you are solely responsible for the trading decisions on your account. There is a very high degree of risk involved in trading. Any information and/or content is intended entirely for research, educational and informational purposes only and does not constitute investment or consultation advice or investment strategy. The information is not tailored to the investment needs of any specific person and therefore does not involve a consideration of any of the investment objectives, financial situation or needs of any viewer that may receive it. Kindly also note that past performance is not a reliable indicator of future results. Actual results may differ materially from those anticipated in forward-looking or past performance statements. We assume no liability as to the accuracy or completeness of any of the information and/or content provided herein and the Company cannot be held responsible for any omission, mistake nor for any loss or damage including without limitation to any loss of profit which may arise from reliance on any information supplied by TFA Global Pte Ltd.
The speaker(s) is neither an employee, agent nor representative of Tradu and is therefore acting independently. The opinions given are their own, constitute general market commentary, and do not constitute the opinion or advice of Tradu or any form of personal or investment advice. Tradu neither endorses nor guarantees offerings of third-party speakers, nor is Tradu responsible for the content, veracity or opinions of third-party speakers, presenters or participants.
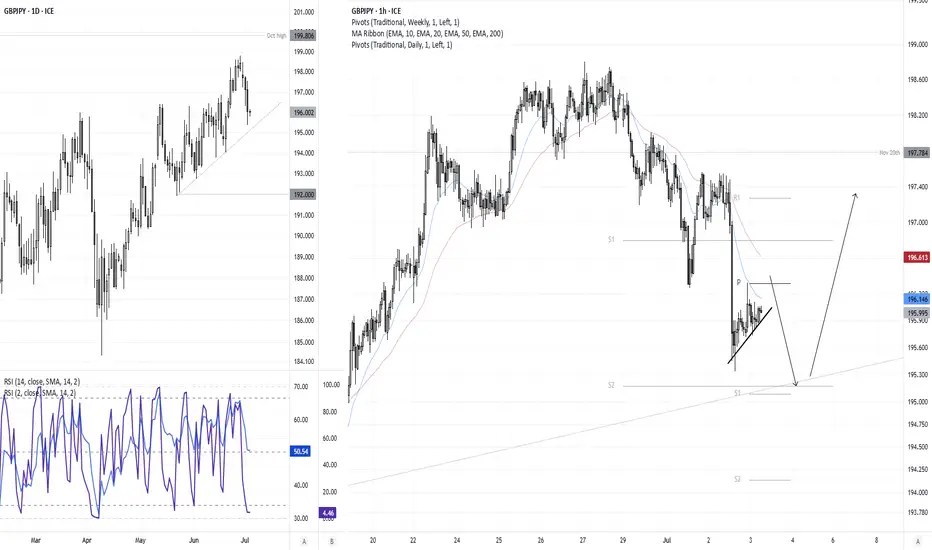
GBP/JPY Bears Eye Drop to 195GBP/JPY closed lower for a third day on Wednesday, with bearish momentum increasing thanks to political tensions in the UK and dovish comments from BOE voting members.
While the daily RSI (2) is oversold, there could still be room for a move to 195 over the near term. Its less than a day’s trading range away using recent volatility levels, and it also sits near the bullish trendline from the May low.
The 1-hour chart shows prices are drifting higher in an apparent corrective fashion, yet prices remain in the lower third of Wednesday’s range. I suspect bears will seek to fade into any pops higher in anticipation of another drop towards 195, near the daily S1 pivot, weekly S and rising trendline.
Should GBP/JPY drop to the lower target area, how prices react could provide clues over its potential to use the level as a springboard or break lower from that pivotal zone.
Market Analyst at City Index and Forex.com
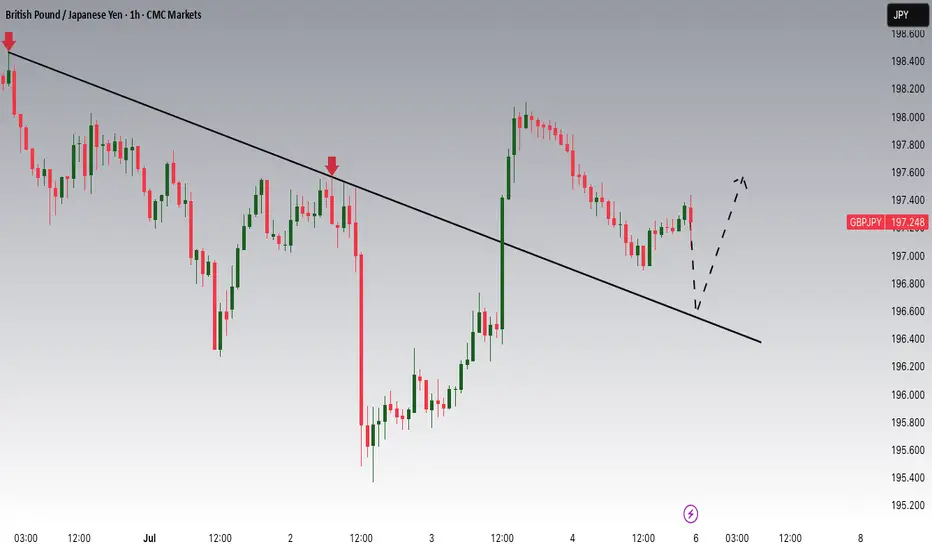
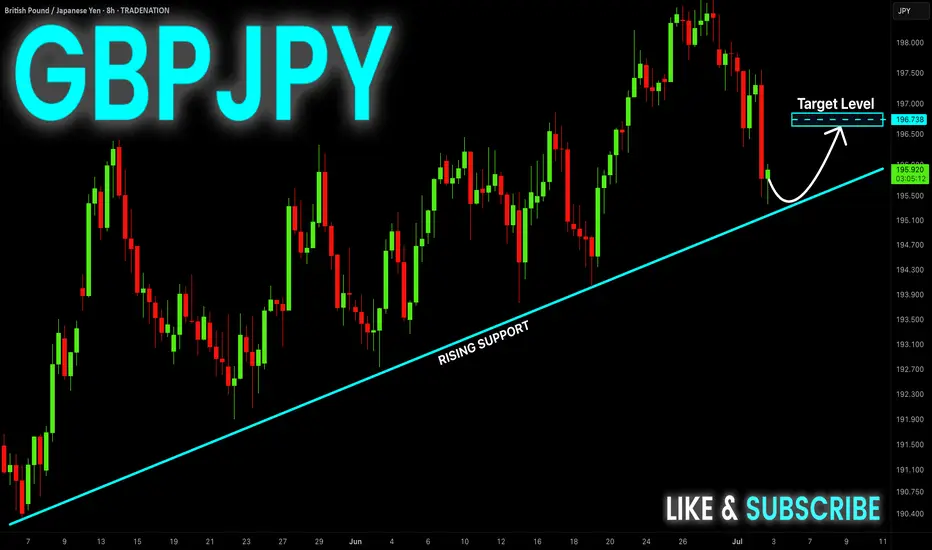
GBP-JPY Correction Ahead! Buy!
Hello,Traders!
GBP-JPY will soon make
A retest of the rising support
Line and as we are bullish
Biased we will be expecting
A local bullish correction
Buy!
Comment and subscribe to help us grow!
Check out other forecasts below too!
Disclosure: I am part of Trade Nation's Influencer program and receive a monthly fee for using their TradingView charts in my analysis.
GBPJPY SHORT DAILY FORECAST Q3 D2 W27 Y25GBPJPY SHORT DAILY FORECAST Q3 D2 W27 Y25
Professional Risk Managers👋
Welcome back to another FRGNT chart update📈
Diving into some Forex setups using predominantly higher time frame order blocks alongside confirmation breaks of structure.
Let’s see what price action is telling us today! 👀
💡Here are some trade confluences📝
✅Daily Order block identified
✅4H Order Block identified
✅1H Order Block identified
🔑 Remember, to participate in trading comes always with a degree of risk, therefore as professional risk managers it remains vital that we stick to our risk management plan as well as our trading strategies.
📈The rest, we leave to the balance of probabilities.
💡Fail to plan. Plan to fail.
🏆It has always been that simple.
❤️Good luck with your trading journey, I shall see you at the very top.
🎯Trade consistent, FRGNT X
Trading balanceTrading balance The price of the asset has rebounded from the balance zone. With the prospect of growth into the resistance zone.
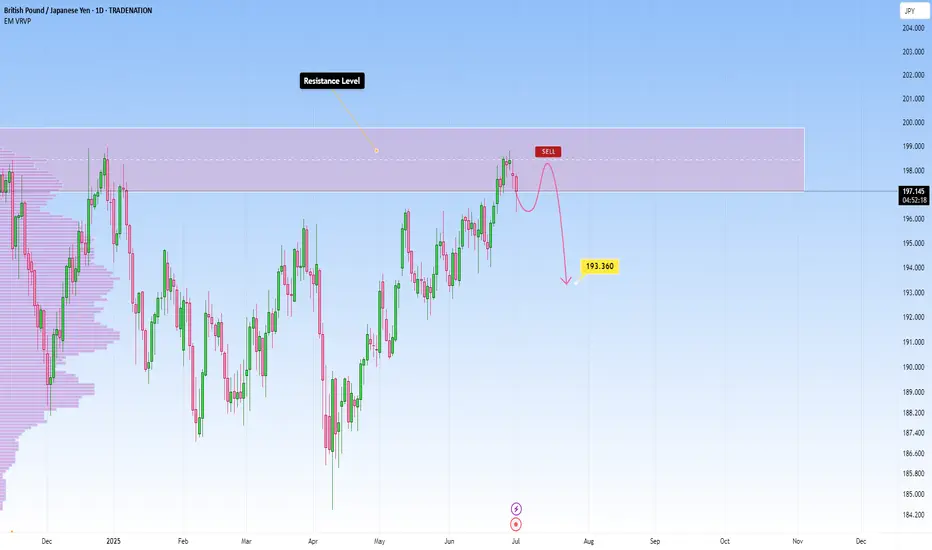
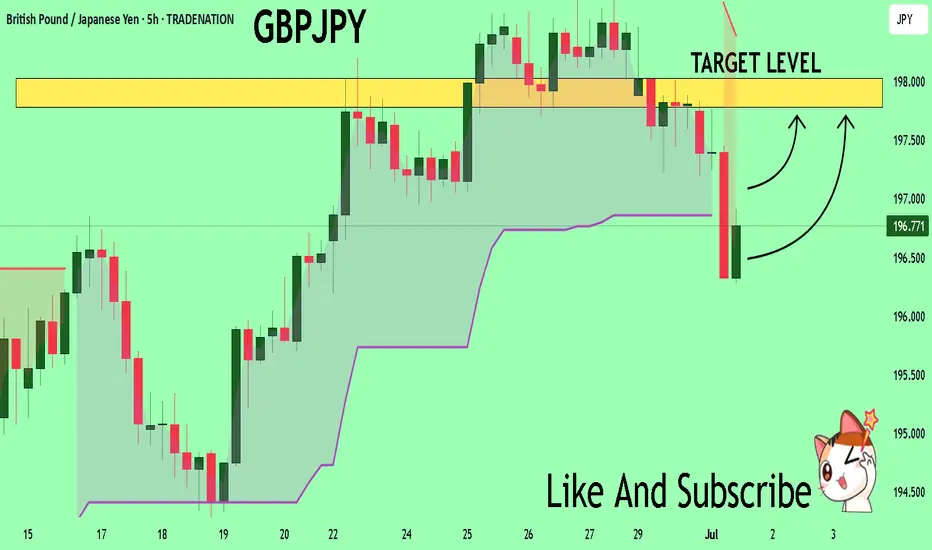
GBPJPY sitting at resistance – Is a drop to 193.360 likely?GBPJPY is sitting right at a key daily resistance zone. This is a level where it has struggled to break through and reversed strongly to the downside. So this makes it definitely one to monitor, especially if you’re eyeing potential short setups.
If we start seeing signs that the price is getting rejected here: like long wicks, strong bearish candles, it could be the early indication of another move lower. My focus is on a moderate drop toward the 193.360 area, similar to what we’ve seen in past pullbacks. Nothing too dramatic, just a simple downside play if sellers step in again.
But if we get a strong breakout? That changes everything: it would hint that bulls are taking full control. This area is pretty important and could give us a better idea of where price is headed next.
Just sharing my thoughts on support and resistance, this isn’t financial advice. Always confirm your setups and manage your risk properly.
Disclosure: I am part of Trade Nation's Influencer program and receive a monthly fee for using their TradingView charts in my analysis.
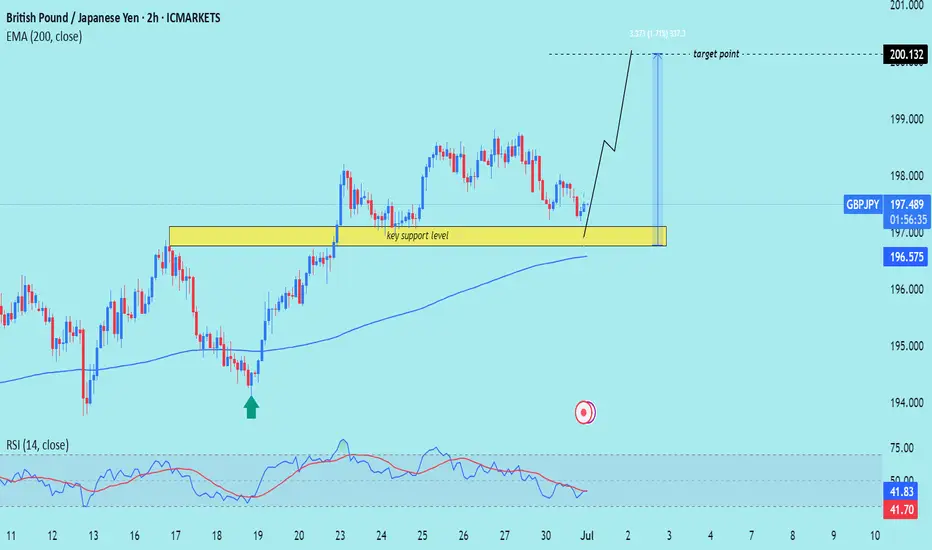
GBP/JPY) back bullish trend analysis Read The captionSMC trading point update
Technical analysis of GBP/JPY on the 2-hour timeframe, signaling a potential rally from a key support area. Here’s a breakdown of this analysis:
---
Technical Breakdown
1. Key Support Zone (Yellow Box):
Price has pulled back to a strong support level around 196.50–197.00.
This level previously acted as resistance and now flipped to support (classic support-resistance flip), marked by the green arrow.
2. EMA 200 as Dynamic Support:
The 200 EMA (~196.567) is just below the support zone, reinforcing the likelihood of a bullish bounce from this area.
3. Bullish Price Projection:
The chart suggests a bounce off this support zone with a projected move toward the target point at 200.132, indicating a +1.71% upside.
4. RSI Indicator (14):
RSI is at 43.47, approaching the oversold region but curving upward — supporting a potential reversal to the upside.
---
Forecasted Move
Expected Move: Bullish reversal from support, targeting 200.132.
The chart outlines a potential entry at current levels, with a bounce confirmed by price respecting the yellow support zone.
Mr SMC Trading point
---
Trading Idea Summary
Bias: Bullish
Entry Zone: Around 196.50–197.00
Stop-Loss: Below support zone (~196.00 or lower)
Take-Profit: 200.132
Confirmation: Bullish candlestick pattern or RSI crossover
plesse support boost 🚀 this analysis
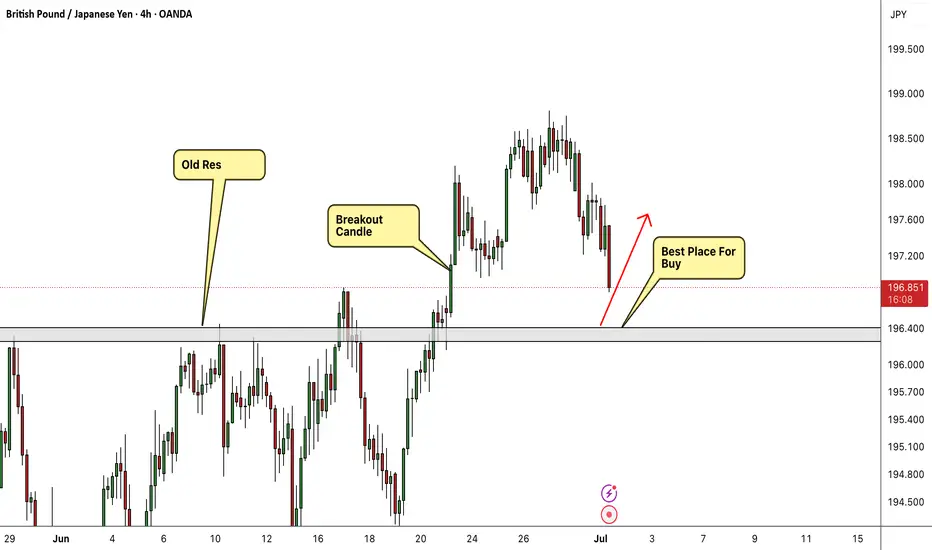
GBP/JPY Best Place To Buy Very Clear , Let`s Get This 200 Pips !Here is my 4H T.F Chart and if we check we will see that we have a very good support area very near the price now and we have already a good breakout and the price never retest the broken res and new supp so i`m waiting the price to retest it and give me any bullish price action and then we can buy it and targeting from 100 to 200 pips . and if we have a daily closure below my support then this idea will not be valid .
GBP_JPY WILL GROW|LONG|
✅GBP_JPY made a pullback
From the resistance above just
As we predicted, however, the
Pair made a retest of the horizontal
Support below around 196.500 and
We are already seeing a beautiful
Rebound so as the pair is in the
Uptrend we will be expecting
A further bullish move up
LONG🚀
✅Like and subscribe to never miss a new idea!✅
Disclosure: I am part of Trade Nation's Influencer program and receive a monthly fee for using their TradingView charts in my analysis.
GBPJPY...LONGPrice is nearing a critical level around . No setup, no trade. For me, a solid plan always comes before any prediction.
If the zone is broken and confirmed with a retest, I’ll adjust my plan accordingly for a possible reverse trade.
GBPJPY On The Rise! BUY!
My dear friends,
Please, find my technical outlook for GBPJPY below:
The instrument tests an important psychological level 196.72
Bias - Bullish
Technical Indicators: Supper Trend gives a precise Bullish signal, while Pivot Point HL predicts price changes and potential reversals in the market.
Target - 197.78
About Used Indicators:
Super-trend indicator is more useful in trending markets where there are clear uptrends and downtrends in price.
Disclosure: I am part of Trade Nation's Influencer program and receive a monthly fee for using their TradingView charts in my analysis.
———————————
WISH YOU ALL LUCK
GBP/JPY BULLISH BIAS RIGHT NOW| LONG
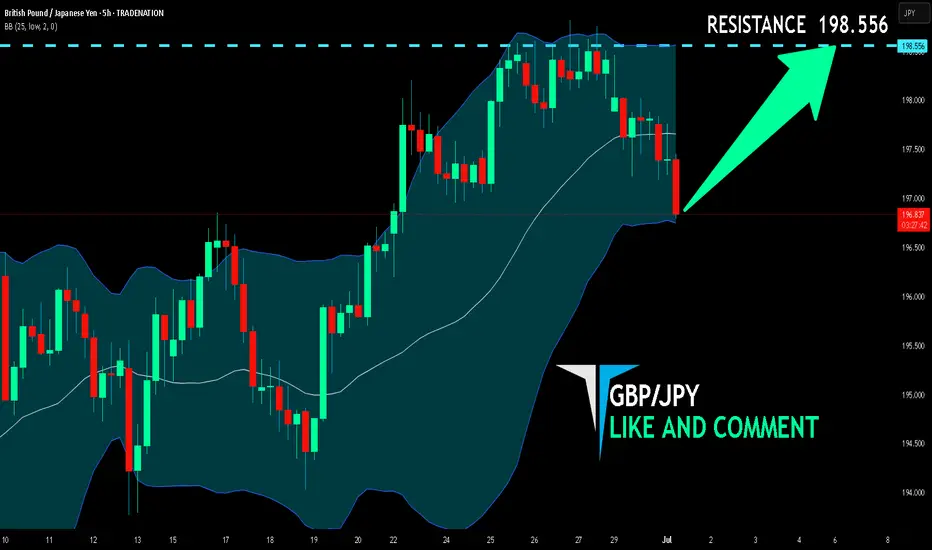
Hello, Friends!
It makes sense for us to go long on GBP/JPY right now from the support line below with the target of 198.556 because of the confluence of the two strong factors which are the general uptrend on the previous 1W candle and the oversold situation on the lower TF determined by it’s proximity to the lower BB band.
Disclosure: I am part of Trade Nation's Influencer program and receive a monthly fee for using their TradingView charts in my analysis.
✅LIKE AND COMMENT MY IDEAS✅
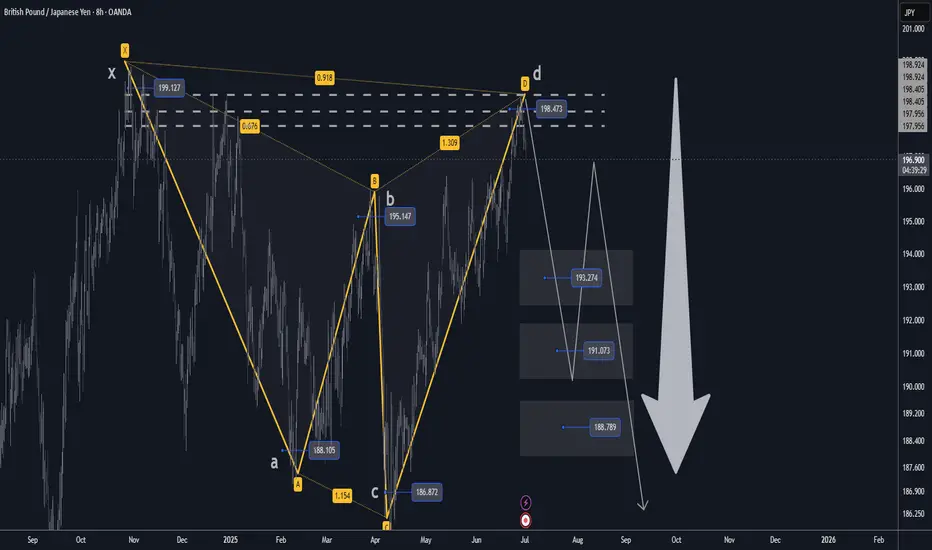
GBPJPY H4 XABCD Short at Market TP Below Market🔸Hello traders, let's review the 4 hour chart for GBPJPY. Strong gains off the lows recently, however price getting overextended and expecting reversal later at/near PRZ/D.
🔸Speculative XABCD structure defined by point X 199 point A 188 point B 195.20 point C 186.80 point D/PRZ 198.40/80 .
🔸Currently most points validated, point D/PRZ validated as well.
Short sell at market SL over point D/PRZ TP details see chart
🔸Recommended strategy for GJ traders: Short Sell at Market
SL over point D/PRZ TP1 193.30 TP2 191.00 TP3 188.80.
🎁Please hit the like button and
🎁Leave a comment to support our team!
RISK DISCLAIMER:
Trading Futures , Forex, CFDs and Stocks involves a risk of loss.
Please consider carefully if such trading is appropriate for you.
Past performance is not indicative of future results.
Always limit your leverage and use tight stop loss.
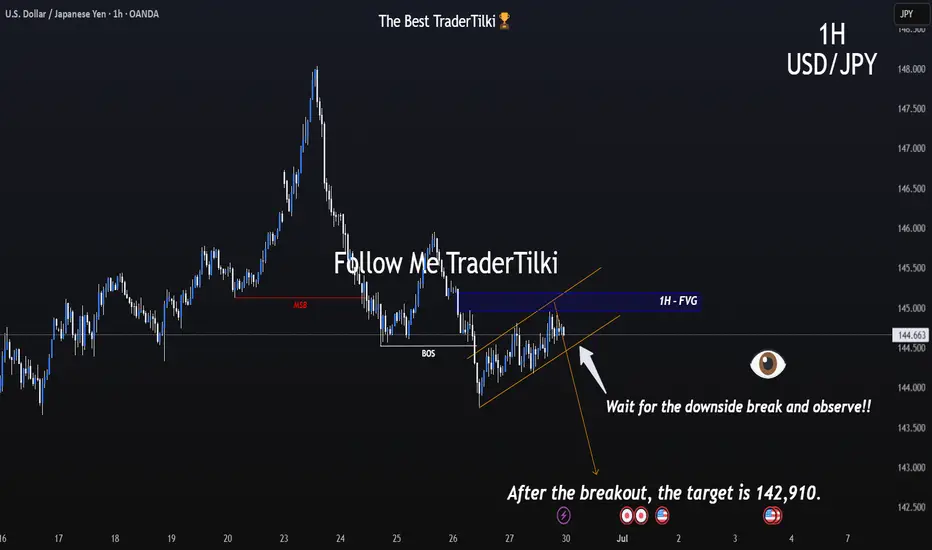
Critical Channel Watch Begins on the 1-Hour Chart of USDJPY.Hey everyone,
📉 My Latest USDJPY Analysis:
USDJPY is currently moving within a downtrend. If the price breaks below the lower boundary of the parallel channel, our first target level will be 142.910. The most crucial factor here is the downward breakout of that channel—don’t overlook it.
Also, keep a close eye on key economic data releases on the fundamental side, as they could significantly influence your strategy.
I meticulously prepare these analyses for you, and I sincerely appreciate your support through likes. Every like from you is my biggest motivation to continue sharing my analyses.
I’m truly grateful for each of you—love to all my followers💙💙💙
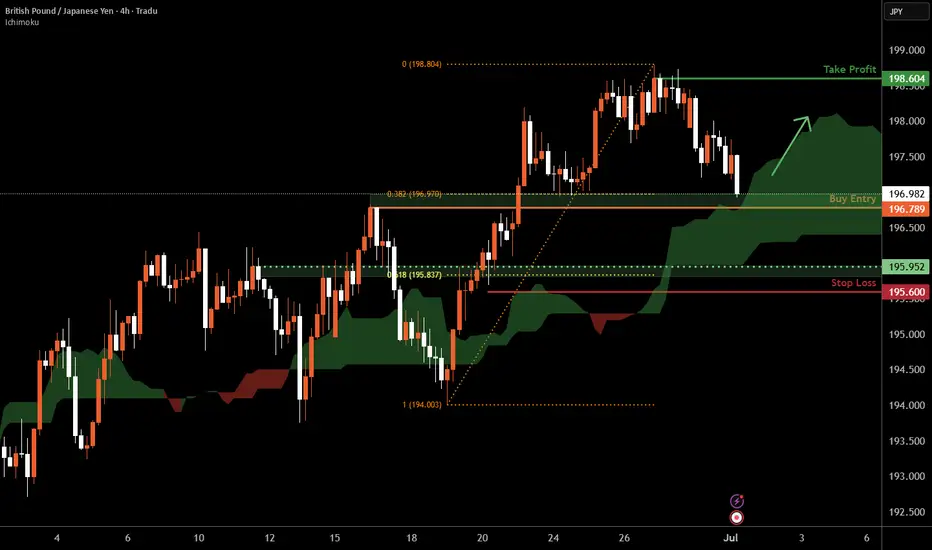
GBP/JPY H4 | Pullback support at 38.2% Fibonacci retracementGBP/JPY is falling towards a pullback support and could potentially bounce off this level to climb higher.
Buy entry is at 196.78 which is a pullback support that aligns closely with the 38.2% Fibonacci retracement.
Stop loss is at 195.60 which is a level that lies underneath a pullback support and the 61.8% Fibonacci retracement.
Take profit is at 198.60 which is a swing-high resistance.
High Risk Investment Warning
Trading Forex/CFDs on margin carries a high level of risk and may not be suitable for all investors. Leverage can work against you.
Stratos Markets Limited (tradu.com ):
CFDs are complex instruments and come with a high risk of losing money rapidly due to leverage. 63% of retail investor accounts lose money when trading CFDs with this provider. You should consider whether you understand how CFDs work and whether you can afford to take the high risk of losing your money.
Stratos Europe Ltd (tradu.com ):
CFDs are complex instruments and come with a high risk of losing money rapidly due to leverage. 63% of retail investor accounts lose money when trading CFDs with this provider. You should consider whether you understand how CFDs work and whether you can afford to take the high risk of losing your money.
Stratos Global LLC (tradu.com ):
Losses can exceed deposits.
Please be advised that the information presented on TradingView is provided to Tradu (‘Company’, ‘we’) by a third-party provider (‘TFA Global Pte Ltd’). Please be reminded that you are solely responsible for the trading decisions on your account. There is a very high degree of risk involved in trading. Any information and/or content is intended entirely for research, educational and informational purposes only and does not constitute investment or consultation advice or investment strategy. The information is not tailored to the investment needs of any specific person and therefore does not involve a consideration of any of the investment objectives, financial situation or needs of any viewer that may receive it. Kindly also note that past performance is not a reliable indicator of future results. Actual results may differ materially from those anticipated in forward-looking or past performance statements. We assume no liability as to the accuracy or completeness of any of the information and/or content provided herein and the Company cannot be held responsible for any omission, mistake nor for any loss or damage including without limitation to any loss of profit which may arise from reliance on any information supplied by TFA Global Pte Ltd.
The speaker(s) is neither an employee, agent nor representative of Tradu and is therefore acting independently. The opinions given are their own, constitute general market commentary, and do not constitute the opinion or advice of Tradu or any form of personal or investment advice. Tradu neither endorses nor guarantees offerings of third-party speakers, nor is Tradu responsible for the content, veracity or opinions of third-party speakers, presenters or participants.
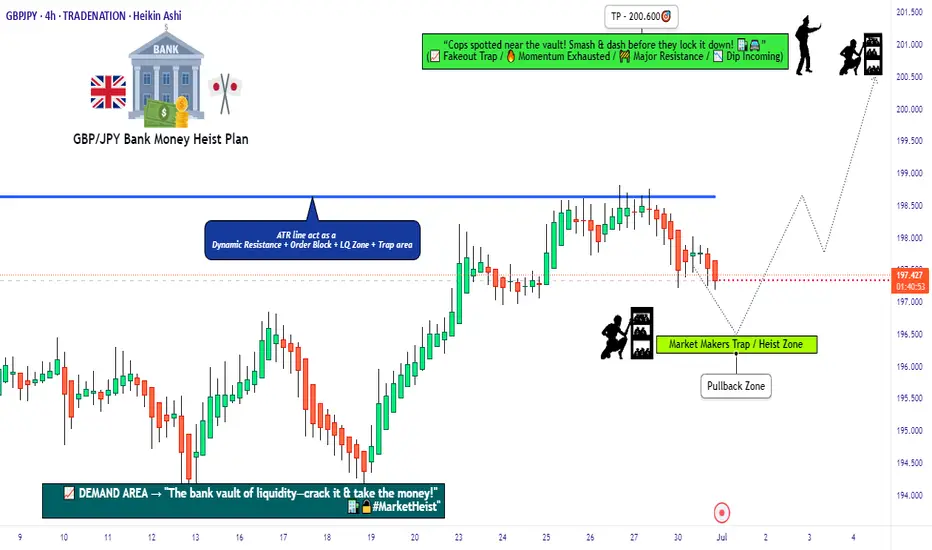
"GBP/JPY: High-Risk Pips Grab – Escape Before Cops! 🏴☠️ GBP/JPY "Dragon Heist" – Bulletproof Bullish Raid (High-Risk, High-Reward) 🚨
🔥 Attention Market Pirates & Profit Raiders! 🔥
(Day/Swing Trade Plan – Long Entry Focused)
🔑 Entry Zone (Vault Cracked!):
"The Dragon’s loot is unguarded! Bullish pullback = prime stealing opportunity."
Buy Limit Orders: Layer entries near 15M/30M swing lows (wick/body). DCA-friendly!
Thief Pro Tip: Scalpers ride long-only waves. Swing traders? Stack slowly, escape rich.
🎯 Target (Escape Routes):
200.600 (or bail early if cops (resistance) swarm!)
🚨 Red Zone = High-Risk Take-Profit (Overbought? Reversal? Police (bears) lurk here!)
⛔ Stop Loss (Emergency Exit):
4H Swing Low/High (Wick-based) – Adjust for risk/lot size!
No martyr trades! SL = your heist survival kit.
📢 Breaking News (Fundamental Edge):
Dragon’s bullish fuel? Macro data, COT reports, sentiment—CHEK THE LIiNKk 👉🔗 (Don’t skip homework!)
💣 Trading Alerts:
News = Landmines! Avoid new trades during releases.
Trailing SL = Your Getaway Car (Lock profits, dodge volatility.)
💥 Boost This Heist!
Smash 👍, hit 🔔, and fund our next raid! Every boost = more stolen pips for the crew.
Stay tuned—another heist drops soon! 🤑 #ForexBandits