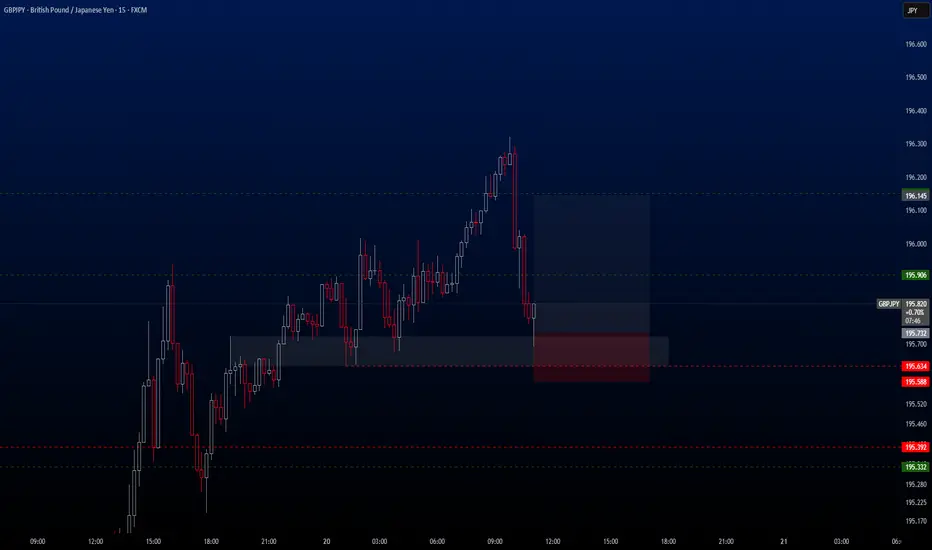
GBPJPY Hello traders. A new buy opportunity has emerged on the GBPJPY pair. As you may have noticed, the pair has been rallying non-stop for the past few days, and even on the M15 and M30 charts, it hasn’t offered many pullback opportunities for entries. But it seems that opportunity is finally here. I’ve activated the trade and wanted to share it with you as well.
🔍 Trade Details
✔️ Timeframe: 15-Minute
✔️ Risk-to-Reward Ratio: 1:2.78
✔️ Trade Direction: Buy
✔️ Entry Price: 195.732
✔️ Take Profit: 196.145
✔️ Stop Loss: 195.588
🔔 Disclaimer: This is not financial advice. I’m simply sharing a trade I’ve taken based on my personal trading system, strictly for educational and illustrative purposes.
📌 Interested in a systematic, data-driven trading approach?
💡 Follow the page and turn on notifications to stay updated on future trade setups and advanced market insights.
D-GBPJPY
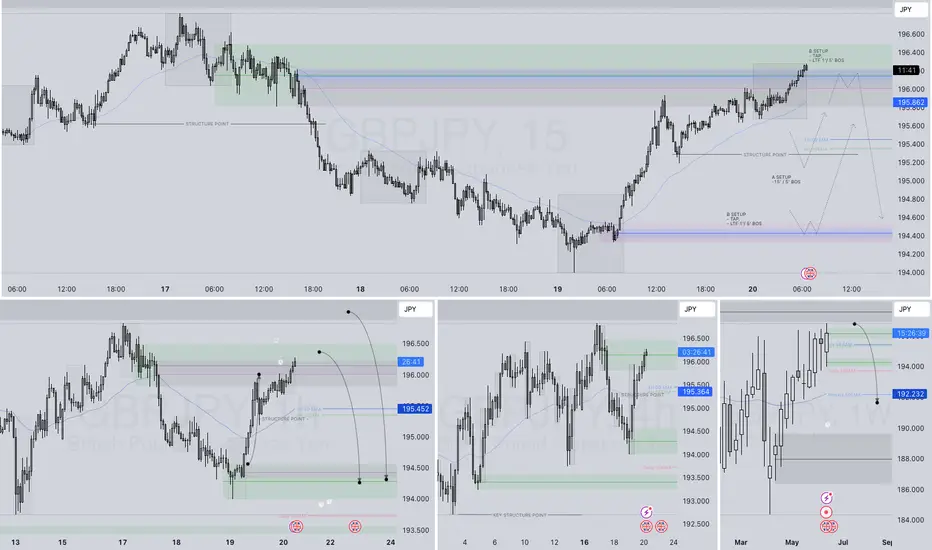
GBPJPY LONG & SHORT FORECAST Q2 W25 D20 Y25GBPJPY LONG & SHORT FORECAST Q2 W25 D20 Y25
Professional Risk Managers👋
Welcome back to another FRGNT chart update📈
Diving into some Forex setups using predominantly higher time frame order blocks alongside confirmation breaks of structure.
Let’s see what price action is telling us today!
💡Here are some trade confluences📝
✅Daily order block
✅15' order block
✅Intraday breaks of structure
✅4H Order block
🔑 Remember, to participate in trading comes always with a degree of risk, therefore as professional risk managers it remains vital that we stick to our risk management plan as well as our trading strategies.
📈The rest, we leave to the balance of probabilities.
💡Fail to plan. Plan to fail.
🏆It has always been that simple.
❤️Good luck with your trading journey, I shall see you at the very top.
🎯Trade consistent, FRGNT X
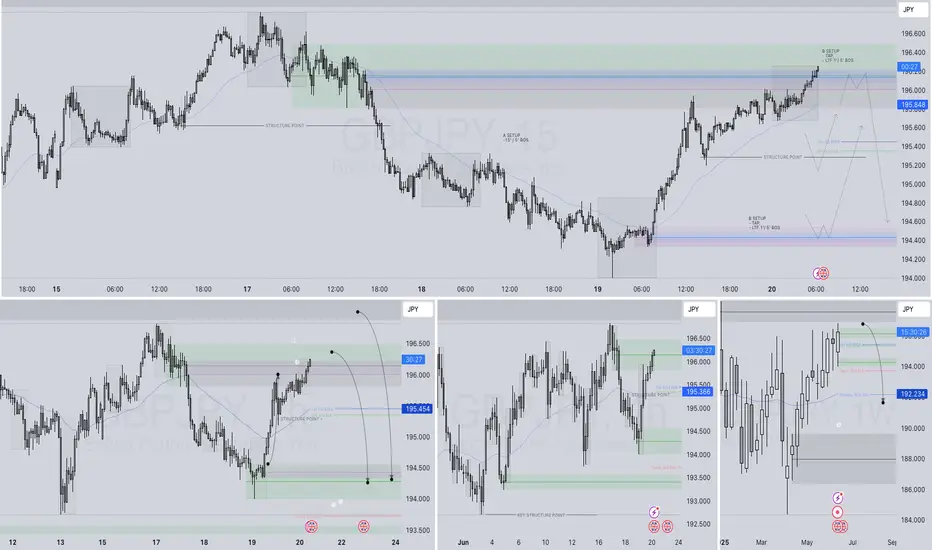
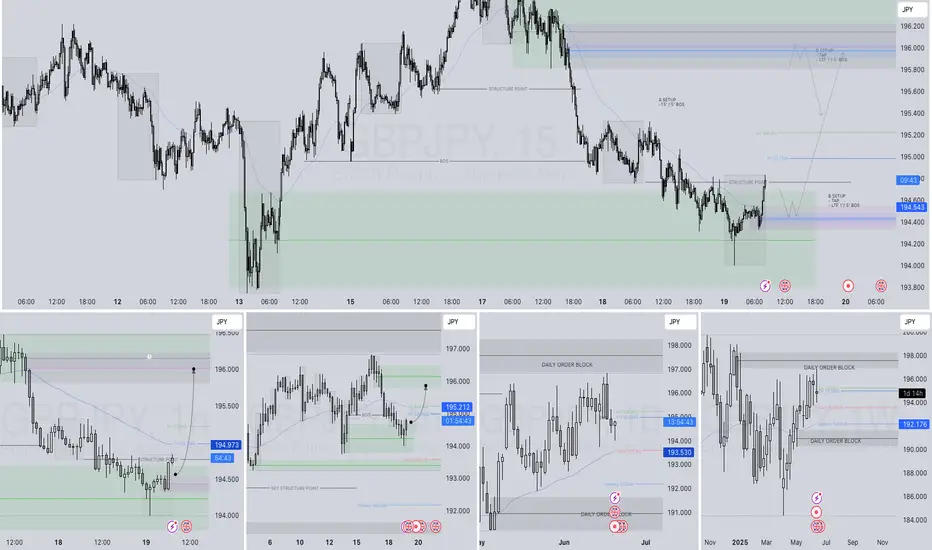
GBPJPY I Expect a Rally from the Buy Zone in the 1H Time FrameDescription:
I'm viewing the 195.116–194.845 range on GBPJPY as a strong buy zone. My target is 196.088. Once the trade setup becomes active or the target is reached, I’ll be sharing an update here. Stay tuned!
I meticulously prepare these analyses for you, and I sincerely appreciate your support through likes. Every like from you is my biggest motivation to continue sharing my analyses.
I’m truly grateful for each of you—love to all my followers💙💙💙

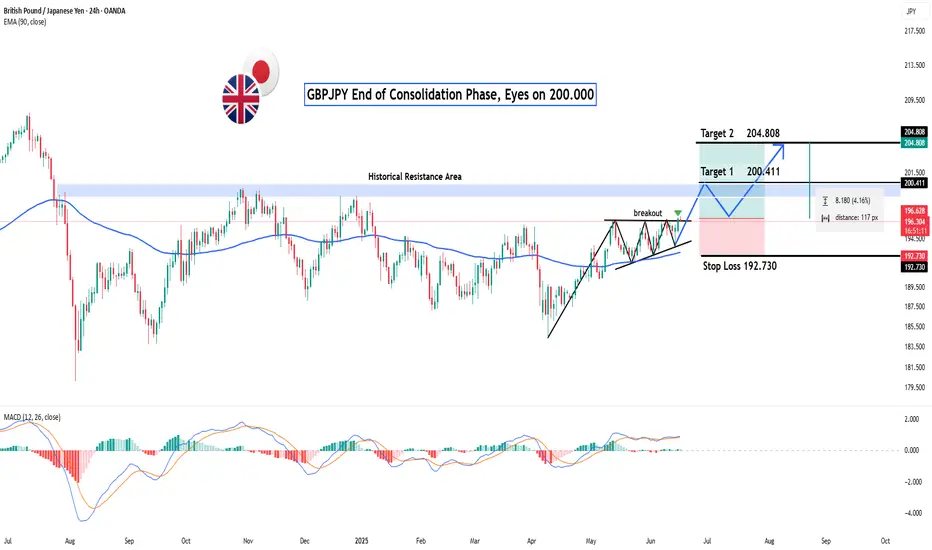
GBPJPY: End of Consolidation Phase, Eyes on 200.000?Hey Realistic Traders!
Could this be the beginning of a major bullish wave ?
Let’s Break It Down..
On the daily timeframe, GBPJPY has formed a Symmetrical Triangle Pattern, followed by a bullish breakout, a classic technical signal that typically marks the end of a consolidation phase and the start of a new bullish trend. This move is further confirmed by the appearance of a strong bullish candlestick, reflecting a surge in buying momentum.
Supporting this bullish scenario, the MACD indicator has also formed a bullish crossover, where the MACD line crosses above the signal line. This crossover is widely regarded as a momentum shift from bearish to bullish, strengthening the case for continued upward movement.
Given these technical signals, the price is likely to advance toward the first target at 200.411, with a potential extension to 204.808.
This bullish outlook remains valid as long as the price holds above the key stop-loss level at 192.730.
Support the channel by engaging with the content, using the rocket button, and sharing your opinions in the comments below.
Disclaimer: "Please note that this analysis is solely for educational purposes and should not be considered a recommendation to take a long or short position on OANDA:GBPJPY ".
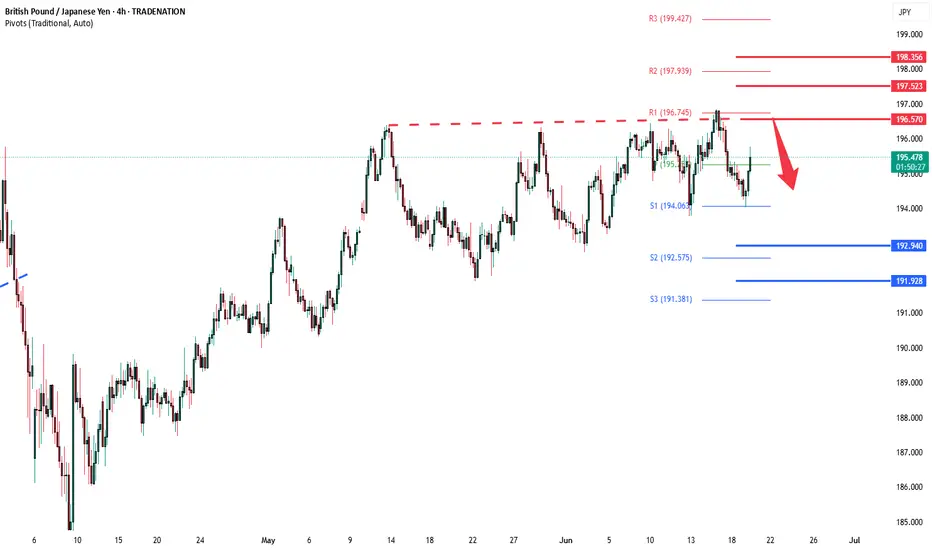
GBPJPY Potential DownsidesHey Traders, in tomorrow's trading session we are monitoring GBPJPY for a selling opportunity around 195.600 zone, GBPJPY is trading in a downtrend and currently is in a correction phase in which in which it is approaching the trend at 195.600 support and resistance area.
Trade safe, Joe.
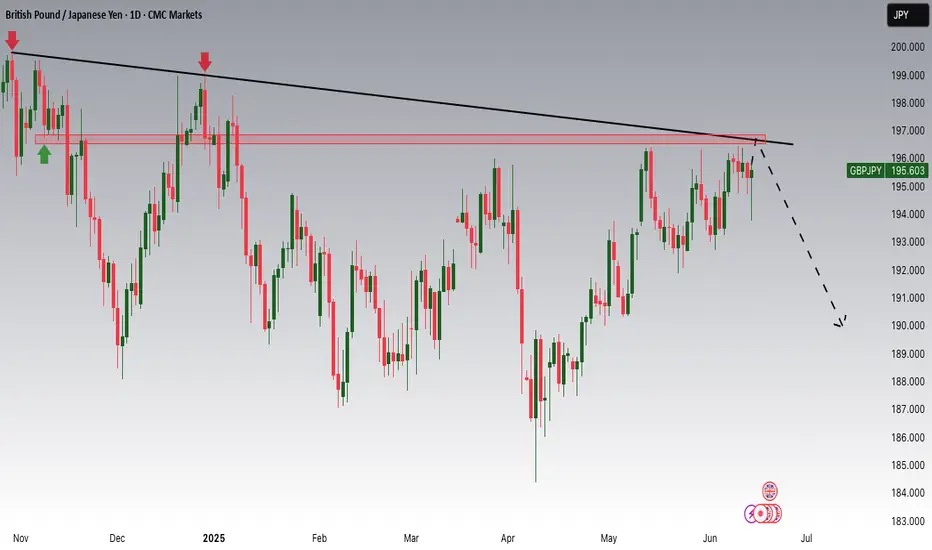
GBPJPY Bearish sideways consolidation capped at 109.50The GBP/JPY currency pair continues to display a bearish outlook, in line with the prevailing downward trend. Recent price action suggests a corrective pullback, potentially setting up for another move lower if resistance holds.
Key Level: 196.50
This zone, previously a consolidation area, now acts as a significant resistance level.
Bearish Scenario (rejection at 196.50):
A failed test and rejection at 196.50 would likely resume the bearish momentum.
Downside targets include:
194.20 – Initial support
193.00 – Intermediate support
191.90 – Longer-term support level
Bullish Scenario (breakout above 196.50):
A confirmed breakout and daily close above 196.50 would invalidate the bearish setup.
In that case, potential upside resistance levels are:
197.50 – First resistance
198.30 – Further upside target
Conclusion
GBP/JPY remains under bearish pressure, with the 196.50 level acting as a key inflection point. As long as price remains below this level, the bias favors further downside toward the 194.20–191.90 region. However, a sustained break above 196.50 would shift sentiment bullish, targeting 197.50 and beyond. Traders should watch for price confirmation around 196.50 to assess the next move.
This communication is for informational purposes only and should not be viewed as any form of recommendation as to a particular course of action or as investment advice. It is not intended as an offer or solicitation for the purchase or sale of any financial instrument or as an official confirmation of any transaction. Opinions, estimates and assumptions expressed herein are made as of the date of this communication and are subject to change without notice. This communication has been prepared based upon information, including market prices, data and other information, believed to be reliable; however, Trade Nation does not warrant its completeness or accuracy. All market prices and market data contained in or attached to this communication are indicative and subject to change without notice.
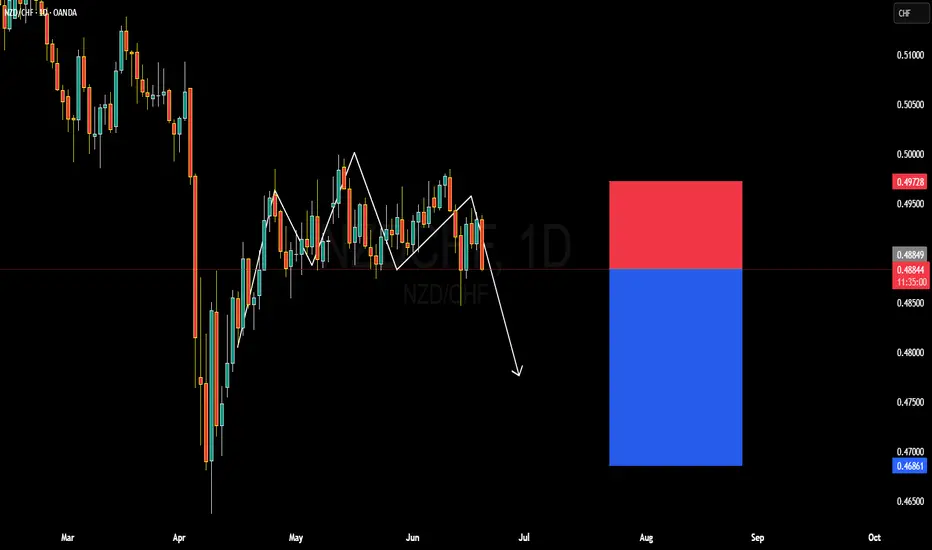
NZDCHF BULLISH OR BEARISH DETAILED ANALYSISNZDCHF is currently trading around the 0.4880–0.4900 zone, and on the daily timeframe, the pair appears to be completing an inverse head and shoulders pattern. However, unlike the typical bullish nature of this pattern, price has failed to break above the neckline and is showing early signs of bearish continuation. The right shoulder has already failed to create a higher high, and recent bearish candlesticks with strong wicks to the upside suggest rejection and downside momentum building. My short bias is supported by this structural weakness and loss of bullish steam.
From a fundamental perspective, the Swiss Franc remains strong due to its safe-haven demand amid lingering global risk aversion and slowing global growth expectations. The Reserve Bank of New Zealand, while on hold recently, has adopted a relatively dovish tone as domestic inflation trends soften. This diverging policy stance between the SNB and RBNZ provides a macroeconomic tailwind favoring CHF strength and NZD weakness. In today’s session, CHF also gained modestly following stronger-than-expected CPI revisions and cautious risk flows in the Asian and European sessions.
Technically, we’ve seen a clean break of the recent support zone near 0.4890, and the market structure has flipped bearish on both the daily and H4 charts. I expect further downside continuation toward the 0.4680–0.4700 range, especially if the current lower highs pattern persists. The bearish flag breakdown and consistent lower closes support continuation toward my 0.46 target. This offers a solid short setup with a favorable risk-reward ratio in play.
I’ll continue monitoring for any pullback toward the 0.4920–0.4950 area for potential re-entries on weakness. Momentum and volume indicators also point lower, aligning with the price action thesis. As long as we stay below 0.4970, the bearish scenario remains active, and I’m looking to capitalize on this developing bearish cycle in NZDCHF.
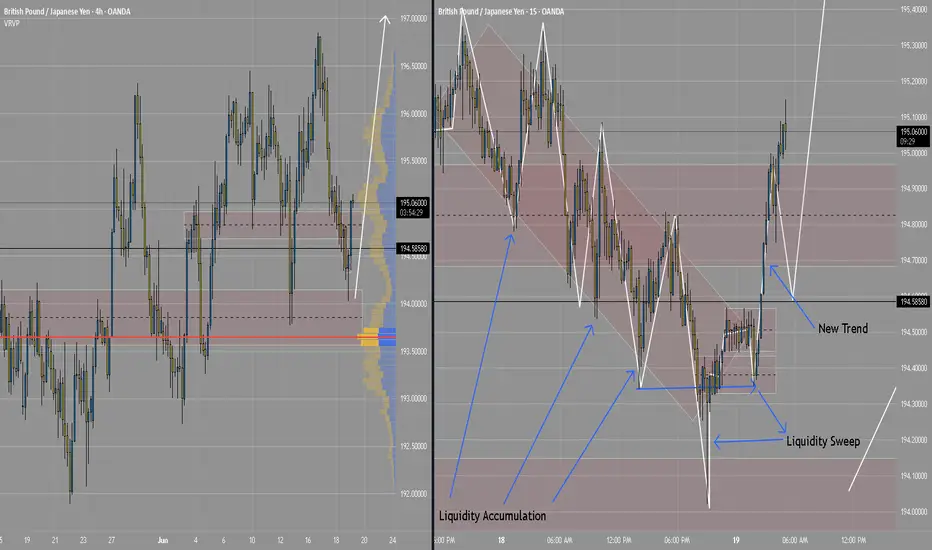
GBPJPYGBPJPY
New trade setup, strong bullish momentum price action has currently moved above the 195.00 handle price action has already created a liquidity sweep at key levels H4 timeframe is in an uptrend, H4 is clearly making higher highs and higher lows. If price action breaks above 195.30 I will look for a retest at that level to go long if price fails at 195.30 I will look for a retest around 194.80 as a possible long entry.
GBPJPY LONG & SHORT FORECAST Q2 W25 D19 Y25GBPJPY LONG & SHORT FORECAST Q2 W25 D19 Y25
Professional Risk Managers👋
Welcome back to another FRGNT chart update📈
Diving into some Forex setups using predominantly higher time frame order blocks alongside confirmation breaks of structure.
Let’s see what price action is telling us today!
💡Here are some trade confluences📝
✅Daily order block
✅15' order block
✅Intraday breaks of structure
✅4H Order block
🔑 Remember, to participate in trading comes always with a degree of risk, therefore as professional risk managers it remains vital that we stick to our risk management plan as well as our trading strategies.
📈The rest, we leave to the balance of probabilities.
💡Fail to plan. Plan to fail.
🏆It has always been that simple.
❤️Good luck with your trading journey, I shall see you at the very top.
🎯Trade consistent, FRGNT X
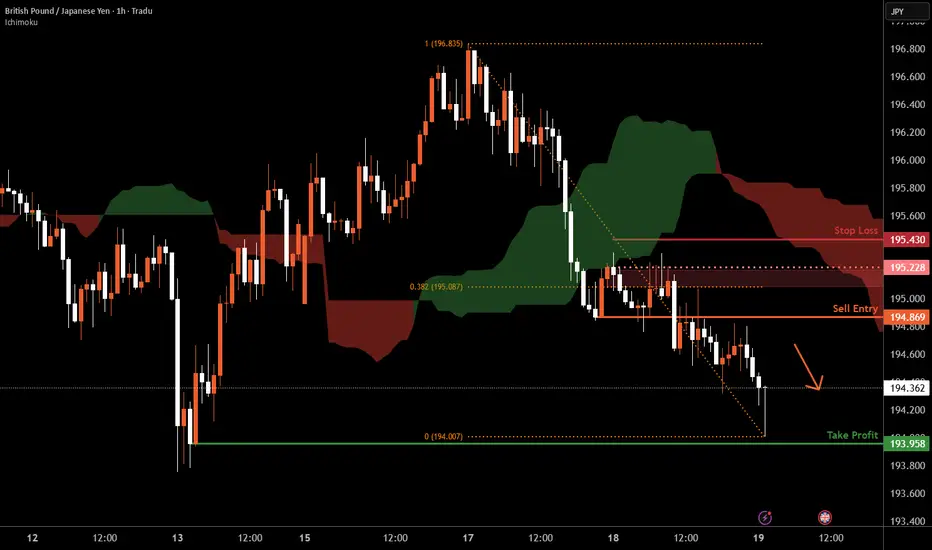
GBP/JPY H1 | Rising into an overlap resistanceGBP/JPY is rising towards an overlap resistance and could potentially reverse off this level to drop lower.
Sell entry is at 194.86 which is an overlap resistance.
Stop loss is at 195.43 which is a level that sits above the 38.2% Fibonacci retracement and a multi-swing-high resistance.
Take profit is at 193.95 which is a swing-low support.
High Risk Investment Warning
Trading Forex/CFDs on margin carries a high level of risk and may not be suitable for all investors. Leverage can work against you.
Stratos Markets Limited (tradu.com ):
CFDs are complex instruments and come with a high risk of losing money rapidly due to leverage. 63% of retail investor accounts lose money when trading CFDs with this provider. You should consider whether you understand how CFDs work and whether you can afford to take the high risk of losing your money.
Stratos Europe Ltd (tradu.com ):
CFDs are complex instruments and come with a high risk of losing money rapidly due to leverage. 63% of retail investor accounts lose money when trading CFDs with this provider. You should consider whether you understand how CFDs work and whether you can afford to take the high risk of losing your money.
Stratos Global LLC (tradu.com ):
Losses can exceed deposits.
Please be advised that the information presented on TradingView is provided to Tradu (‘Company’, ‘we’) by a third-party provider (‘TFA Global Pte Ltd’). Please be reminded that you are solely responsible for the trading decisions on your account. There is a very high degree of risk involved in trading. Any information and/or content is intended entirely for research, educational and informational purposes only and does not constitute investment or consultation advice or investment strategy. The information is not tailored to the investment needs of any specific person and therefore does not involve a consideration of any of the investment objectives, financial situation or needs of any viewer that may receive it. Kindly also note that past performance is not a reliable indicator of future results. Actual results may differ materially from those anticipated in forward-looking or past performance statements. We assume no liability as to the accuracy or completeness of any of the information and/or content provided herein and the Company cannot be held responsible for any omission, mistake nor for any loss or damage including without limitation to any loss of profit which may arise from reliance on any information supplied by TFA Global Pte Ltd.
The speaker(s) is neither an employee, agent nor representative of Tradu and is therefore acting independently. The opinions given are their own, constitute general market commentary, and do not constitute the opinion or advice of Tradu or any form of personal or investment advice. Tradu neither endorses nor guarantees offerings of third-party speakers, nor is Tradu responsible for the content, veracity or opinions of third-party speakers, presenters or participants.
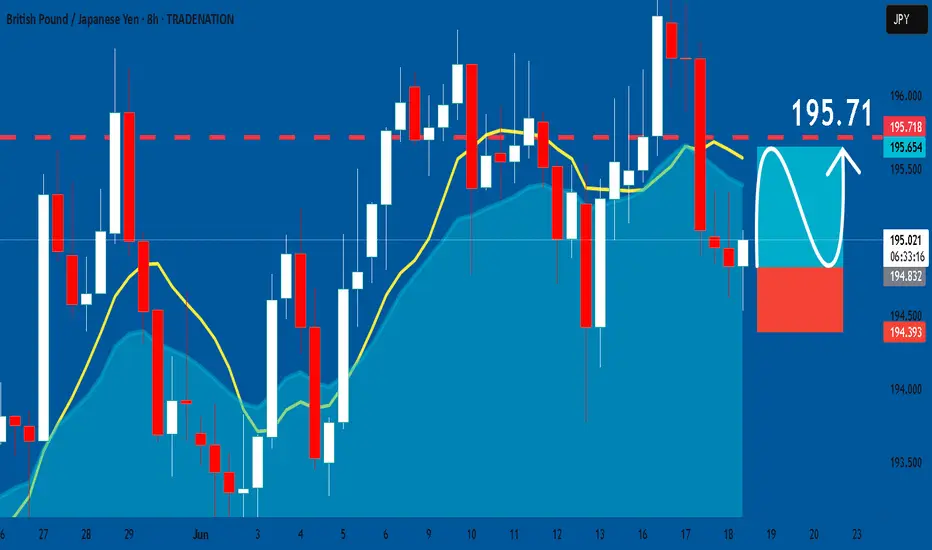
GBPJPY: Long Trade Explained
GBPJPY
- Classic bullish setup
- Our team expects bullish continuation
SUGGESTED TRADE:
Swing Trade
Long GBPJPY
Entry Point - 194.85
Stop Loss - 194.39
Take Profit - 195.71
Our Risk - 1%
Start protection of your profits from lower levels
Disclosure: I am part of Trade Nation's Influencer program and receive a monthly fee for using their TradingView charts in my analysis.
❤️ Please, support our work with like & comment! ❤️
GBPJPY Will Fall! Short!
Here is our detailed technical review for GBPJPY.
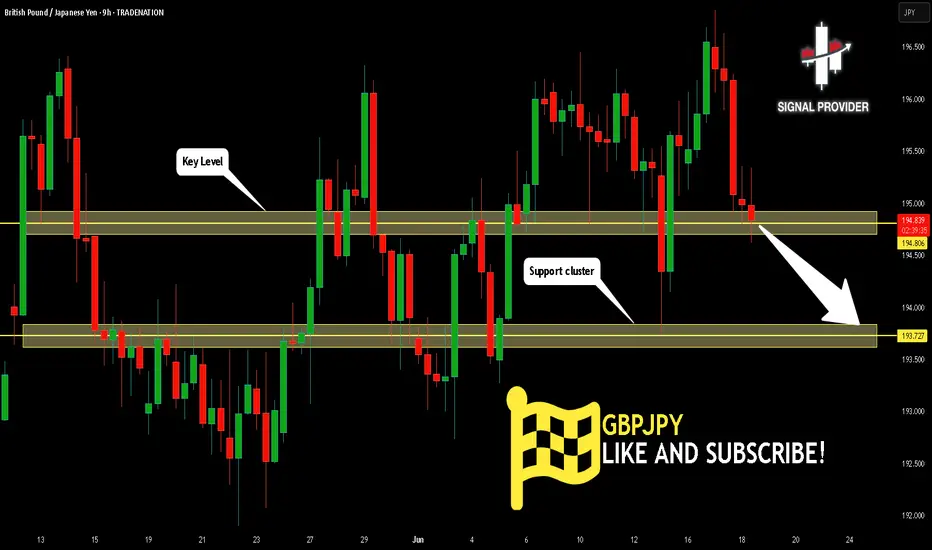
Time Frame: 9h
Current Trend: Bearish
Sentiment: Overbought (based on 7-period RSI)
Forecast: Bearish
The market is trading around a solid horizontal structure 194.806.
The above observations make me that the market will inevitably achieve 193.727 level.
P.S
We determine oversold/overbought condition with RSI indicator.
When it drops below 30 - the market is considered to be oversold.
When it bounces above 70 - the market is considered to be overbought.
Disclosure: I am part of Trade Nation's Influencer program and receive a monthly fee for using their TradingView charts in my analysis.
Like and subscribe and comment my ideas if you enjoy them!
EUR/JPY, GBP/JPY, CAD/JPY, CHF/JPY Price Action SetupsWith the conclusion of the FOMC meeting just hours away, I wanted to move away from the US dollar and look at some crosses. Here are some interesting setups on yen pairs to keep in mind.
Matt Simpson, Market Analyst at City Index and Forex.com

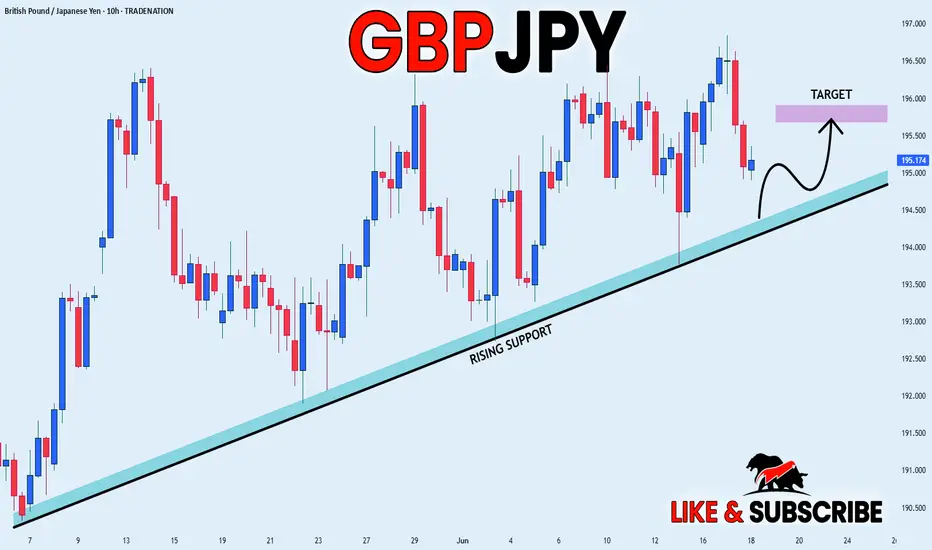
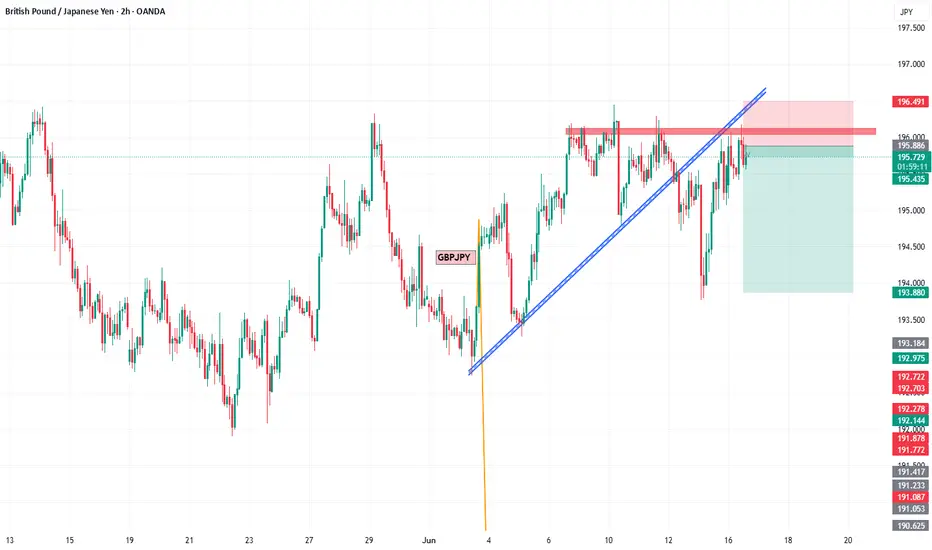
GBP_JPY RISING SUPPORT|LONG|
✅GBP_JPY is trading along the rising support
And as the pair will soon retest it
I am expecting the price to go up
To retest the supply levels above at 195.733
LONG🚀
✅Like and subscribe to never miss a new idea!✅
Disclosure: I am part of Trade Nation's Influencer program and receive a monthly fee for using their TradingView charts in my analysis.
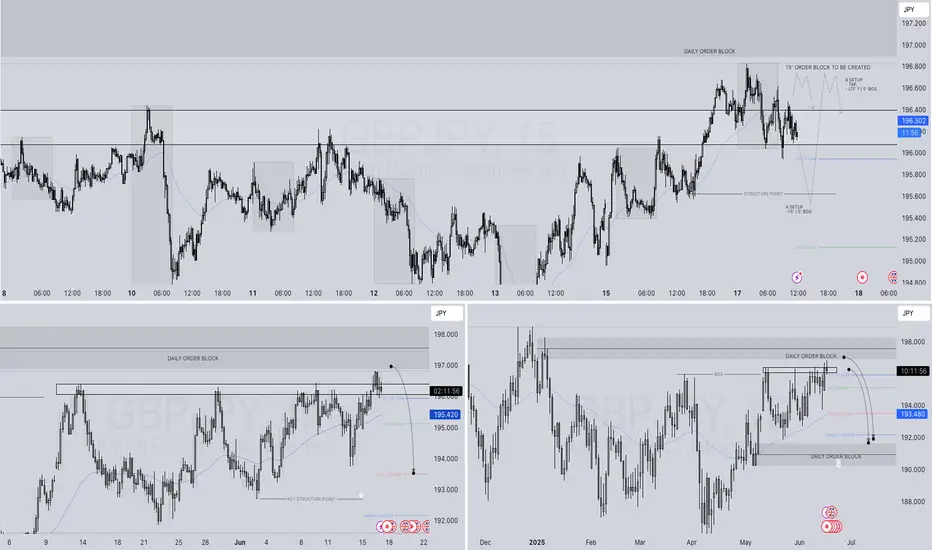
GBPJPY SHORT FORECAST Q2 W25 D17 Y25GBPJPY SHORT FORECAST Q2 W25 D17 Y25
Professional Risk Managers👋
Welcome back to another FRGNT chart update📈
Diving into some Forex setups using predominantly higher time frame order blocks alongside confirmation breaks of structure.
Let’s see what price action is telling us today!
💡Here are some trade confluences📝
✅Daily order block
✅15' order block
✅Intraday breaks of structure
✅Daily high rejection
🔑 Remember, to participate in trading comes always with a degree of risk, therefore as professional risk managers it remains vital that we stick to our risk management plan as well as our trading strategies.
📈The rest, we leave to the balance of probabilities.
💡Fail to plan. Plan to fail.
🏆It has always been that simple.
❤️Good luck with your trading journey, I shall see you at the very top.
🎯Trade consistent, FRGNT X
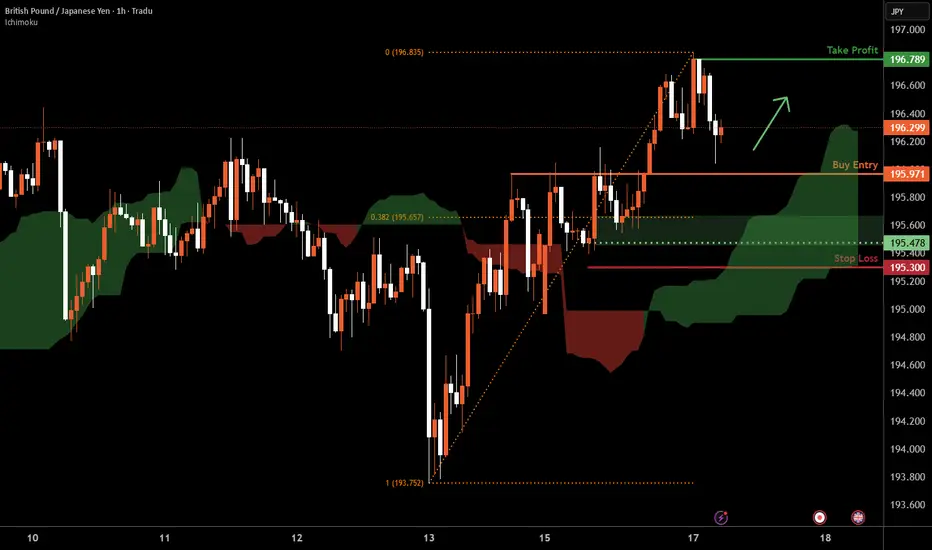
GBP/JPY H1 | Approaching a pullback supportGBP/JPY is falling towards a pullback support and could potentially bounce off this level to climb higher.
Buy entry is at 195.97 which is a pullback support.
Stop loss is at 195.30 which is a level that lies underneath a swing-low support and the 38.2% Fibonacci retracement.
Take profit is at 196.78 which is a swing-high resistance.
High Risk Investment Warning
Trading Forex/CFDs on margin carries a high level of risk and may not be suitable for all investors. Leverage can work against you.
Stratos Markets Limited (tradu.com ):
CFDs are complex instruments and come with a high risk of losing money rapidly due to leverage. 63% of retail investor accounts lose money when trading CFDs with this provider. You should consider whether you understand how CFDs work and whether you can afford to take the high risk of losing your money.
Stratos Europe Ltd (tradu.com ):
CFDs are complex instruments and come with a high risk of losing money rapidly due to leverage. 63% of retail investor accounts lose money when trading CFDs with this provider. You should consider whether you understand how CFDs work and whether you can afford to take the high risk of losing your money.
Stratos Global LLC (tradu.com ):
Losses can exceed deposits.
Please be advised that the information presented on TradingView is provided to Tradu (‘Company’, ‘we’) by a third-party provider (‘TFA Global Pte Ltd’). Please be reminded that you are solely responsible for the trading decisions on your account. There is a very high degree of risk involved in trading. Any information and/or content is intended entirely for research, educational and informational purposes only and does not constitute investment or consultation advice or investment strategy. The information is not tailored to the investment needs of any specific person and therefore does not involve a consideration of any of the investment objectives, financial situation or needs of any viewer that may receive it. Kindly also note that past performance is not a reliable indicator of future results. Actual results may differ materially from those anticipated in forward-looking or past performance statements. We assume no liability as to the accuracy or completeness of any of the information and/or content provided herein and the Company cannot be held responsible for any omission, mistake nor for any loss or damage including without limitation to any loss of profit which may arise from reliance on any information supplied by TFA Global Pte Ltd.
The speaker(s) is neither an employee, agent nor representative of Tradu and is therefore acting independently. The opinions given are their own, constitute general market commentary, and do not constitute the opinion or advice of Tradu or any form of personal or investment advice. Tradu neither endorses nor guarantees offerings of third-party speakers, nor is Tradu responsible for the content, veracity or opinions of third-party speakers, presenters or participants.
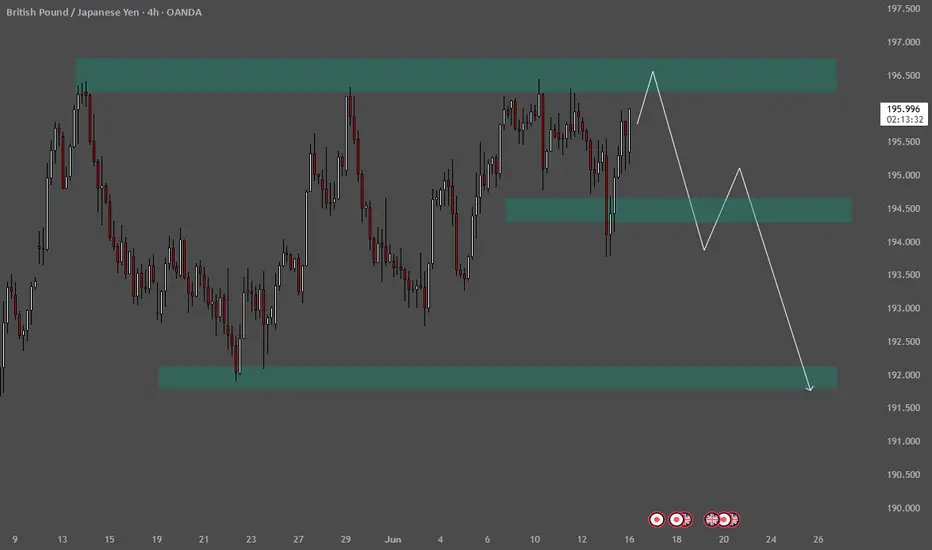
Price has shown reactions here both as support and resistance.📊 GBPJPY 4H Technical Analysis Overview:
The chart displays a well-structured range-bound market with price moving between key supply and demand zones, suggesting potential for both continuation and reversal setups.
🔹 Key Zones:
Resistance Zone (Supply): 196.300 – 196.700
Price has previously reversed from this area multiple times, indicating strong selling pressure.
Mid-level Support/Resistance Zone: Around 194.300 – 194.800
This zone is acting as a decision point; price has shown reactions here both as support and resistance.
Major Demand Zone: 191.700 – 192.200
Strong historical buying pressure from this level, likely to act as a key support if price drops.
🔀 Price Projections:
Bullish Scenario:
A short-term push towards the resistance zone could occur, testing the 196.500 region before any major move.
Bearish Scenario (Primary Projection):
If price gets rejected from the resistance zone, we may see a bearish reversal breaking through the mid-support zone and eventually targeting the lower demand zone (around 192.000).
📌 Outlook:
Price is currently approaching a critical resistance area. Watch for signs of rejection or confirmation before entering short positions. A clean break below the 194.300 support zone would validate the bearish continuation setup.
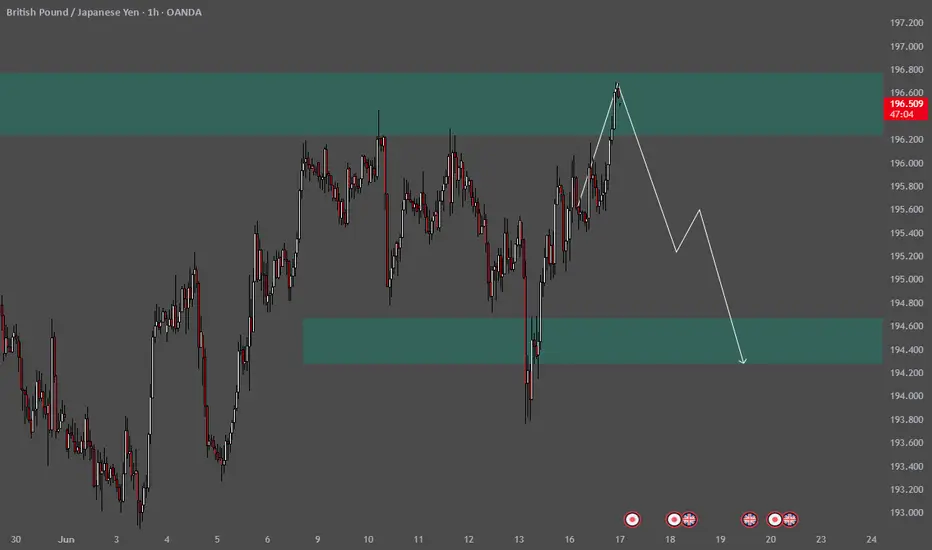
Price has shown reactions here both as support and resistance. Chart Analysis Summary:
Timeframe: 1H (1 Hour)
Instrument: GBP/JPY (OANDA broker)
Analysis Type: Price Action / Supply & Demand Zones
🔍 Key Observations:
Supply Zone (Resistance Area):
The top green box (around 196.500 - 196.800) represents a supply zone.
Price is projected to reach this zone before reversing.
This area has historically rejected price, suggesting strong seller presence.
Bearish Projection:
A bearish arrow shows the expectation that price will reverse from the supply zone.
The chartist anticipates a drop after hitting this resistance.
Demand Zone (Support Area):
The bottom green box (around 194.300 - 194.600) marks a demand zone.
It’s the potential target area where price might find support and possibly bounce again.
Market Structure:
The chart indicates a potential lower high formation after price hits resistance.
This structure supports a bearish scenario toward the demand zone.
📉 Trade Idea (Implied):
Sell setup near the 196.600 - 196.800 resistance zone.
Take profit around the 194.400 demand zone.
Risk: Price might break above the supply zone, invalidating the bearish scenario.
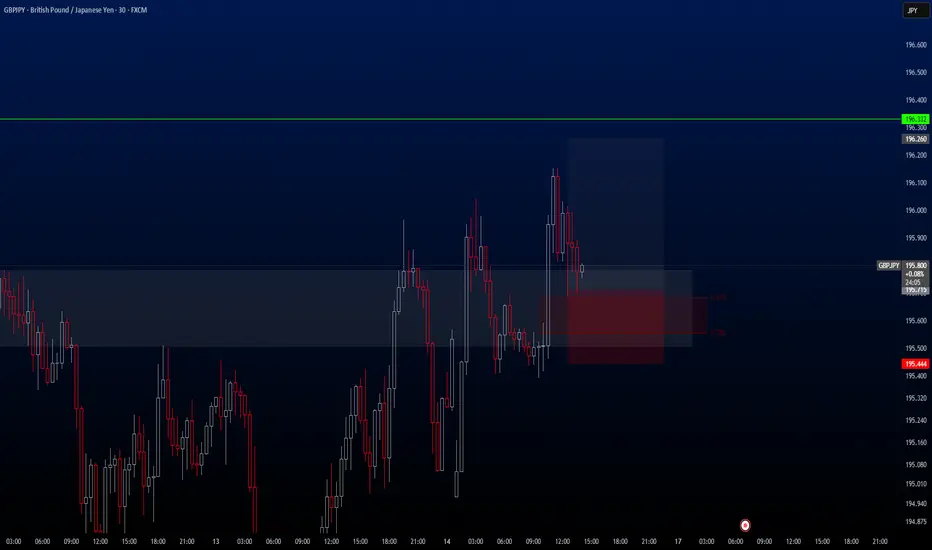
GBPJPY Hello traders.
Today's first trade comes from the GBPJPY pair. The trade is currently active on my side, and I’m happy to share it with you as well.
🔍 Trade Details
✔️ Timeframe: 15-Minute
✔️ Risk-to-Reward Ratio: 1:2
✔️ Trade Direction: Buy
✔️ Entry Price: 195.715
✔️ Take Profit: 196.260
✔️ Stop Loss: 195.444
🔔 Disclaimer: This is not financial advice. I’m simply sharing a trade I’ve taken based on my personal trading system, strictly for educational and illustrative purposes.
📌 Interested in a systematic, data-driven trading approach?
💡 Follow the page and turn on notifications to stay updated on future trade setups and advanced market insights.
GBPJPY SELLBy utilizing levels, historical patterns, , we can formulate a hypothesis that the market might follow a similar trajectory if bearish sentiment prevails.
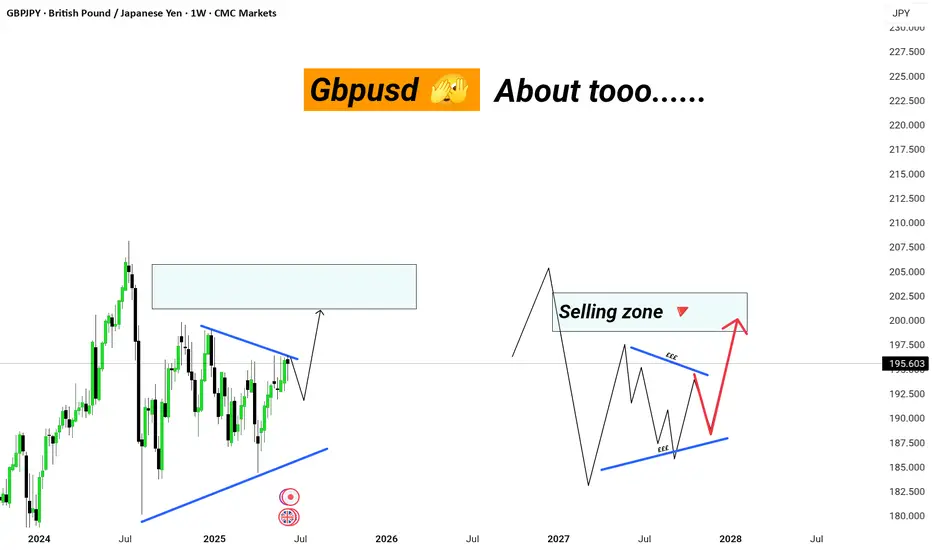
GBPJPY. |||. HITTING selling zone soonthe zone followed by a sharp rejection.
---
🧠 Smart Money Insight:
Possible SMC-style reaction anticipated:
Liquidity inducement above highs
Sharp rejection from seller zone
BOS (Break of Structure) for confirmation
Right-side inset illustration highlights expected distribution before drop.
---
🔎
---
🧩 Trading Plan:
Wait for price action confirmation in the supply zone.
Look for M15/H1 shift in structure and strong bearish engulfing patterns.
Risk management is key: Place stop-loss above zone highs.
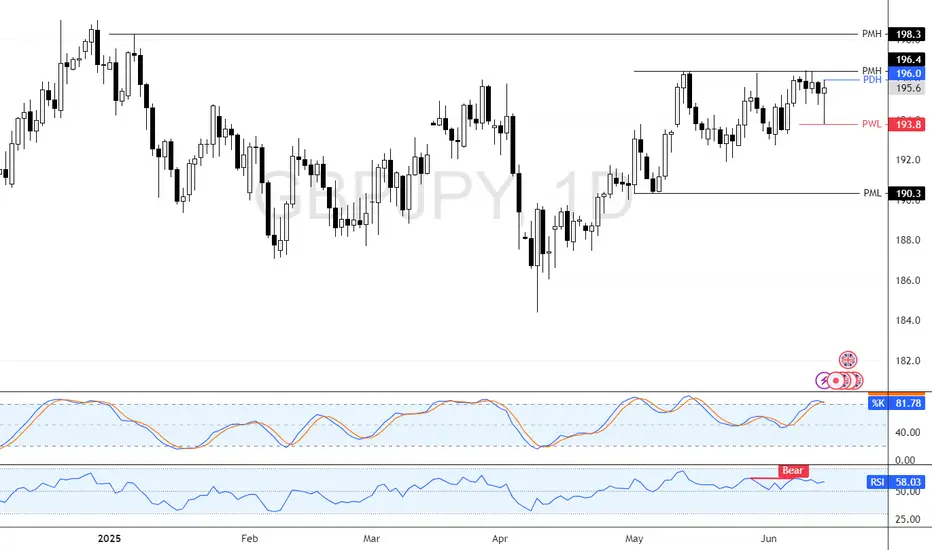
GBP/JPY Tests 196.4FenzoFx—GBP/JPY is testing the 196.4 monthly high, a fragile resistance after four previous attempts.
On Friday, bulls pushed higher with a long-wick candlestick, but the Stochastic Oscillator signals an overbought market.
The bullish trend remains intact if GBP/JPY holds above 193.8 support. A breakout above 196.4 may target 198.3, while closing below support could shift momentum downward.