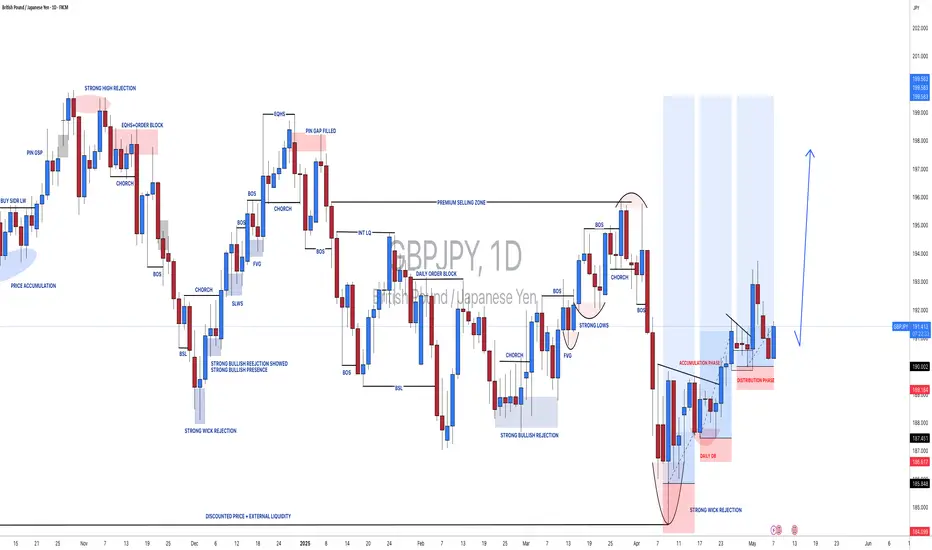
GBPJPY UPDATE!!Good day traders, I am back again with an update and this time it's on GBP/JPY. On the 1st of June I posted a setup but I mentioned that I will explain it later because I will be able to make my point clearer and easy to understand.
When this setup was posted I had that daily order block in mind, only because I needed to see it revisit the order block for the last time before price could make a run for that internal liquidity resting inside an unfilled FVG(BISI). We can also use that thought as confluence when looking for short term reversals or partial exits. Just by taking a look on the chart I posted again I will put it in the description below, you can see in the sell side of the chart we have a lot of equal lows and ICT teaches us that price looks for relative lows/equal lows and old lows.
On the daily TF price is currently inside a bearish order block and what we do not wanna see is price going over the wick of that wick of a candle that was booked on the 29th of May. We are also inside the premium zone of the wick meaning we can expect to run from there to our objectives below. As always my first objective is always the internal liquidity and that is only because that internal liquidity are my LTF | Highs/Lows.
On the 4H price is inside a balanced price range again that's in my favour meaning I have to note it. ICT teaches that we always wanna trade towards the direction where all our PD arrays are lining up and in this case, it's in the sellside, I believe we are in the starting phase of ICT's sell model.
My name is Teboho Matla but you...you don't know me yet!!
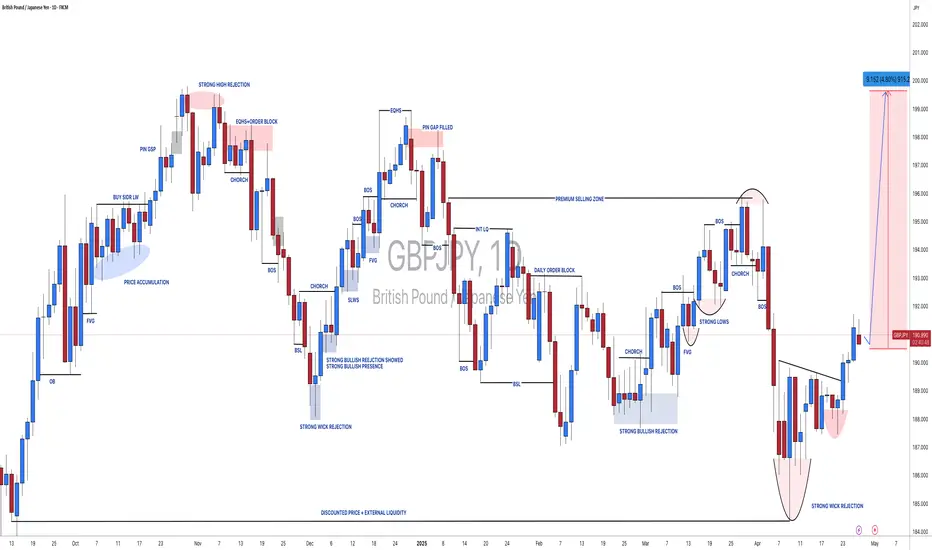
D-GBPJPY
GBPJPY: Weekly OverviewHello Traders,
Everything is clear in the chart. the yellow line is a HTF resistance.
********************************************************
The indicated levels are determined based on the most reaction points and the assumption of approximately equal distance between the zones.
Some of these points can also be confirmed by the mathematical intervals of Murray.
You can enter with/without confirmation. IF you want to take confirmation you can use LTF analysis, Spike move confirmation, Trend Strength confirmation and ETC.
SL could be placed below the zone or regarding the LTF swings.
TP is the next zone or the nearest moving S&R, which are median and borders of the drawn channels.
*******************************************************************
Role of different zones:
GREEN: Just long trades allowed on them.
RED: Just Short trades allowed on them.
BLUE: both long and short trades allowed on them.
WHITE: No trades allowed on them! just use them as TP points
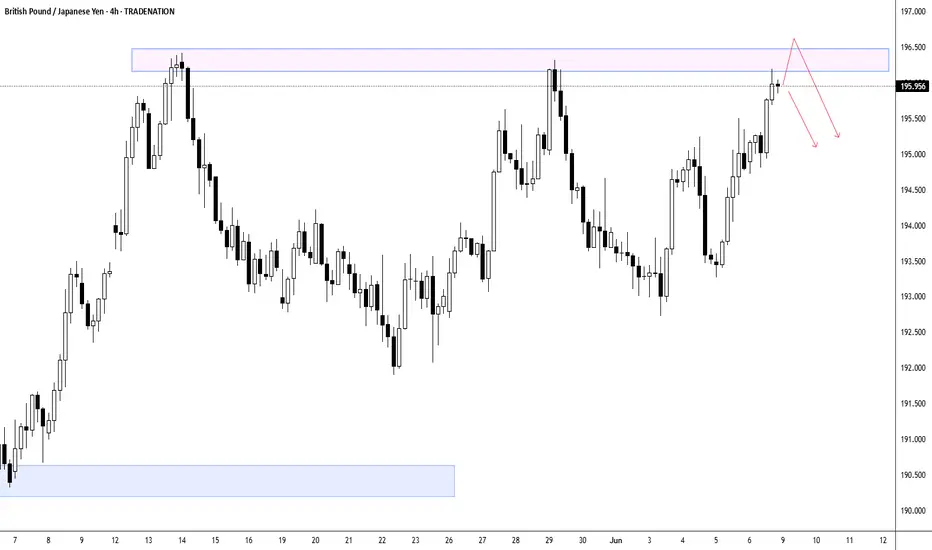
GBPJPY - Major Resistance Zone Threatens Further UpsideThe GBP/JPY 4-hour chart reveals the pair is approaching a critical resistance zone around the 196.00-196.50 level, marked by the upper boundary of the highlighted rectangular area, which represents a significant technical ceiling that has been tested multiple times over the past month. This resistance level coincides with previous swing highs and appears to be acting as a formidable barrier to further upside progress, suggesting that traders should exercise heightened caution as selling pressure is likely to intensify in this area. The pair's recent rally from the May lows around 190.50 has been impressive, but the multiple rejections from this upper resistance zone indicate that institutional sellers may be positioned to defend these levels aggressively. Given the historical significance of this resistance area and the potential for profit-taking after the substantial advance, market participants should be prepared for increased volatility and possible reversal signals as the pair approaches or tests this key technical barrier, making risk management particularly crucial at current levels.
Disclosure: I am part of Trade Nation's Influencer program and receive a monthly fee for using their TradingView charts in my analysis.
GBPJPY: 1050+ Pips Move! Will JPY continue dropping? In our previous analysis, we anticipated a similar move for GBPJPY, but the price dropped a bit further than expected. It’s now in a position to buy long, but please use accurate risk management as JPY pairs are likely to remain more volatile than ever. There are three targets you can keep an eye on: 197, then 200. Remember, trading involves risk, so make your own decisions.
Good luck and trade safely!
Thank you for your unwavering support! 😊
If you’d like to contribute, here are a few ways you can help us:
- Like our ideas
- Comment on our ideas
- Share our ideas
Team Setupsfx_
❤️🚀
#GBPJPY: +916 Pips Swing Buy Opportunity! Comment Down Your ViewThe FX:GBPJPY price has moved nicely from 187 to 191, almost +400 pips. I expect a small correction, but then the bullish move should continue towards the 200 region. You can set a target based on your analysis or set it at 200, whichever works for you. Good luck and trade safely.
Good luck and trade safely!
Thank you for your unwavering support! 😊
If you’d like to contribute, here are a few ways you can help us:
- Like our ideas
- Comment on our ideas
- Share our ideas
Team Setupsfx_
❤️🚀
GBP/JPY - 8H Analysis - High Probability SetupGBP/JPY 8H Analysis – High Probability Trade Setup
This chart shows a classic 5-wave bullish Elliott Wave structure, with price currently breaking out of the wave (4) consolidation.
🔍 Bias: Bullish breakout continuation (Wave 5 in progress)
📌 Key Confluences:
Wave (4) respected both demand zone and trendline support.
Price has now cleared the Swing Range resistance, turning structure bullish.
Supported by the Ichimoku cloud base and a rising trendline.
Strong bullish volume picking up — confirms breakout strength.
🎯 Trade Idea:
Buy GBP/JPY at 195.50–195.90
Stop Loss: Below 192.50 (under swing low and cloud)
Take Profit: 200.00 – 202.00 (1:2+ RR to wave (5) target)
⚠️ Risk Note: Wait for a candle close above 196.00 for added confirmation if cautious. Ideal for momentum continuation traders.
This setup offers a textbook Elliott Wave 5 opportunity, backed by structure, volume, and breakout confirmation — a clean bullish trade with strong technical backing.

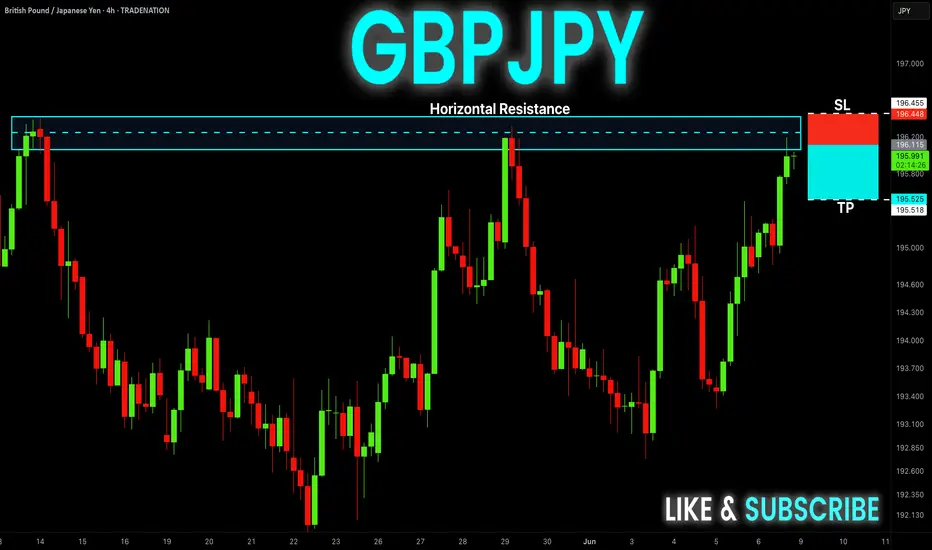
GBP-JPY Free Signal! Sell!
Hello,Traders!
GBP-JPY made a retest of
The strong horizontal resistance
Of 196.260 and the pair seems
To be locally overbought
So we will go short with
The Take Profit of 195.525
And the Stop Loss of 196.455
Sell!
Comment and subscribe to help us grow!
Check out other forecasts below too!
Disclosure: I am part of Trade Nation's Influencer program and receive a monthly fee for using their TradingView charts in my analysis.
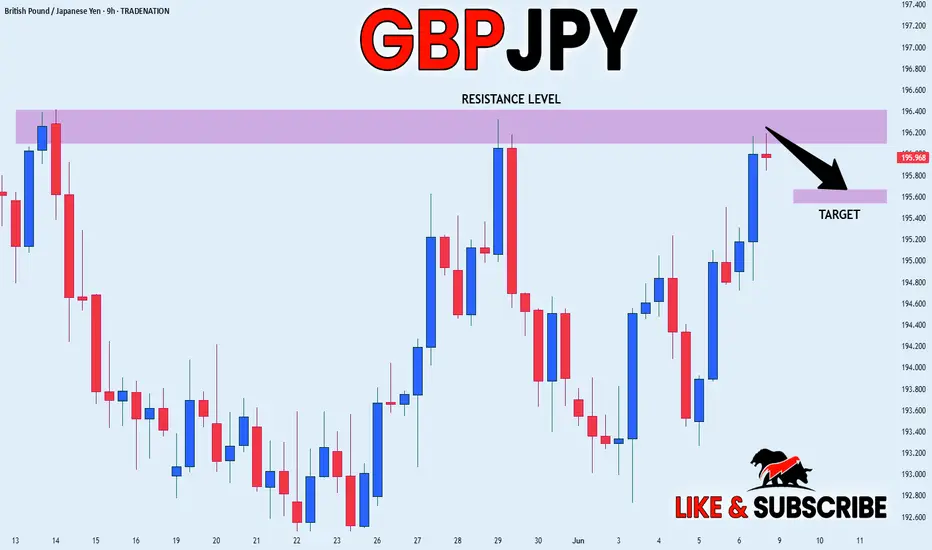
GBP_JPY WILL FALL|SHORT|
✅GBP_JPY went up sharply
But a strong resistance level was hit at 196.400
Thus I am expecting a pullback
And a move down towards the target of 195.671
SHORT🔥
✅Like and subscribe to never miss a new idea!✅
Disclosure: I am part of Trade Nation's Influencer program and receive a monthly fee for using their TradingView charts in my analysis.
GBPJPY Under Pressure! SELL!
My dear friends,
Please, find my technical outlook for GBPJPY below:
The price is coiling around a solid key level - 195.26
Bias - Bearish
Technical Indicators: Pivot Points High anticipates a potential price reversal.
Super trend shows a clear sell, giving a perfect indicators' convergence.
Goal - 194.44
About Used Indicators:
The pivot point itself is simply the average of the high, low and closing prices from the previous trading day.
Disclosure: I am part of Trade Nation's Influencer program and receive a monthly fee for using their TradingView charts in my analysis.
———————————
WISH YOU ALL LUCK
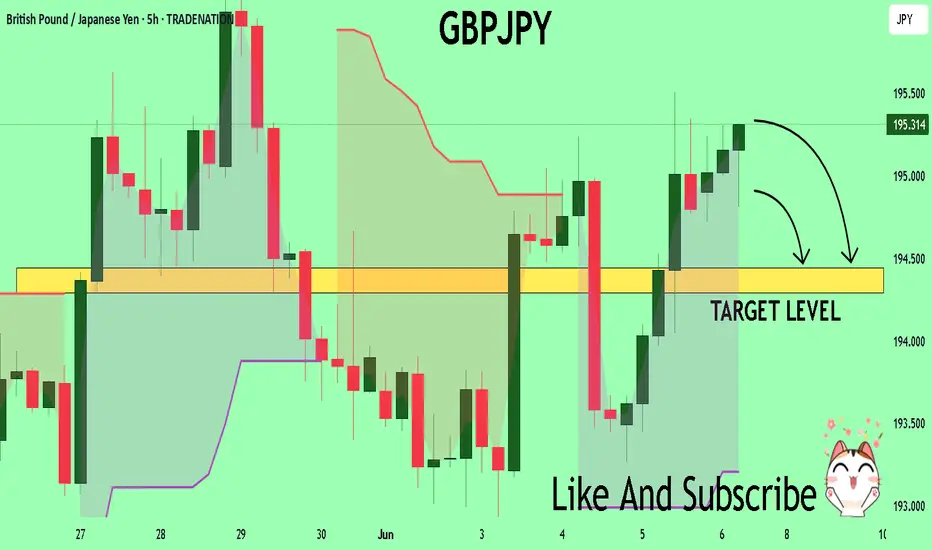
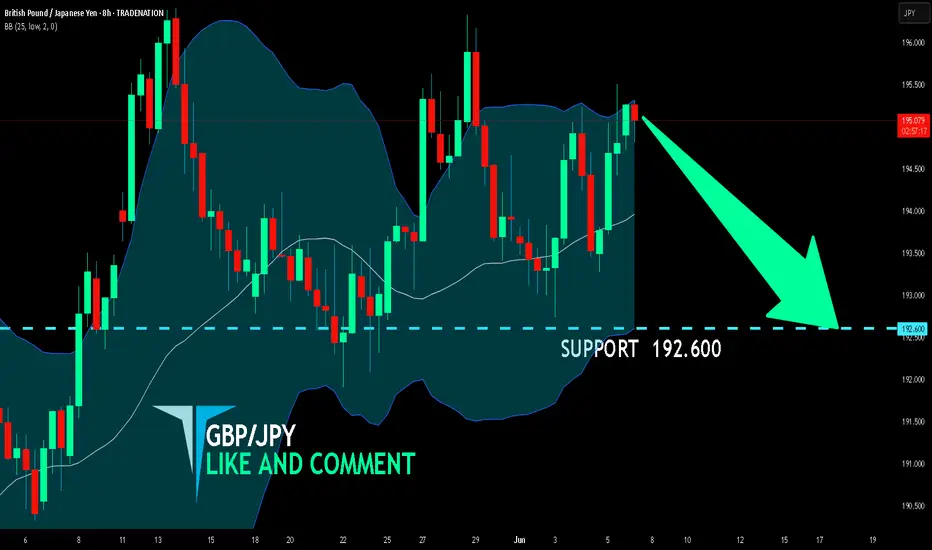
GBP/JPY BEST PLACE TO SELL FROM|SHORT
Hello, Friends!
We are going short on the GBP/JPY with the target of 192.600 level, because the pair is overbought and will soon hit the resistance line above. We deduced the overbought condition from the price being near to the upper BB band. However, we should use low risk here because the 1W TF is green and gives us a counter-signal.
Disclosure: I am part of Trade Nation's Influencer program and receive a monthly fee for using their TradingView charts in my analysis.
✅LIKE AND COMMENT MY IDEAS✅
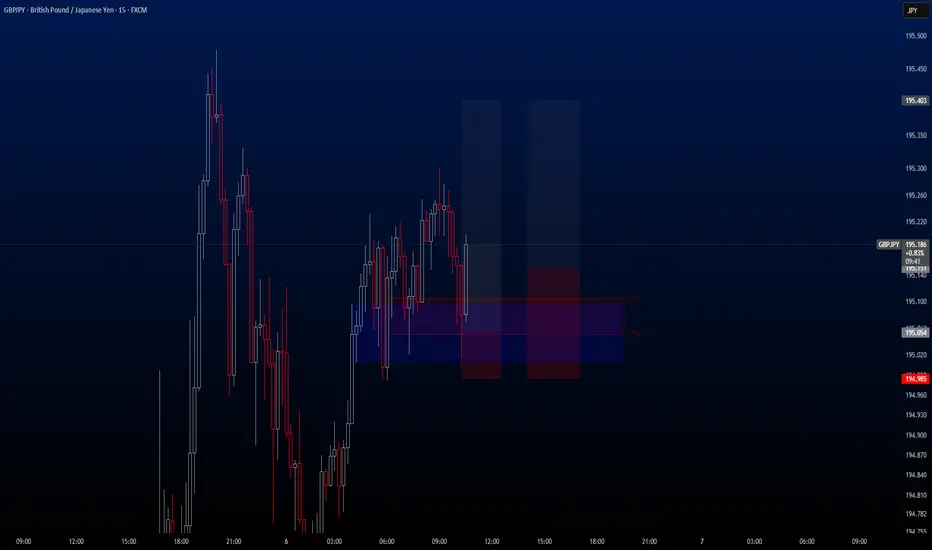
GBPJPY Hello traders,
I'd like to share the first trade of the day with you. The setup is a Buy trade on the GBPJPY pair.
Today is the last trading day of the week and we have major economic events on the calendar, including:
🔹 Average Hourly Earnings (MoM)
🔹 Non-Farm Payrolls (NFP)
🔹 Unemployment Rate
So it's wise to remain cautious while executing trades today.
🔍 Trade Details
✔️ Timeframe: 15-Minute
✔️ Risk-to-Reward Ratio: 1:1(me) /1:1.50
✔️ Trade Direction: Buy
✔️ Entry Price: 195.054
✔️ Take Profit: 195.403
✔️ Stop Loss: 194.985
🔔 Disclaimer: This is not financial advice. I’m simply sharing a trade I’ve taken based on my personal trading system, strictly for educational and illustrative purposes.
📌 Interested in a systematic, data-driven trading approach?
💡 Follow the page and turn on notifications to stay updated on future trade setups and advanced market insights.
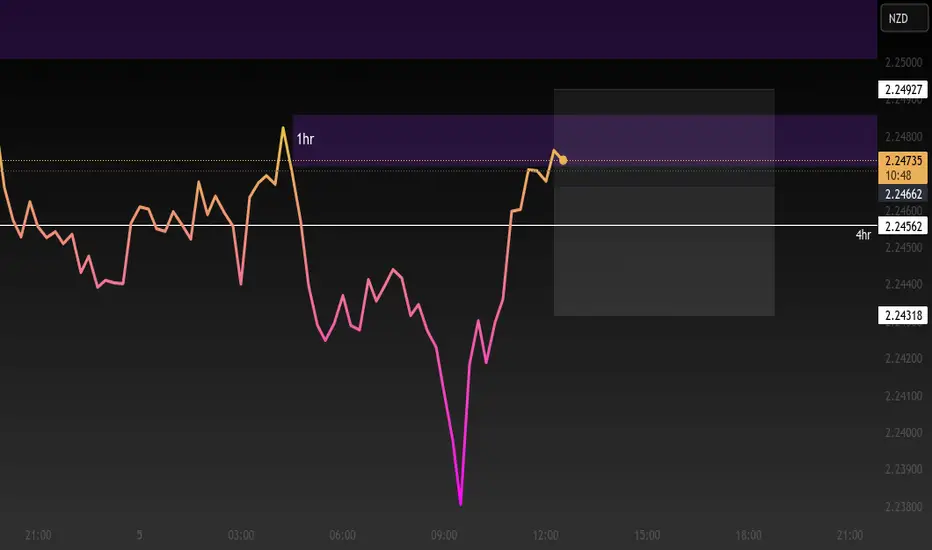
gbpnzd sellprice is in a 1hr supply at the moment and trend is bearish on 1hr 4hr tf. price is visiting the 1hr zone for the first time on 15m tf. it will form a double top if it closes fueling sell momentum. since its been in a steady uptrend it may look to retrace if it wants to go up. im looking to enter once price trade below the leg of the swing entering the 1hr zone.
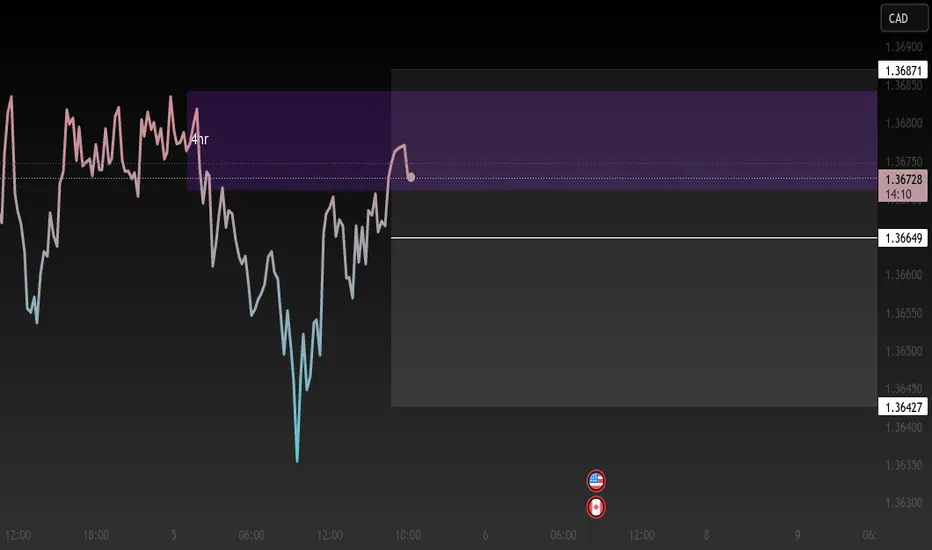
Usdcad Sellprice is bearish still on the 4hr tf and is in a 4hr supply zone. there are supplies across the lower tfs within the 4hr zone. there is a particular one on the 15m tf that is strong. looking to sell once price trades below last ll.
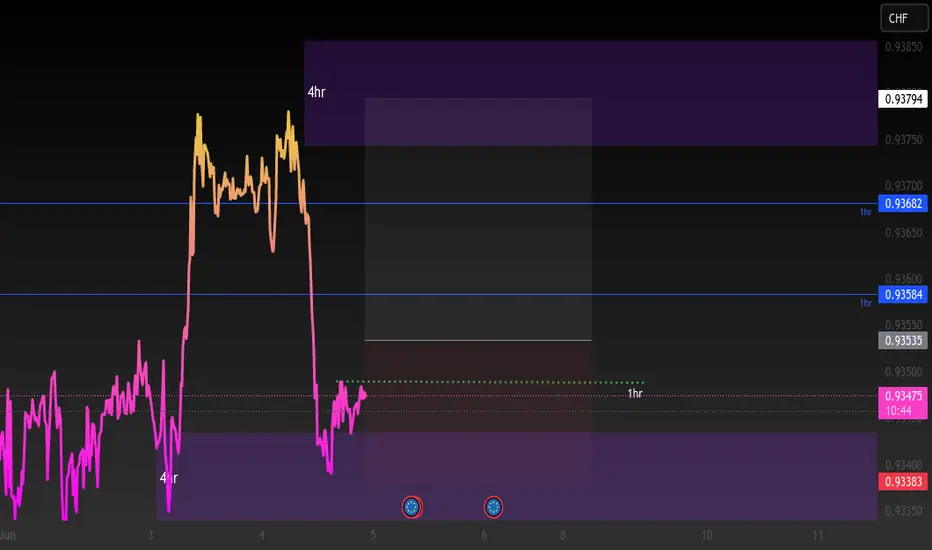
Eurchf BuyEurchf is in a bullish trend on the 4hr tf and is currently trading around a 4 hr demand that was made some days ago. once price closes above the green line which is a supply on the 1hr its should suggest buyers are still interested. if so there is a 5m supply that i need price to break which is my entry point targeting 4hr supply above
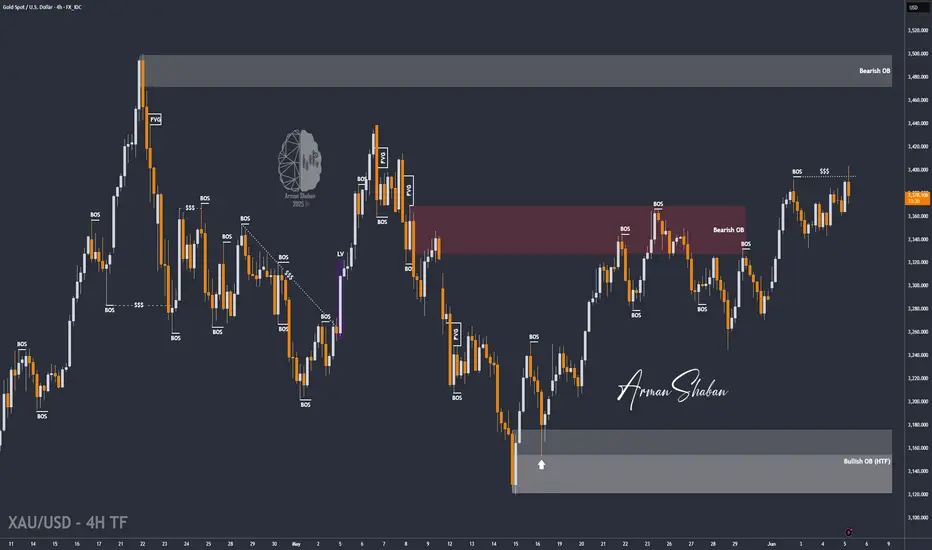
Gold Hits All Targets with 500+ Pips – Eyes Now on $3420By examining the gold chart on the 4-hour timeframe, we can see that after our previous analysis, the price moved exactly as expected and successfully hit all four targets — $3367, $3380, $3391, and $3400 — reaching as high as $3403 and delivering over 500 pips of return.
After sweeping the liquidity above $3400, the price corrected back to around $3370. Currently, gold is trading around $3380. If the price can hold above the $3370 level, we can expect a continuation of the bullish move toward the $3420 area.
Please support me with your likes and comments to motivate me to share more analysis with you and share your opinion about the possible trend of this chart with me !
Best Regards , Arman Shaban
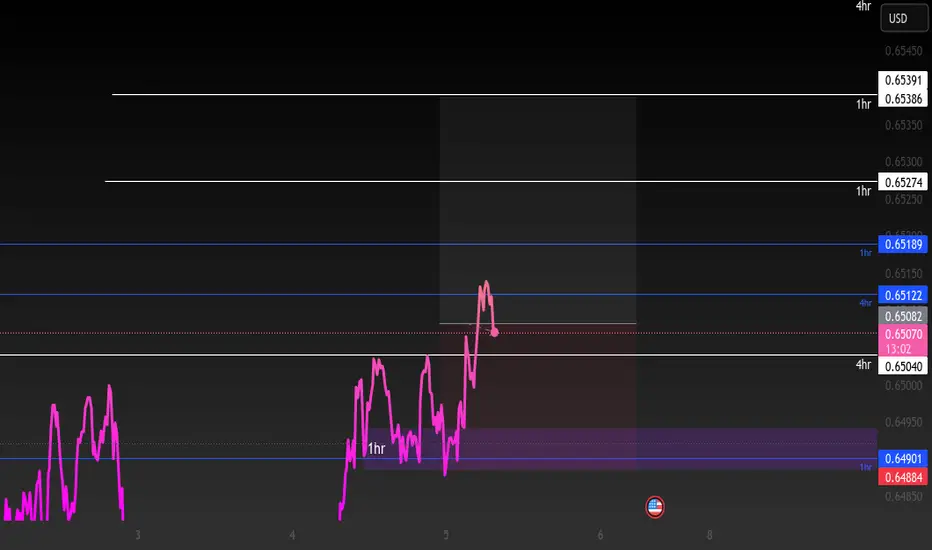
Audusd Longprice is in bullish trend on the 4hr timeframe. price was consolidating around a 1hr poi and demand zone/ it recently broke through a 4hr key level and reached a 4hr poi. im expecting a minor pullback before continuing to the upside
Trading balanceTrading balance The price of the asset has rebounded from the balance zone. With the prospect of growth into the resistance zone.

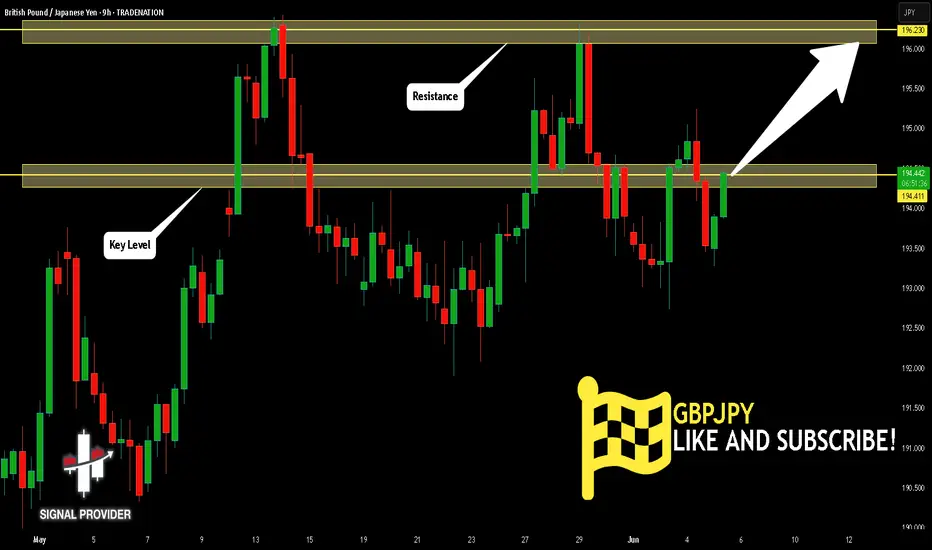
GBPJPY Will Go Up! Buy!
Take a look at our analysis for GBPJPY.
Time Frame: 9h
Current Trend: Bullish
Sentiment: Oversold (based on 7-period RSI)
Forecast: Bullish
The market is on a crucial zone of demand 194.411.
The oversold market condition in a combination with key structure gives us a relatively strong bullish signal with goal 196.230 level.
P.S
Please, note that an oversold/overbought condition can last for a long time, and therefore being oversold/overbought doesn't mean a price rally will come soon, or at all.
Disclosure: I am part of Trade Nation's Influencer program and receive a monthly fee for using their TradingView charts in my analysis.
Like and subscribe and comment my ideas if you enjoy them!
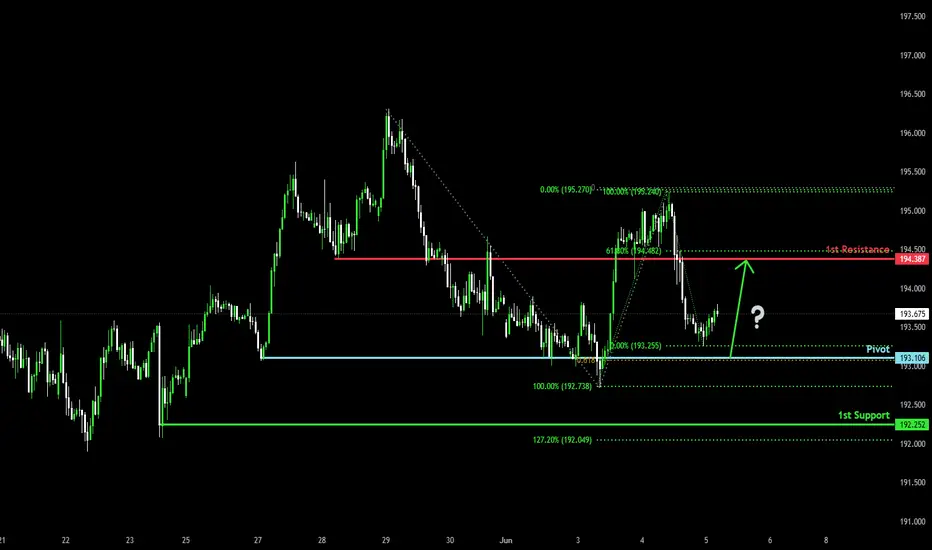
Bullish bounce?GBP/JPY is falling towards the pivot, which had been identified as a pullback support and could bounce to the 61.8% Fibonacci resistance.
Pivot: 193.10
1st Support: 192.25
1st Resistance: 194.38
Risk Warning:
Trading Forex and CFDs carries a high level of risk to your capital and you should only trade with money you can afford to lose. Trading Forex and CFDs may not be suitable for all investors, so please ensure that you fully understand the risks involved and seek independent advice if necessary.
Disclaimer:
The above opinions given constitute general market commentary, and do not constitute the opinion or advice of IC Markets or any form of personal or investment advice.
Any opinions, news, research, analyses, prices, other information, or links to third-party sites contained on this website are provided on an "as-is" basis, are intended only to be informative, is not an advice nor a recommendation, nor research, or a record of our trading prices, or an offer of, or solicitation for a transaction in any financial instrument and thus should not be treated as such. The information provided does not involve any specific investment objectives, financial situation and needs of any specific person who may receive it. Please be aware, that past performance is not a reliable indicator of future performance and/or results. Past Performance or Forward-looking scenarios based upon the reasonable beliefs of the third-party provider are not a guarantee of future performance. Actual results may differ materially from those anticipated in forward-looking or past performance statements. IC Markets makes no representation or warranty and assumes no liability as to the accuracy or completeness of the information provided, nor any loss arising from any investment based on a recommendation, forecast or any information supplied by any third-party.
GBPJPY OUTLOOKWe saw price took a shift which validated a bull structure while gathering up liquidity. Now price is currently moving sideways which shows buyers are lagging. I see sellers coming in here once support gets broken. I will be hoping in for a sell after the breakout at the nearest order block.
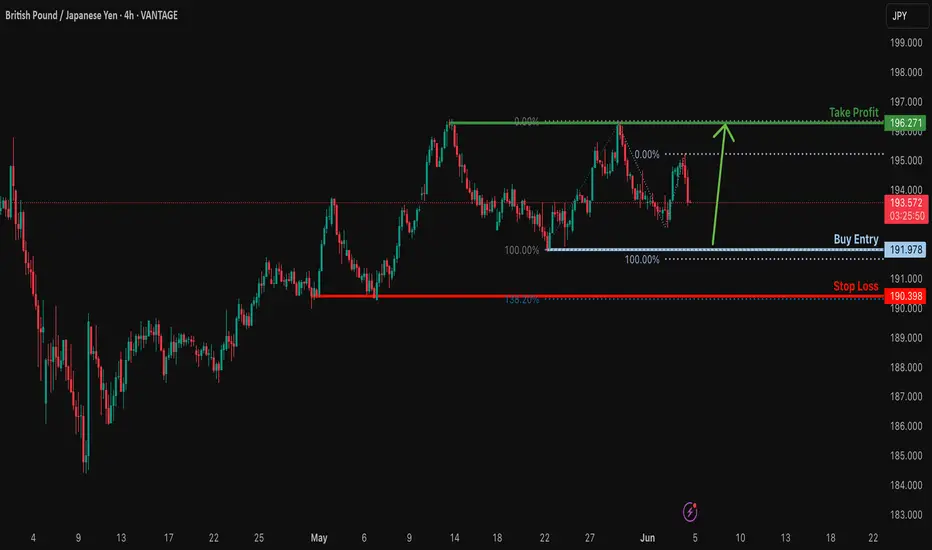
Bullish bounce?GBP/JPY is falling towards the support level which is a pullback support that is slightly above the 100% Fibonacci projection and could bounce from this level to our take profit.
Entry: 191.97
Why we like it:
There is a pullback support level that is slightly above the 100% Fibonacci projection.
Stop loss: 190.39
Why we like it:
There is a pullback support level that lines up with the 138.2% Fibonacci extension.
Take profit: 196.27
Why we like it:
There is a pullback resistance level.
Enjoying your TradingView experience? Review us!
Please be advised that the information presented on TradingView is provided to Vantage (‘Vantage Global Limited’, ‘we’) by a third-party provider (‘Everest Fortune Group’). Please be reminded that you are solely responsible for the trading decisions on your account. There is a very high degree of risk involved in trading. Any information and/or content is intended entirely for research, educational and informational purposes only and does not constitute investment or consultation advice or investment strategy. The information is not tailored to the investment needs of any specific person and therefore does not involve a consideration of any of the investment objectives, financial situation or needs of any viewer that may receive it. Kindly also note that past performance is not a reliable indicator of future results. Actual results may differ materially from those anticipated in forward-looking or past performance statements. We assume no liability as to the accuracy or completeness of any of the information and/or content provided herein and the Company cannot be held responsible for any omission, mistake nor for any loss or damage including without limitation to any loss of profit which may arise from reliance on any information supplied by Everest Fortune Group.
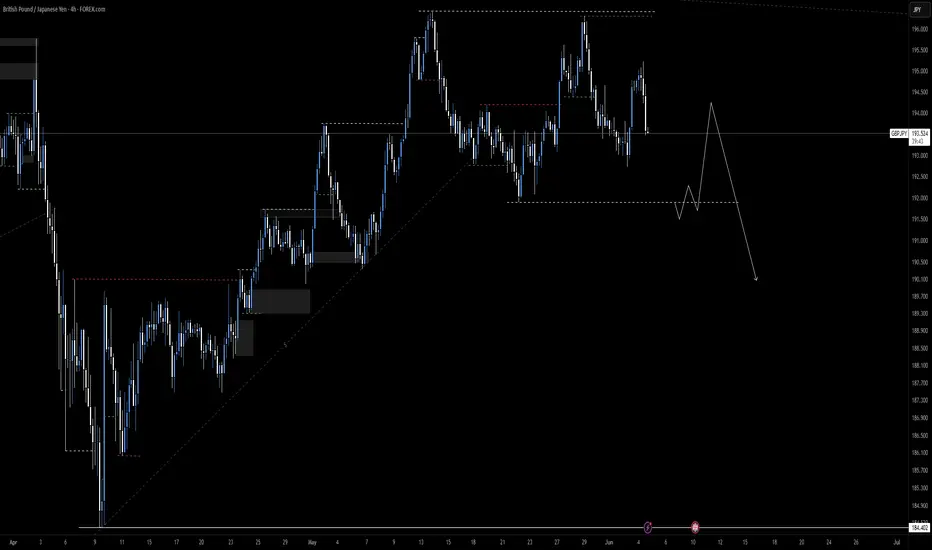
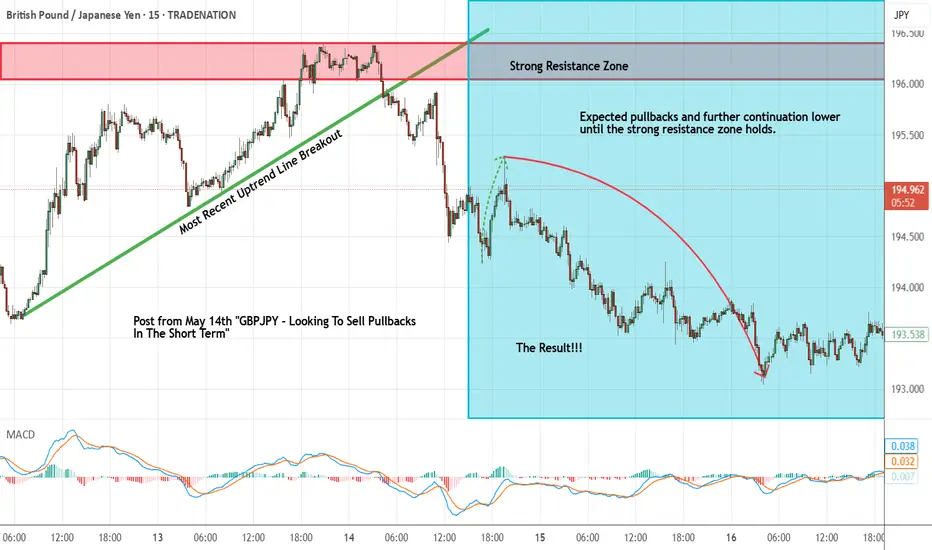
GBPJPY - Short Term Sell Trade Update!!!Hi Traders, on May 14th I shared this idea "GBPJPY - Looking To Sell Pullbacks In The Short Term"
I expected to see pullbacks and further continuation lower until the strong resistance zone holds. You can read the full post using the link above.
Pullback and push lower happened as per the plan!!!
If you enjoy this idea, don’t forget to LIKE 👍, FOLLOW ✅, SHARE 🙌, and COMMENT ✍! Drop your thoughts and charts below to keep the discussion going. Your support helps keep this content free and reach more people! 🚀
-------------------------------------------------------------------------------------------------------------------
Disclosure: I am part of Trade Nation's Influencer program and receive a monthly fee for using their TradingView charts in my analysis.
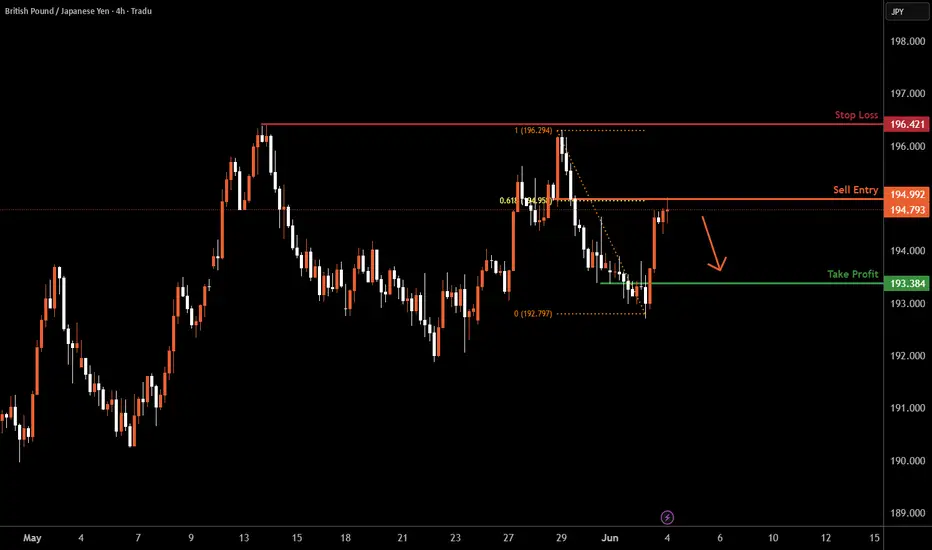
GBPJPY H4 | Bearish Fall Based on the H4 chart, the price has just reacted off our sell entry level at 194.99, a pullback resistance that aligns with the 61.8% Fib retracement.
Our take profit is set at 193.38 a pullback support.
The stop loss is set at 196.42, a swing high resistance.
High Risk Investment Warning
Trading Forex/CFDs on margin carries a high level of risk and may not be suitable for all investors. Leverage can work against you.
Stratos Markets Limited (tradu.com ):
CFDs are complex instruments and come with a high risk of losing money rapidly due to leverage. 63% of retail investor accounts lose money when trading CFDs with this provider. You should consider whether you understand how CFDs work and whether you can afford to take the high risk of losing your money.
Stratos Europe Ltd (tradu.com ):
CFDs are complex instruments and come with a high risk of losing money rapidly due to leverage. 63% of retail investor accounts lose money when trading CFDs with this provider. You should consider whether you understand how CFDs work and whether you can afford to take the high risk of losing your money.
Stratos Global LLC (tradu.com ):
Losses can exceed deposits.
Please be advised that the information presented on TradingView is provided to Tradu (‘Company’, ‘we’) by a third-party provider (‘TFA Global Pte Ltd’). Please be reminded that you are solely responsible for the trading decisions on your account. There is a very high degree of risk involved in trading. Any information and/or content is intended entirely for research, educational and informational purposes only and does not constitute investment or consultation advice or investment strategy. The information is not tailored to the investment needs of any specific person and therefore does not involve a consideration of any of the investment objectives, financial situation or needs of any viewer that may receive it. Kindly also note that past performance is not a reliable indicator of future results. Actual results may differ materially from those anticipated in forward-looking or past performance statements. We assume no liability as to the accuracy or completeness of any of the information and/or content provided herein and the Company cannot be held responsible for any omission, mistake nor for any loss or damage including without limitation to any loss of profit which may arise from reliance on any information supplied by TFA Global Pte Ltd.
The speaker(s) is neither an employee, agent nor representative of Tradu and is therefore acting independently. The opinions given are their own, constitute general market commentary, and do not constitute the opinion or advice of Tradu or any form of personal or investment advice. Tradu neither endorses nor guarantees offerings of third-party speakers, nor is Tradu responsible for the content, veracity or opinions of third-party speakers, presenters or participants.