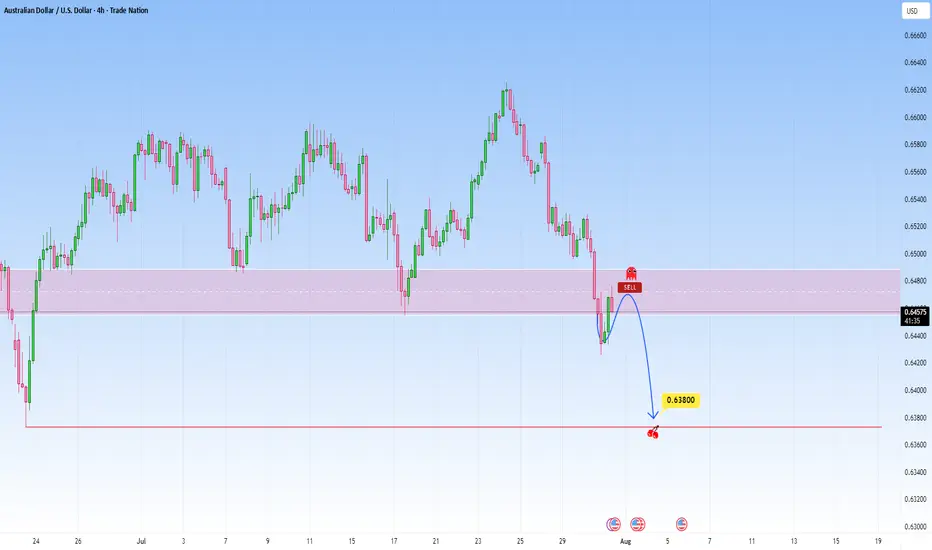
AUDUSD: Bearish Continuation from broken supportThe current setup is a clean example of a trend continuation play. Price recently broke decisively below a structure zone, this break and retest now flips the narrative, what once was a buy zone is now an opportunity for short entries.
Following the aggressive move down, price now began pulling back into that broken zone. The move appears corrective rather than impulsive, characterized by a slower, more rounded structure typical of pullback leg. This is classic behavior in continuation setups: fast drop, slow retrace, and then potential for the next leg lower.
The projected move targets a retest of the swing low at 0.63800. That level is significant, it's a level where prior demand reacted strongly and now it serves as the next probable magnet for price.
What makes this continuation trade high probability is the sharpness of the prior bearish impulse as it signals intent. The market seems to be in a controlled bearish sequence, where sellers dominate momentum and retracements offer fresh entries for trend followers.
The structure and zone alignment all point in the same direction continuation lower, not reversal.
Let me know in the comments what you think
Disclosure: I am part of Trade Nation's Influencer program and receive a monthly fee for using their TradingView charts in my analysis.
Daily Charts
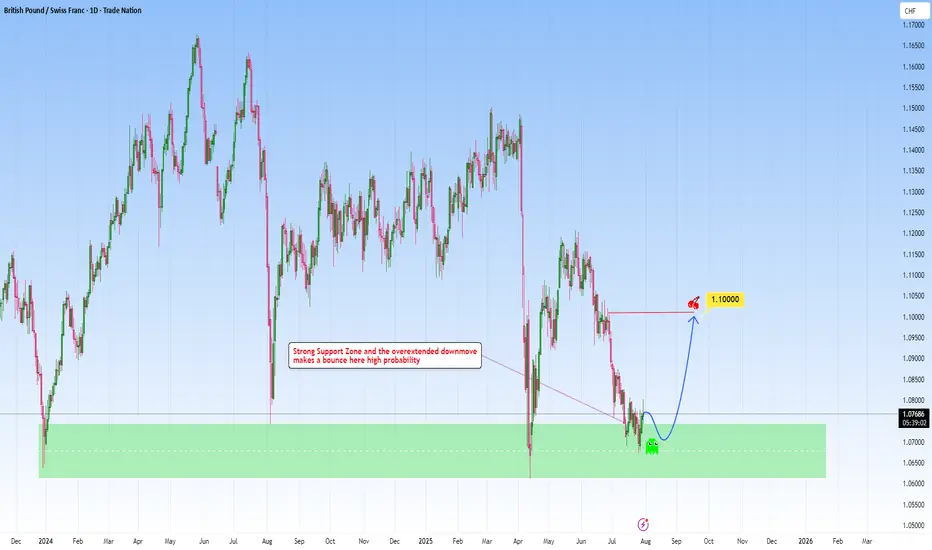
GBPCHF meets strong support: A reversal here is high probabilityLooking at GBPCHF and how it fits within my approach to structure-based trading, this one is really speaking my language.
Price has come down into a key higher-timeframe support zone: a zone that’s proven itself multiple times in the past. Now, price has shown some initial rejection there, making my long position towards 1.1000 a clear, rational target.
What makes this setup different could be the patience behind it. As we let the market complete its downward leg, waited for price to revisit a reliable zone, and now anticipating a bounce back. It’s a move that I’ve captured across my previous charts again and again.
Let me know in the comments what you think
Disclosure: I am part of Trade Nation's Influencer program and receive a monthly fee for using their TradingView charts in my analysis.
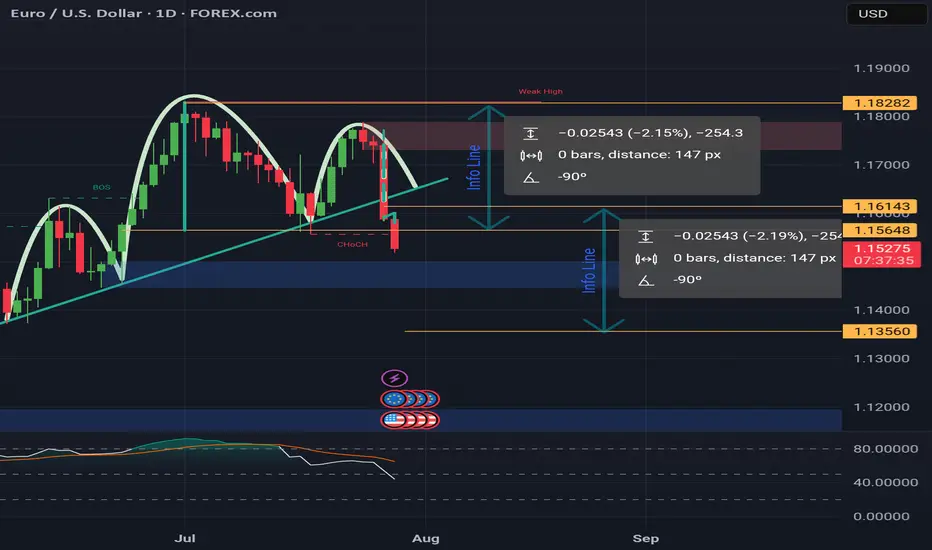
Head & Shoulders on EUR/USD daily!We're currently observing a significant Head & Shoulders pattern forming on the EUR/USD daily chart, with the price just breaking below the neckline on the right shoulder.
Applying standard Head & Shoulders trading principles, we measure the distance from the head's peak to the neckline and project that same range downward from the breakdown point. Based on this, the estimated target price (TP) for the trade lands around $1.135. The stop-loss will be positioned just above the right shoulder to manage risk effectively.
We'll be watching closely to see how this setup unfolds. 🍻
Keep following to the H&S PatternMorning folks,
To be honest, not too many things to talk about. We've prepared our scenario with H&S is still valid. Reaction to GDP numbers was quite welcome as it set the right arm's bottom. The only thing that we have to be busy with is to control its validity - reaching of the neckline and price standing above 116 lows and right arm.
At the first signs that market is start falling back - do not take any new longs. H&S failure is also the pattern and in this case we get deeper correction. But daily chart still makes me think that bullish context is here
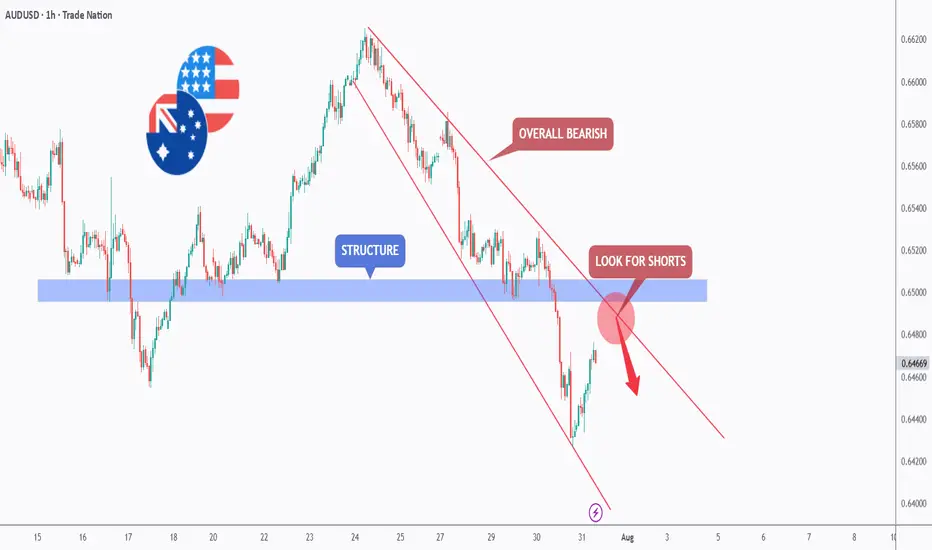
Sell the Rip? AUDUSD Retest Zone AlertHello TradingView Family / Fellow Traders. This is Richard, also known as theSignalyst.
📈AUDUSD has been overall bearish , trading within the falling red channel and it is currently retesting the upper bound of the channel.
Moreover, it is rejecting a structure marked in blue.
📚 As per my trading style:
As #AUDUSD approaches the red circle zone, I will be looking for trend-following sell setups on lower timeframes. (like a double top pattern, trendline break , and so on...)
📚 Always follow your trading plan regarding entry, risk management, and trade management.
Good luck!
All Strategies Are Good; If Managed Properly!
~Rich
Disclosure: I am part of Trade Nation's Influencer program and receive a monthly fee for using their TradingView charts in my analysis.
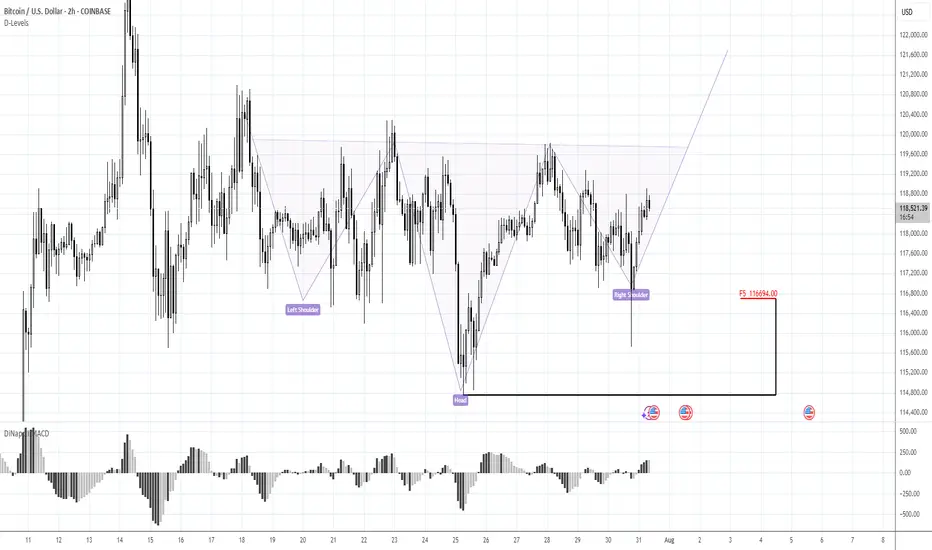
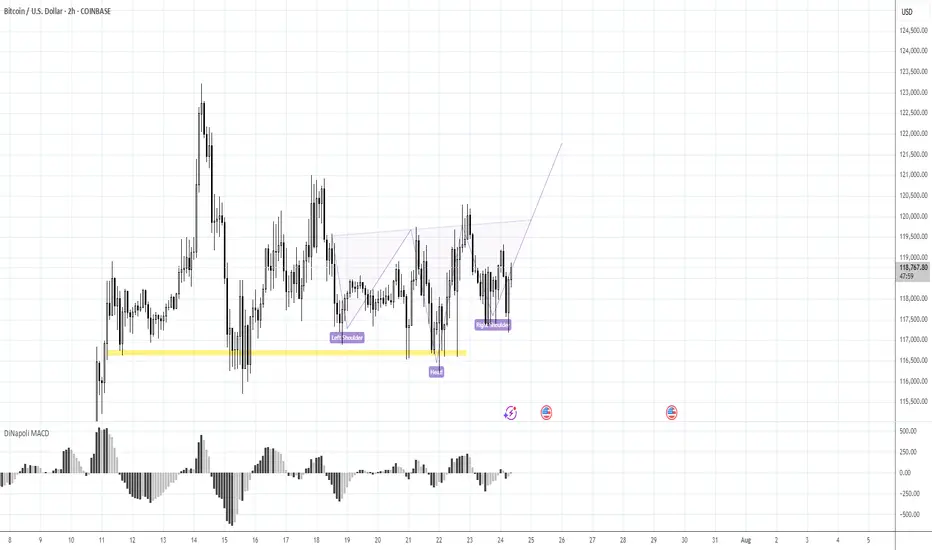
BTC 116.70K stands in focusMorning folks,
Once we've prepared the analysis, we've got upsetting squeeze down, thanks to Galaxy massive sell-off. I don't know what they were trying to do - either hunted for stops under 116K, or just sold in most unwelcome moment... but unfortunately such an issues are out of our control.
For now - BTC totally reversed this sell-off and once again shows positive sentiment. Now we consider same reverse H&S pattern, but this time of a bigger scale. 116.70K support area, where, the right arm should be formed now stands in our focus for long entry. We consider no shorts by far. Hopefully no more tricks will follow from old Donny or somebody else...
Confirming the breakout of this invh&s on doge can = 50% gainsAlready went above the neckline once and the current daily candle is currently back above the neckline for a second time. Hitting the full target would mean a good 50% gain from current price. *not financial advice*
CADJPY - The Bulls Are Stronger than Ever!Hello TradingView Family / Fellow Traders. This is Richard, also known as theSignalyst.
📈CADJPY has been overall bullish trading within the rising wedge pattern marked in red.
This week, CADJPY has been retesting the lower bound of the wedge.
Moreover, the green zone is a strong weekly support.
🏹 Thus, the highlighted blue circle is a strong area to look for buy setups as it is the intersection of the lower red trendline and green support.
📚 As per my trading style:
As #CADJPY approaches the blue circle zone, I will be looking for trend-following bullish reversal setups (like a double bottom pattern, trendline break , and so on...)
📚 Always follow your trading plan regarding entry, risk management, and trade management.
Good luck!
All Strategies Are Good; If Managed Properly!
~Rich
Disclosure: I am part of Trade Nation's Influencer program and receive a monthly fee for using their TradingView charts in my analysis.

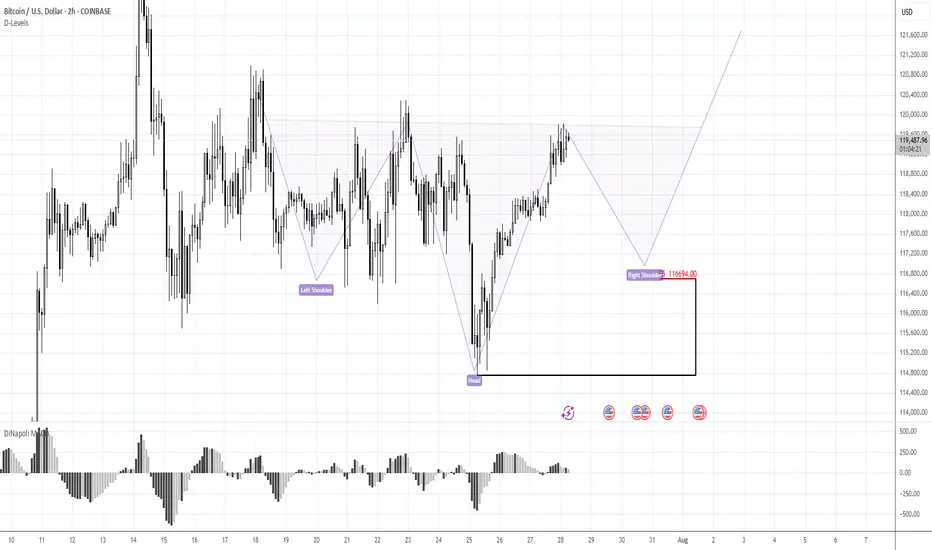
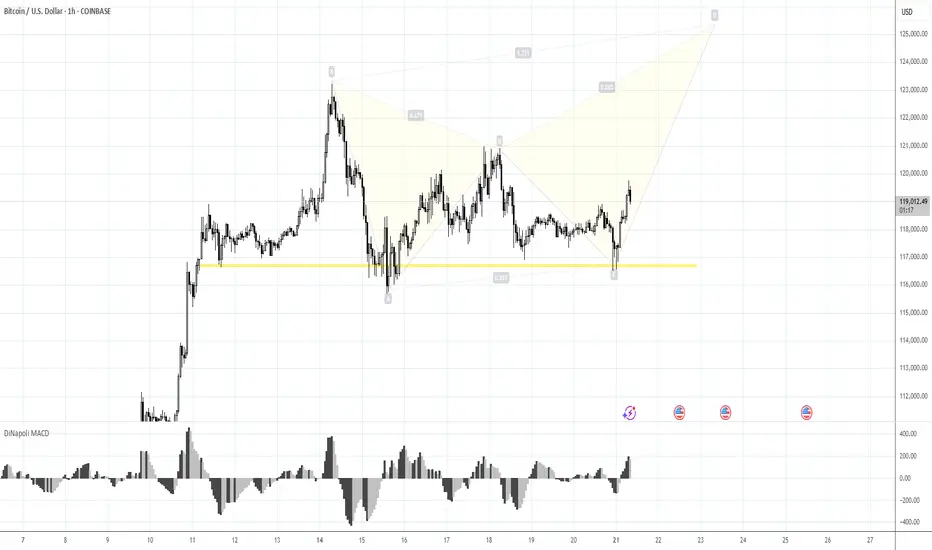
BTC Ready to Start to 125KMorning folks,
Better if you combine this update with previous idea. Now it seems that BTC stands in swamp action, flirting around 116K, which might be looking a bit bearish.
But by our view, this is not quite so. First is, triangle patterns as on daily chart as on 4H chart are look great and quite bullish. Pay attention that on 4H chart all sell-offs were bought out.
Our 1.16 lows that we set as vital ones for this scenario area still intact. So, it means that butterfly with 125K target that we discussed last time is also intact. I would say more. If you take a careful look at 1H chart - you could recognize reverse H&S pattern that could trigger all this stuff. It means that we're not in swamp, but at the point where the decision on long entry has to be made...
Take care
S.
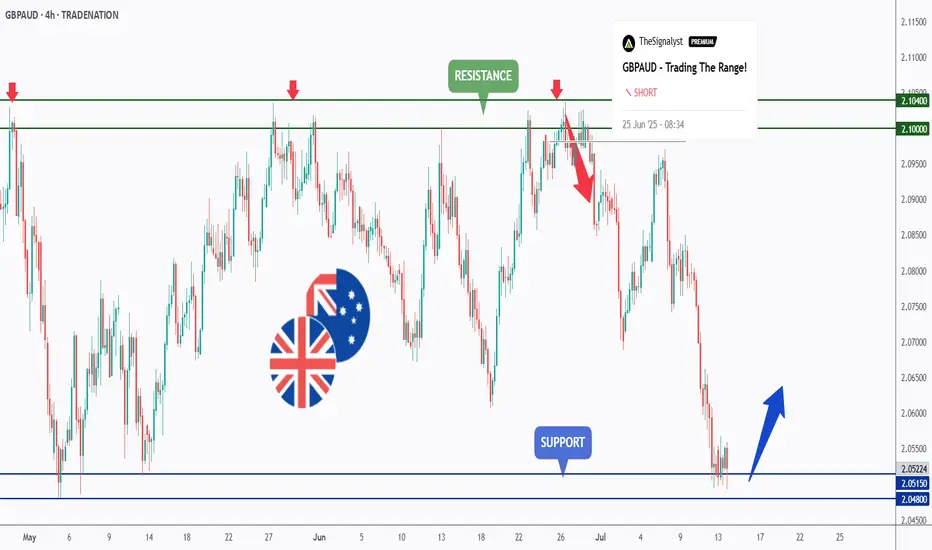
GBPAUD - Trading The Range - AGAIN!Hello TradingView Family / Fellow Traders. This is Richard, also known as theSignalyst.
📈GBPAUD has been hovering within a big range.
Last week, as per our previous analysis, GBPAUD rejected the upper bound of the range and traded lower.
This week, GA is retesting the lower bound of the range acting as a support.
As long as the support holds, we will be looking for longs on lower timeframes, targeting the upper bound of the range.
📚 Always follow your trading plan regarding entry, risk management, and trade management.
Good luck!
All Strategies Are Good; If Managed Properly!
~Rich
Disclosure: I am part of Trade Nation's Influencer program and receive a monthly fee for using their TradingView charts in my analysis.
Chainlink climbing the measured move line staircaseLooks like Chanlink is ready to confirm the double bottom breakout here as the past few candles have already started to climb up the measured move line like a staircase.Always possible for a dip back below the neckline at this point but probability slightly favors the readout being validated instead for now. *not financial advice*

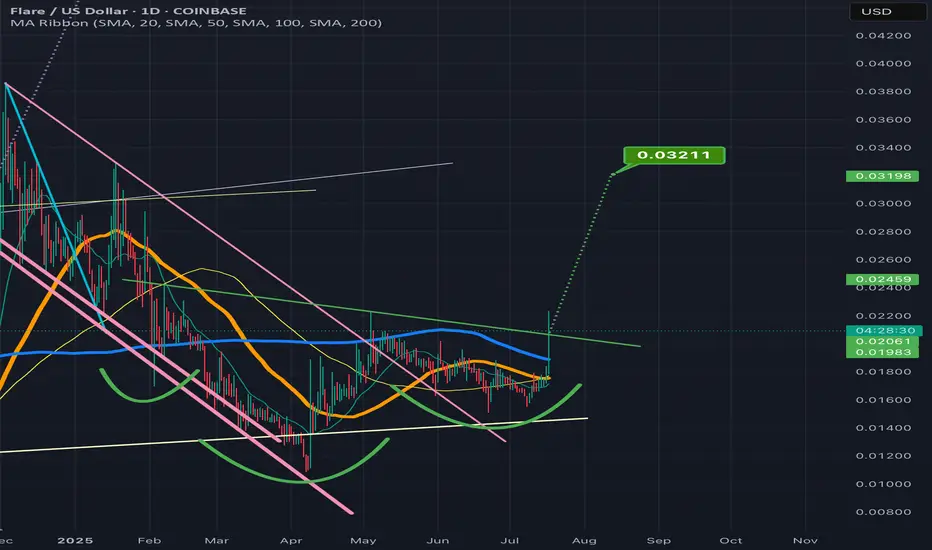
FLRUS breaking above the invh&s necklineNice it confirms the breakout the target is around 3 cents. Could always dip back below the neckline a time or two before that happens, but considering how it feels lke we are finally confirming an altseason here with bitcoin dominance taking a big dump probability highly favors an eventually validation of this breakout on flr. *not financial advice*
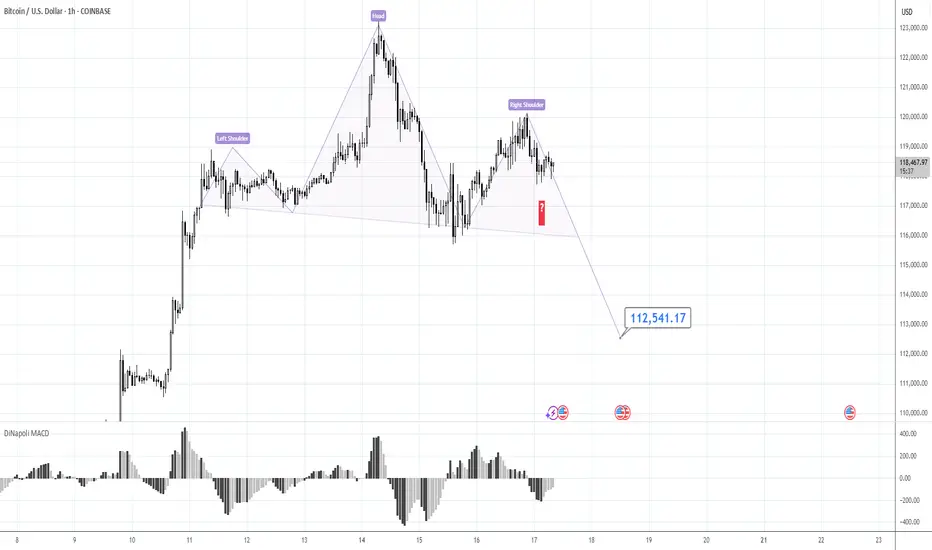
Risk 116. Target 123-125KMorning folks,
Prior 1H H&S was done, we were watching on 120K resistance area, as we said last time. Now, on 1H chart H&S is showing signs of failure - too extended right arm, no downside breakout. Price is taking the shape of triangle . All these signs are bullish. Because butterflies very often appear on a ruins of H&S, we suggest that this one could be formed here...
The risk level for this scenario is 116K lows - BTC has to stay above it to keep butterfly (and triangle) valid, otherwise, deeper retracement to 112K area could start.
Upside target starts from 123K top and up to 125K butterfly target.
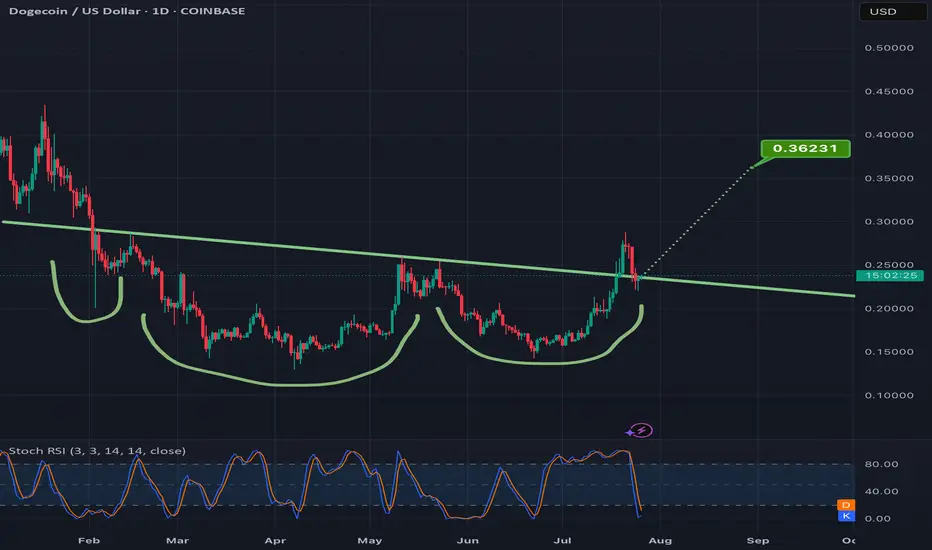
Doge inching above the double bottom necklineIt could easily dip back below the neckline a tie or two before it validates the breakout but definitely getting closer to doing so. Target is around 40-41cents. *not financial advice*

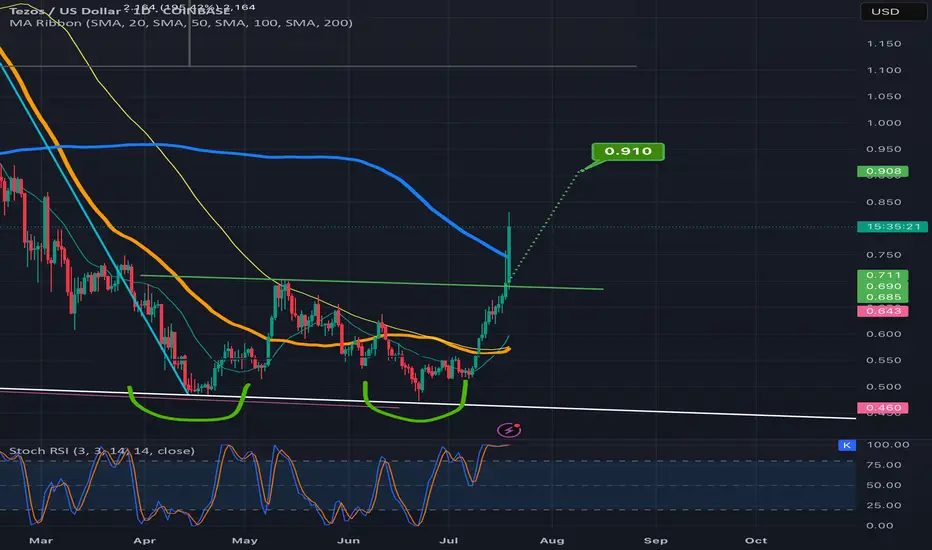
Tezos heading for a double bottom breakout targetPrice action is well above the neckline and already over halfway to the target. *not financial advice*
120K is the Key.Morning folks,
Our last plan worked perfect - market re-tested 117K support and jumped out. If you have longs - you could keep it.
We consider now two alternative scenarios, although we think that this one with triangle is more probable, we do not exclude the H&S shape on 1H chart that could lead BTC down to 112-113K support area.
So, if you do not know how to deal with this - keep an eye on the 120K area and top of the right arm. Upside breakout will confirm H&S failure and triangle scenario. Otherwise, until market stands under 120K - consider H&S as a basic scenario, just for safety.
Take care, S.
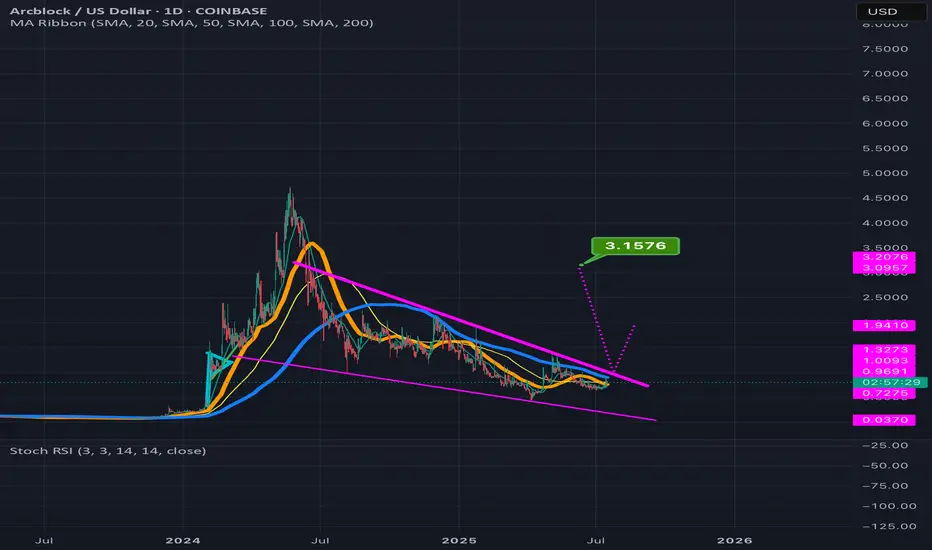
ABT can potentially 4x in value reading up from the wedge its inThe smaller pink dotted measured move line is for the inv h&s pattern its formed inside the wedge with the top trendline of the wedge doubling as the invh&s pattern’s neckline. Hitting that smaller target is more or less a 2x from current price action. If we hit the full falling wedge target that’s a 4x from where it is currently. *not financial advice*
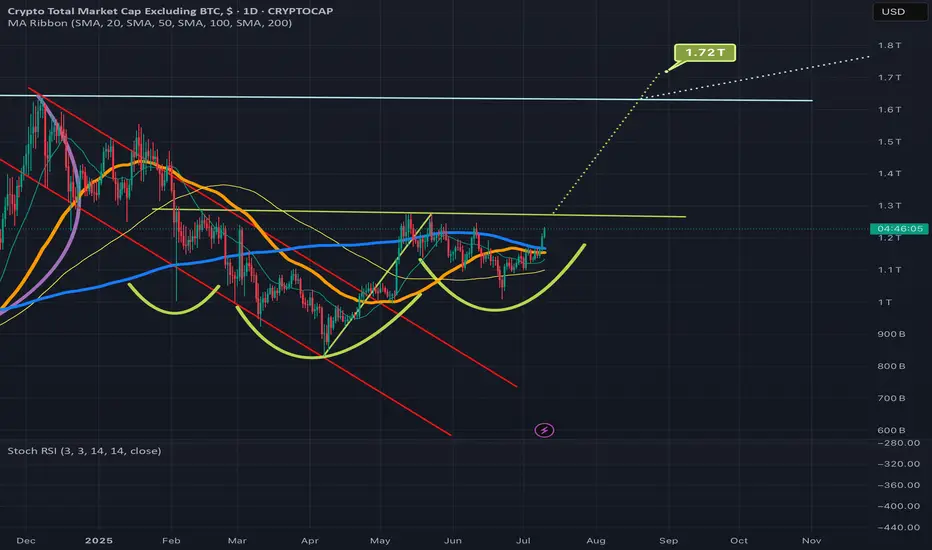
The daily chart for total2 to look at the impending golden crossWanted to also post a daily chart tie frame of my previous idea. I first posted it in weekly to fit the entire cup and handle breakout target in the frame, but wanted to also post the daily time frame to provide both a close up of the inverse head and shoulders pattern as well as the impending golden cross on the daily time frame. Loos very likely that alt season may finally be approaching here. Gonna pay close attention to both this chart and the bitcoin dominance chart btc.d to know for sure. *not financial advice*
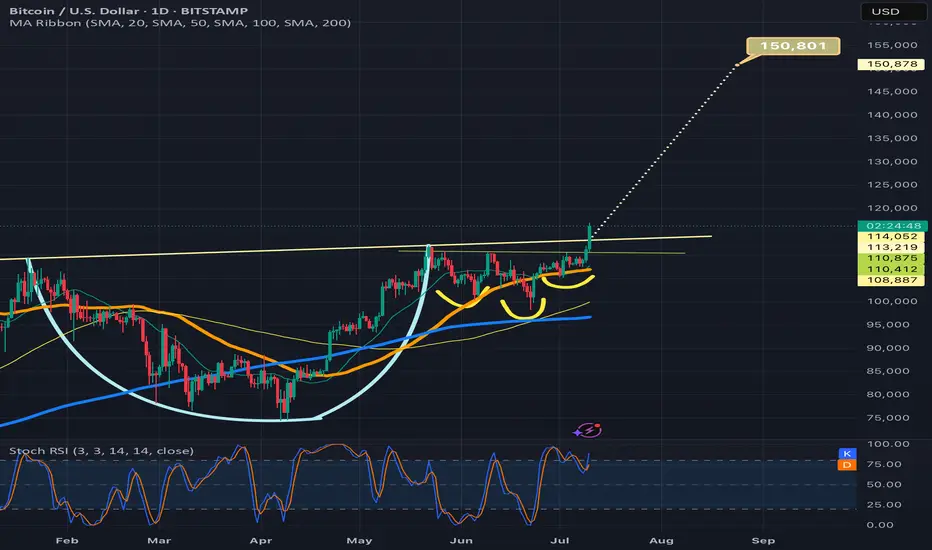
Btcusd breaking above cup and handle necklineIf it confirms the bullish breakout the target is 150k. Also by breaking above 116k and solidifying that level as strong support, we will trigger an even bigger inverse head and shoulders pattern (not shown here) with a breakout target around 208k! I will provide a link below to the chart I posted of that pattern. Thanks for reading, liking, and following. *not financial advice*
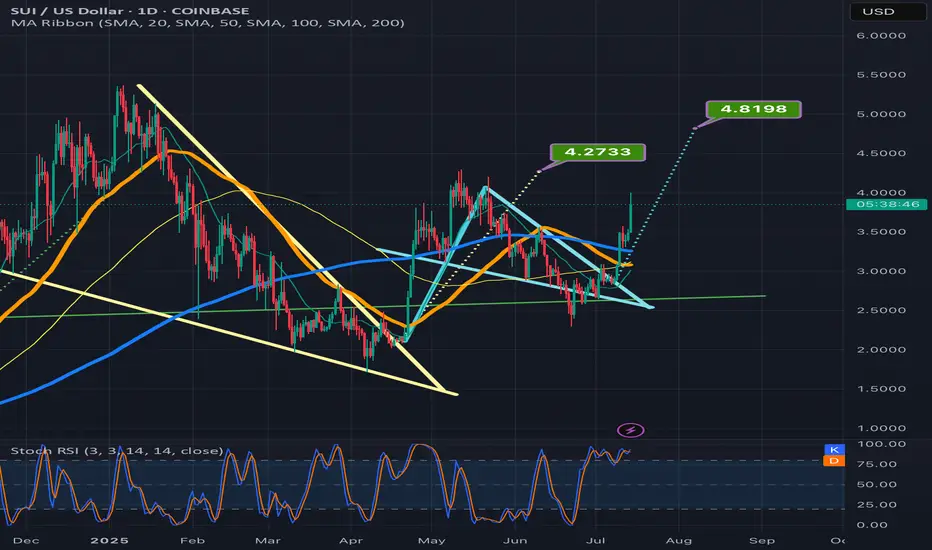
SUI on its way to the teal pennants breakout targetSui has joined the bullishness here as it has brown up from the pennant and well on its way to the target. *not financial advice*
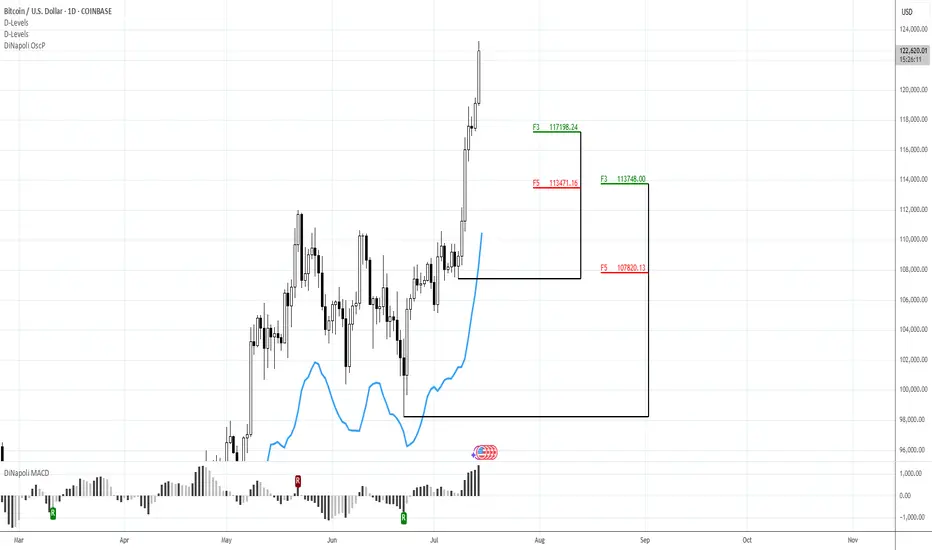
127KMorning folks,
So, BTC shows even better performance that we thought, although it obviously something stands behind, this is not market-natural motion. Anyway, we consider 127K level as all-time nearest target that stands on monthly chart.
If any pullback starts (BTC now is at daily overbought and near Yearly Resistance Pivot), we keep an eye on 117.2K and 113.5K levels to decide on long entry
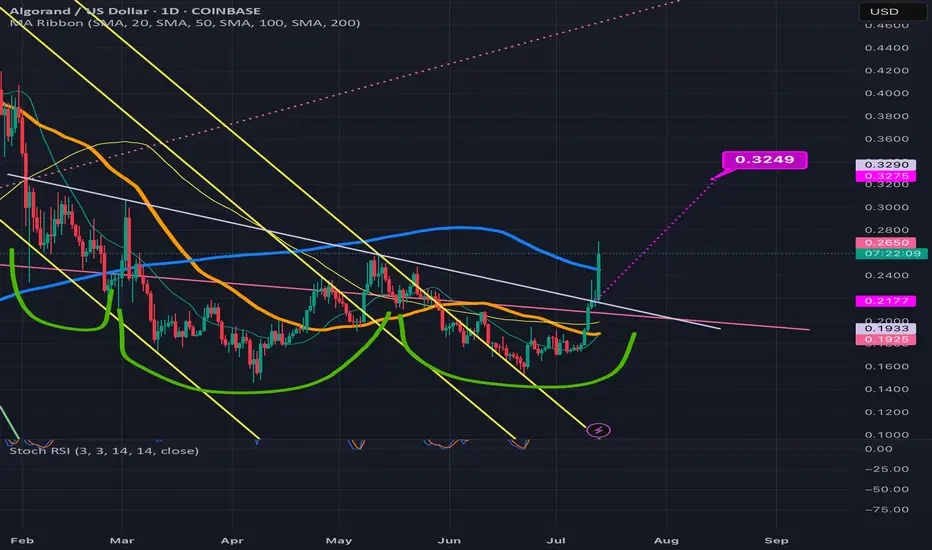
Algorand breaking up from inverse head and shouldersSeems like most of the cryptos from the iso20022 compliant chains are breaking out right now and algorand is no exception. Most likely in anticipation of Fednow’s migration to it tomorrow. *not financial advice*
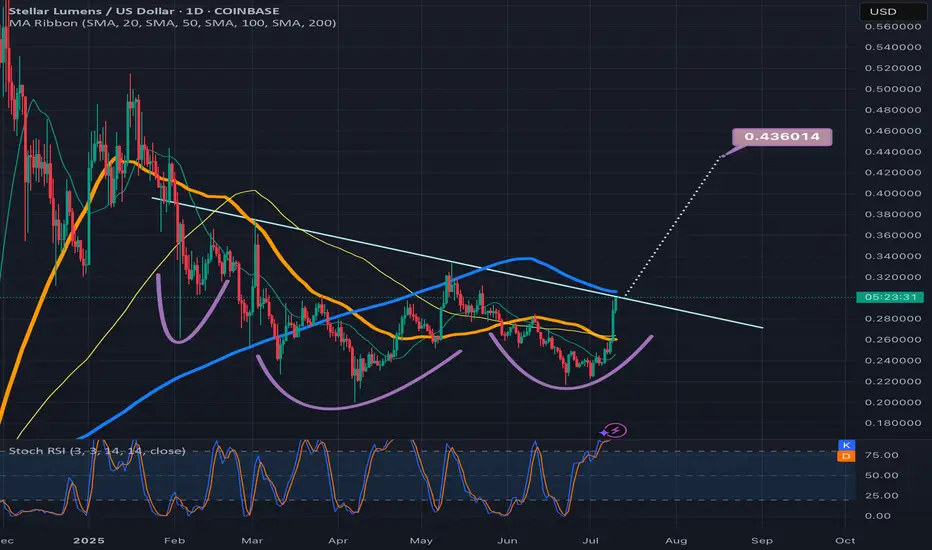
XLMUSD inv h&s at the threshold of the necklineNo confirmation yet but market currently feeling very bullish here. Likely to breach this neckline in the next few candles. *not financial advice*