BTCUSDT 1D | Bitcoin market overview: Bulls are comingHello, dear subscribers!
In the previous review, we posted that the price of bitcoin entered the correction zone $11,300 - $11,900.
Currently, the price of bitcoin is $11,790. The bulls are pushing the price to the upper limit of the range and trying to develop an attack at the level of $11,900. Closing a daily candle above $11,730 will be a good bullish signal about the continuation of growth. On the 4 hour chart, we are in a local upward movement.
The close price of the day is also relevant for bears, as $11,200 and $10,500 targets remain below.
Subscribe to the channel and stay with us!
Dailychart
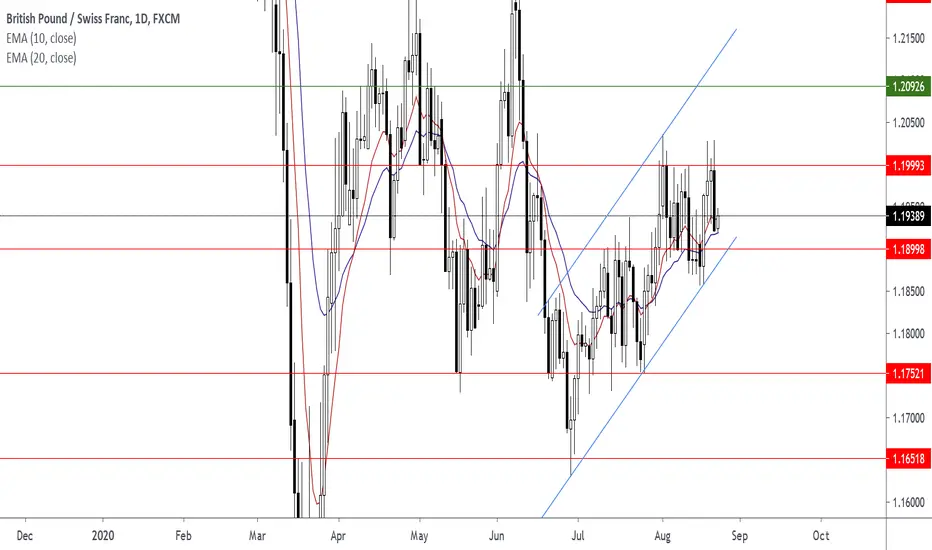
GBPCHF Entry 1.18998 Exit 1.17521 Parallel ChannelGBPCHF Entry 1.18998 Exit 1.17521 // Parallel Channel
NZDCAD Trade Idea Entry at 0.86118 and Exit at 0.84983.NZDCAD Trade Idea is to wait for a break and retest of level 0.86118 for a sell opportunity.
Entry at 0.86118 and exit at 0.84983.

NZDCHF Watch for BUY Hi traders,
Keep your eyes for buy setups and keep adding your buy setups on the corrections.
There is a nice daily wave to the upside don't miss it


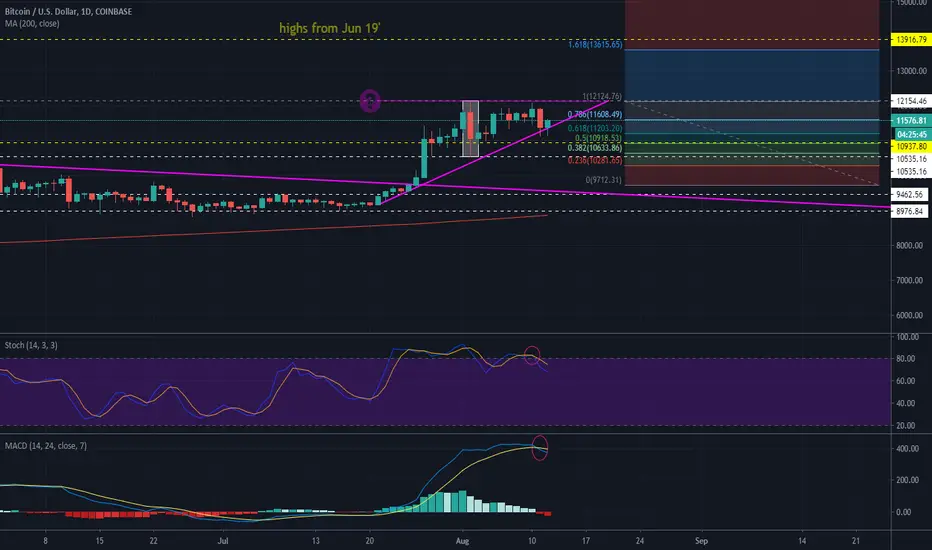
Update for last short BTC lvlsI sketched a poor trendline for positive scenario,If it is respected - and next 2-3 daily candles will close above, Stoch and MACD turn back. We are propably right way to next price targed more than ~12,150$. But i would like to see some consolidation between current price channel, predicted with higher lows, to take a rest, and form greater triangle (to break it to 14,000$. Stay in mind that we propably catched support on BTC dominance at ~62% (with price at daily chart 61,60-62,60) but.. check out fear and grid index on 75 points. Higher levels was seen last holiday then we dropped 24% in the day- if this situation would be similiar, we would be close to 200 MA. Meanwhile
I also have in mind, that belief in money is weak, and a lot of new money from air going into the markets. I would like to see more confirmation to go up.
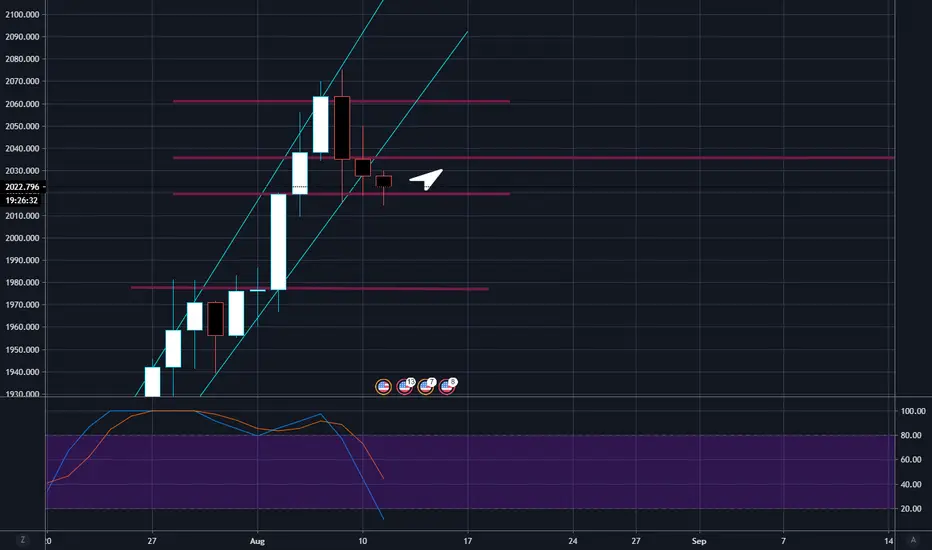
Current New XAUUSD Trendit is now oversold on the daily chart as well. I suspect a bounce off this support due to the RSI and current price action and a channel forming before taking on a newer high or newer low.
Also, lots of the news surrounding Gold has been both positive and negative, leading me to predict with an edge that there is a new neutral channel in play.
TRADING BITCOIN WITH THE PARABOLIC SAR!!!Hey Traders, decided to make an informative post trading with the Parabolic Stop And Reverse Indicator. I will be only referring to bullish instances for the Parabolic SAR. For this example, I will be using the Daily Time-frame on BTC/USD. First & foremost, I use Parabolics to indicate the direction of the pair i'm trading. It also helps in finding great entry and exit points. On my chart I have my Parabolic Indicator colored Black. I have 3 Bullish Parabolic areas indicated as well as Daily Support & Resistance.
I want you to notice how each time price closes over the Parabolic upwards, it brings more bullish action. There are 3 occurrences indicated on my chart in circles. It will always only be 2 scenarios for me everytime this happen.
Scenario 1: Price continues the bullish movement reaching new highs.
Scenario 2: Price neglects close over Parabolic & decides to pullback. Almost certainly, price will retrace back to the closed over zone of the Parabolic.
I am new to TradingView, but definitely not Trading. I hope this helps your trading journey.
Leave Comments Below! They Are Welcomed & Appreciated!!

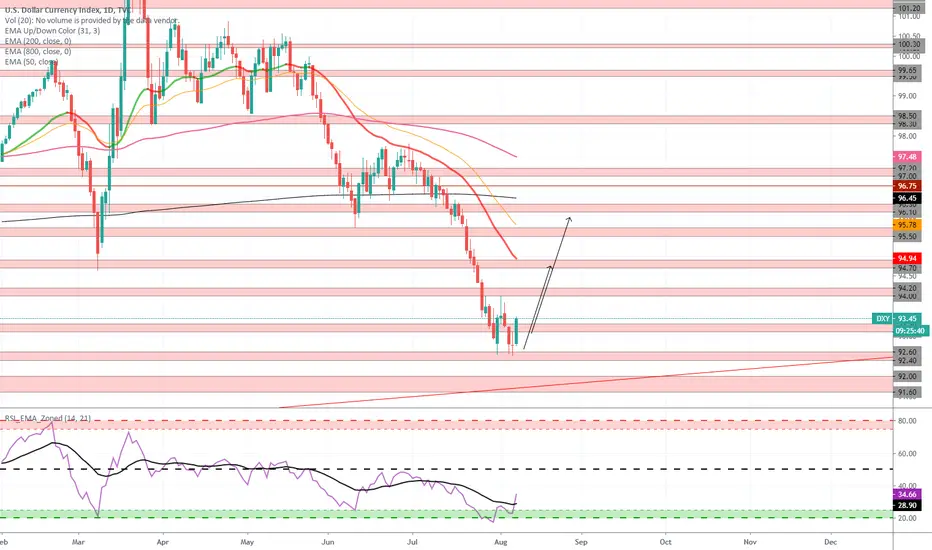
DXY : Ready to go upDXY has taken support at 92.40-92.460 zone. Seems like can get a move till 96-97.
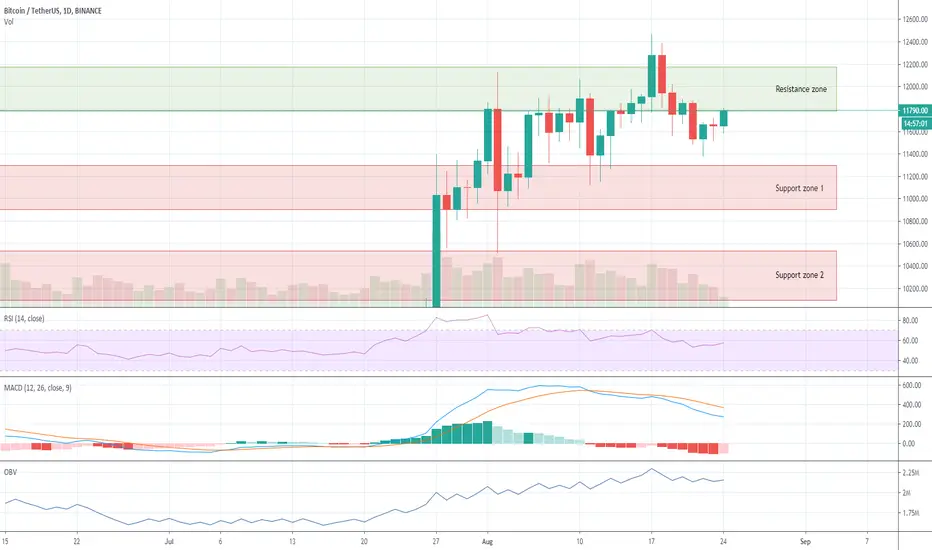
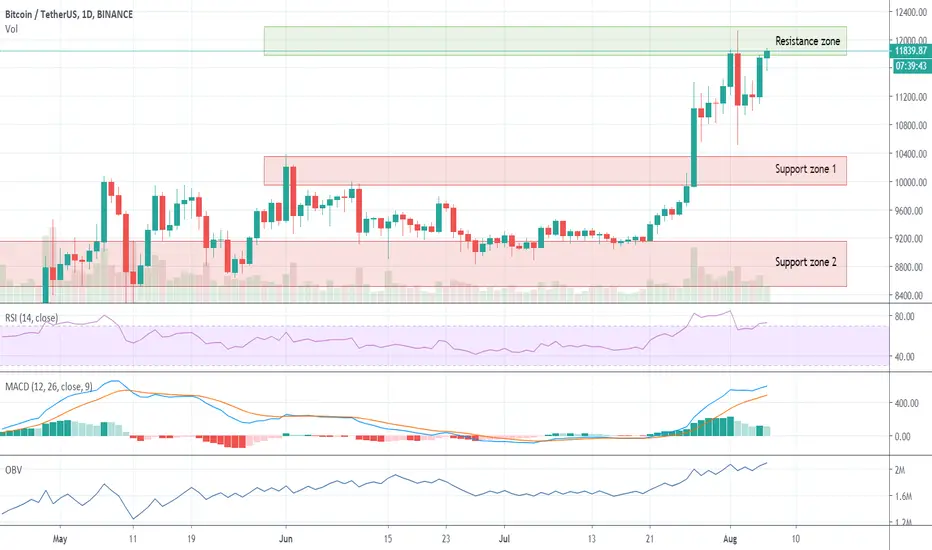
BTCUSDT 1D | Bitcoin market overview: Attack on resistanceHello, dear subscribers!
In the previous report we have looked at the current up trend, we have marked the current support and resistance areas.
The current bitcoin price is $11,860. At the moment the buyers are attacking the resistance zone $11,800 - $12,000. If the resistance zone is successfully overcome, the next bull's target will be the zone $12,300 - $12,500. In this review we consider the daily chart, fixing the price above the current resistance zone will be relevant at the close of the day. This approach will allow to filter out false shots of the price up or down.
Subscribe to the channel and stay with us!
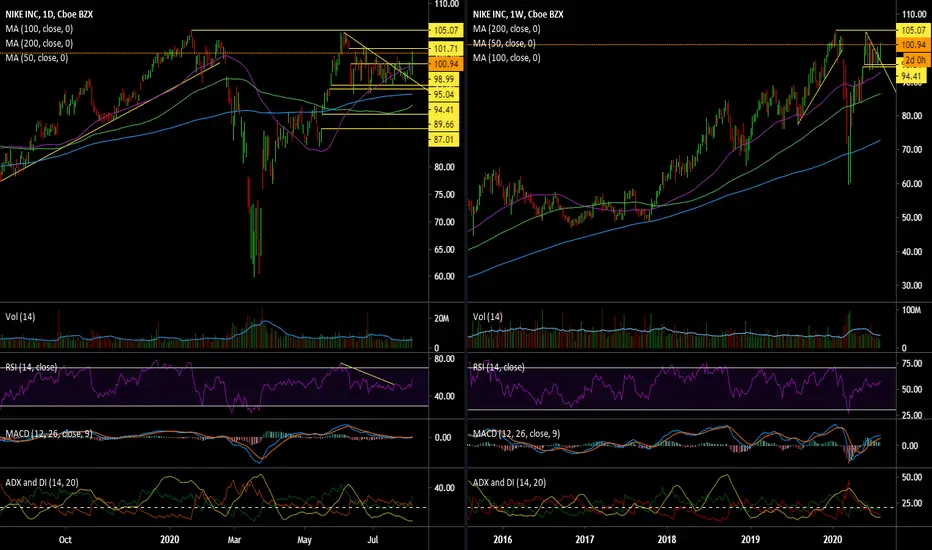
Nike - NKENike – NKE
• The stock just left the descending triangle
• Now it will be important to close the gap from mid-June
• If the gap is closed, a further upside to the all-time high and above can be expected