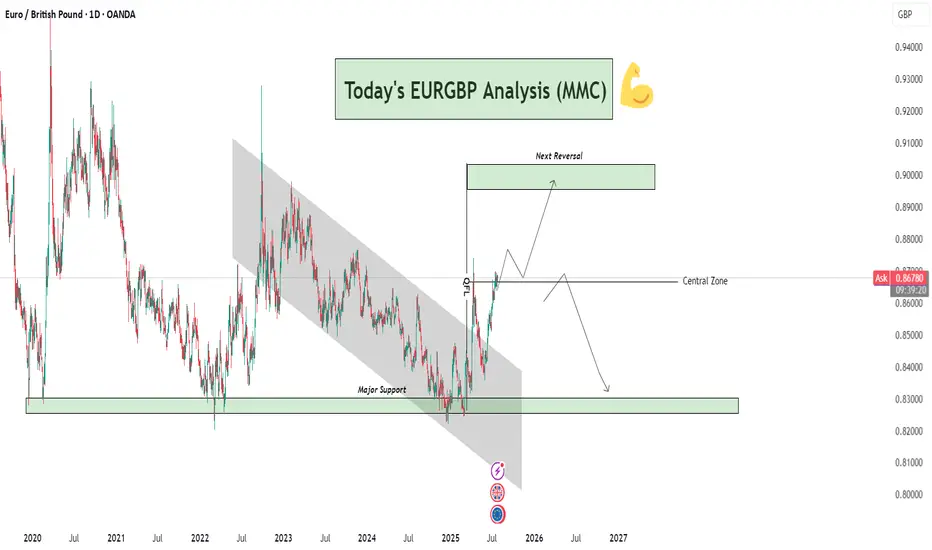
EURGBP Analysis : Breakout, Central Zone Flip & Reversal Target🧠 Overview:
This EURGBP daily chart clearly presents a bullish breakout from a long-term descending channel, a successful reclaim of the central structure zone, and a projection toward a key reversal level. This analysis incorporates Smart Money Concepts (SMC), Market Maker Concepts (MMC), and classic structural behavior.
🔍 Technical Breakdown:
📉 Long-Term Bearish Channel (2021–2025)
For nearly 4 years, EURGBP was trapped in a descending channel, forming consistent lower highs and lower lows.
This long-term bearish phase reflects strong supply-side control and institutional distribution.
The breakout above this structure is significant — marking a potential mid- to long-term trend reversal.
🔁 Major Support Zone (0.8300–0.8350)
Price bounced strongly from this historical demand zone multiple times (in 2021, 2022, and recently in 2025).
This zone is critical and acts as a high-volume accumulation area where smart money has stepped in.
The strong reaction from this level in 2025 triggered the breakout of the bearish structure.
🚀 Break of Structure + Retest
After breaking the descending channel, price retested the upper boundary, confirming a structure shift.
The breakout retest succeeded — marking the transition from a bearish phase to a bullish expansion.
📍 Central Zone Flip
The Central Zone, once a resistance/supply area during the downtrend, has now been reclaimed as support.
This is a powerful MMC concept – where the "central balance" of a structure flips and becomes a base for the next impulse.
Current price is sitting just above this zone, indicating bulls are still in control.
🎯 Next Reversal Zone (Target Area: 0.9000–0.9050)
The chart outlines a projected bullish move toward the Next Reversal Zone marked above.
This is a key supply area, likely to trigger profit-taking or institutional sell orders.
Expect price to range or wick into this zone before showing a possible bearish reversal.
🔄 Future Projection Scenarios:
Scenario 1 – Bullish Continuation:
Price continues to build bullish structure and approaches the 0.90 reversal zone.
Rejection from this zone may trigger consolidation or a minor retracement.
Scenario 2 – Major Reversal:
Upon hitting the next reversal zone, price could reverse and fall back toward the Central Zone or even the Major Support below, especially if macroeconomic fundamentals shift.
🔑 Confluences Supporting This Setup:
✅ Element 🧩 Description
🔹 Major Support Historical demand zone with repeated rejections
🔹 Channel Breakout Structure shift confirming bullish interest
🔹 Retest Success Technical confirmation of breakout validity
🔹 Central Zone Flip Old resistance → new support (MMC principle)
🔹 Reversal Zone Anticipated next profit-taking / supply area
📌 Strategic Insight:
Bias: Bullish short-term to mid-term
Entry Opportunity: Lower timeframe pullbacks into Central Zone (or retest zones)
Target: 0.9000–0.9050 area
Watch for Rejection: In reversal zone for potential bearish shift
⚠️ Risk Note:
Always wait for confirmation at reversal zones. Overextended moves without correction can quickly retrace. Manage your trades with stop-losses below key structural levels and maintain strict risk-reward planning.
🧠 Conclusion:
EURGBP has transitioned from a long bearish cycle into a bullish expansion phase. Smart Money accumulation at the base and a clean breakout with retest confirm a strong directional shift. Keep your focus on the Central Zone retests and the Reversal Zone reaction for optimal entries or exits.
Dailychartanalysis
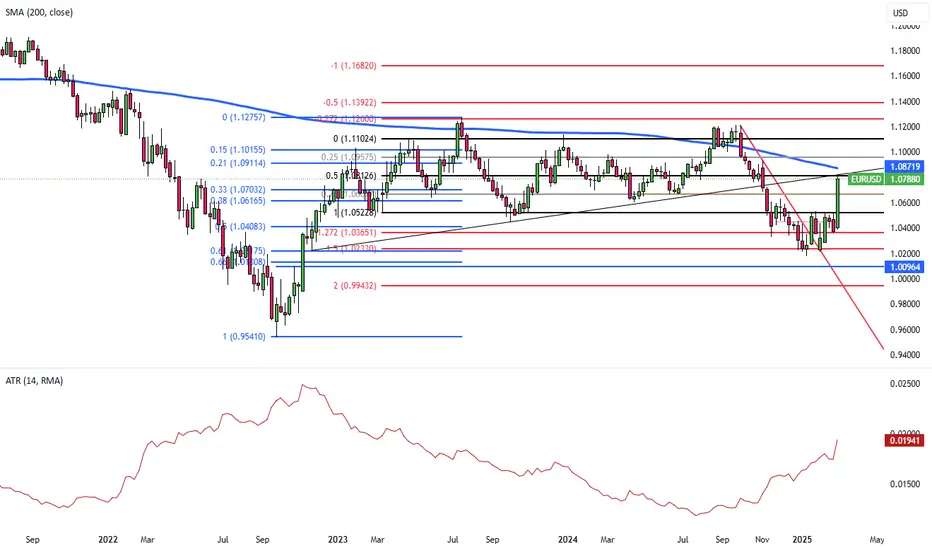
ECB Rate Cut Expected as EU Unveils €800B Defense PlanThe euro neared $1.08, a four-month high, as increased defense spending and borrowing strengthened Eurozone optimism. Germany’s CDU/CSU and SPD agreed to exceed 1% of GDP in defense spending and create a €500 billion off-budget fund. EU plans to mobilize €800 billion for defense, with €150 billion in loans and more fiscal flexibility. The ECB is expected to cut rates for the fifth time this week.
Key resistance is at 1.0840, followed by 1.0900 and 1.0950. Support stands at 1.0760, with further levels at 1.0700 and 1.0650.
DE30 Strengthens Within Ascending Channel, next at 652.00?DJ:DE30 remains within a well-defined ascending channel, with price recently rebounding from a key support level. This suggests a continuation of the uptrend, with the next target near 652.00, aligning with the upper boundary of the channel.
A short-term pullback could present a buying opportunity, particularly if bullish candlestick patterns like an engulfing or hammer formation emerge, confirming buyer strength. A decisive move above recent highs could reinforce momentum toward the expected target.
But if we get a break below the channel’s lower boundary, it would invalidate the bullish outlook and signal a potential shift in market direction.

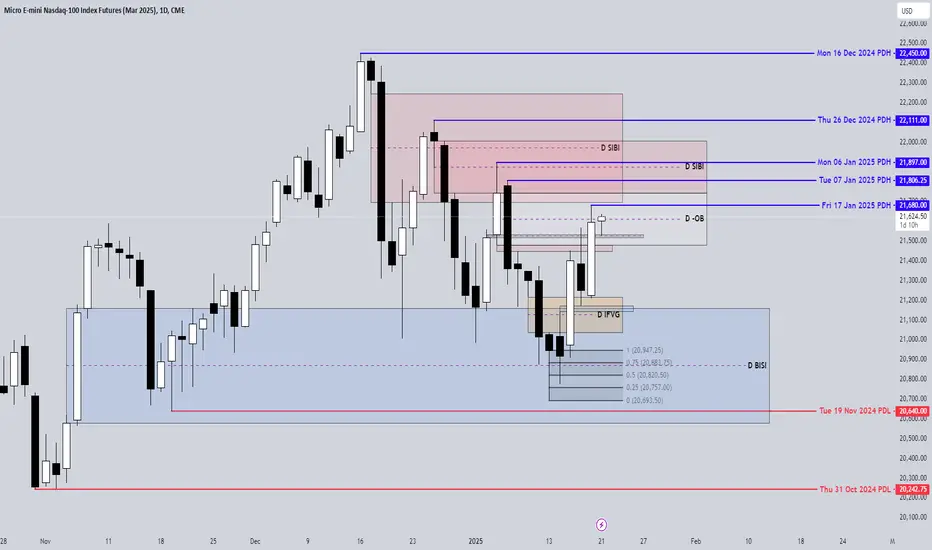
MNQH Continued Bullish Run On Friday price made a nice Bullish run that took out the PDH from the previous two days and price closed above the D LV and D SIBI. Currently we have price wicking off the D LV and has traded higher cutting through the MT level of the -OB. If price can stay above that MT level then I can see price going higher and taking out the PDH from Fri Jan 17 2025 at 21680.00 and then eventually target the PDHs from January 6th and 7th.
So lets continue to watch and see if price has truly switched to being Bullish after taking SSL, and finding support off the D BISI CE level.
pepe long idea hello Traders, here is the full analysis for this pair, let me know in the comment section below if you have any questions, the entry will be taken only if all rules of the strategies will be satisfied. I suggest you keep this pair on your watchlist and see if the rules of your strategy are satisfied. Please also refer to the Important Risk Notice linked below.
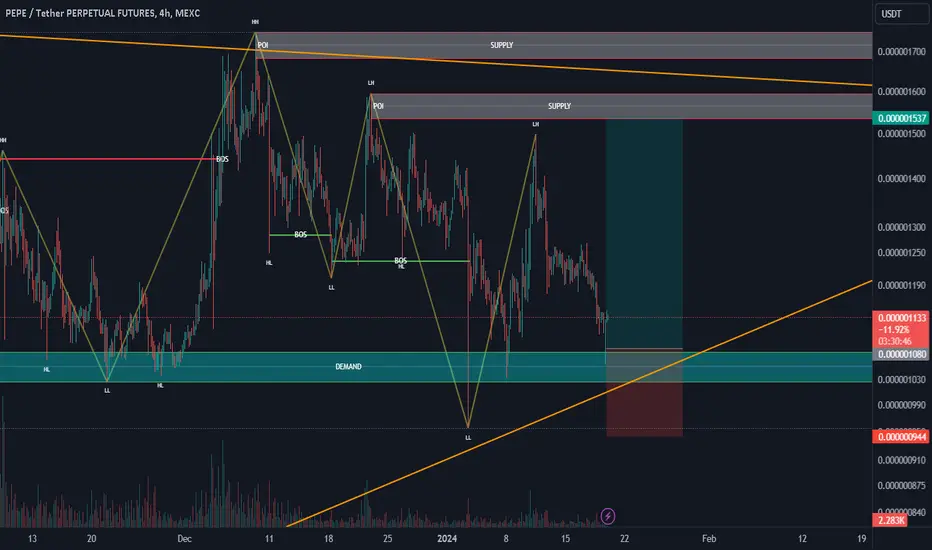
Expected continuation diamond pattern formationA continuation diamond pattern, also known as a diamond bottom or bullish diamond, is a technical analysis chart pattern that usually occurs during an uptrend and signifies a temporary pause or consolidation before the price resumes its upward movement. It's considered a continuation pattern because it typically results in the continuation of the existing bullish trend.
PLEASE NOTE THAT:
This chart analysis is only for reference purpose.
This is not buying or selling recommendations.
I am not SEBI registered.
Please consult your financial advisor before taking any trade

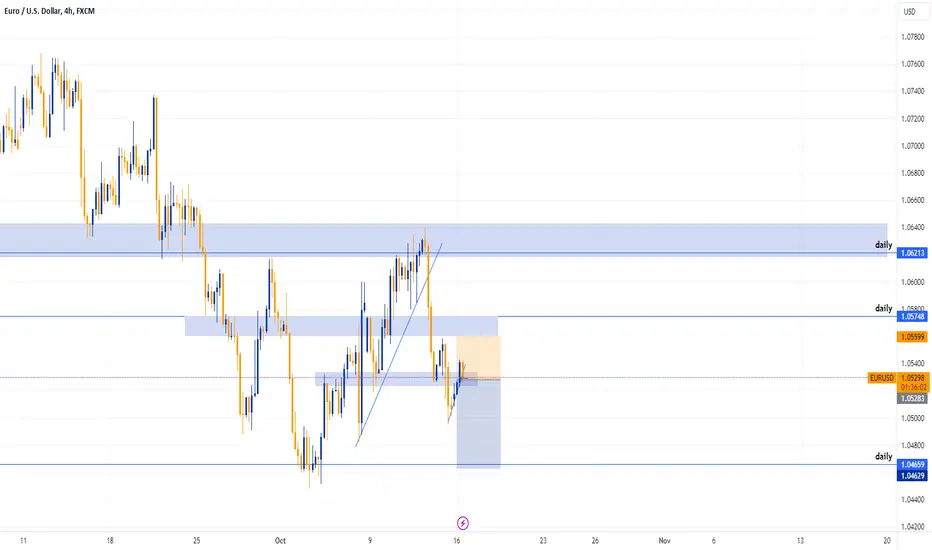
EURUSD SELLFX:EURUSD
Overall structure based on the Daily, 4H and 1H is bearish on EURUSD. A break and retest around the 1.05283 4H resistance area , a bearish engulfing candle on the 1H was my confirmation to go short on EURUSD
BankNifty Future Analysis for 3rd August 2023BankNifty Future Analysis for Today 3rd August 2023
As per our #analysis for #BankNiftyFuture, we are expecting these Intraday levels Tomorrow, kindly check the charts on 15 min time frame and act accordingly.
#IntradayLevels
Disclaimer: All the provided levels are for #educational purpose only, please do your own analysis before doing any trade in the live market or consult your #financial advisor before act.
Follow Us For More #Updates in Future

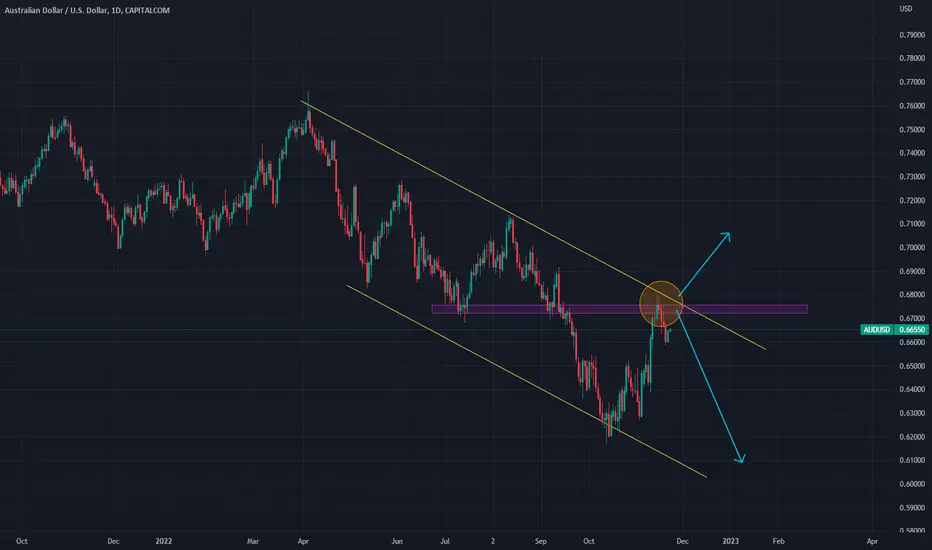
Watching AUD.USDHello Traders.
Anyone else watching the AUD.USD Daily chart?
I'm waiting to see if the price will continue to the downside or break to the upside.
This could be a good trade idea; however, we need to wait and see what price does.
Let me know what you think, what do you think the price will do?
Happy Trading
Samantha
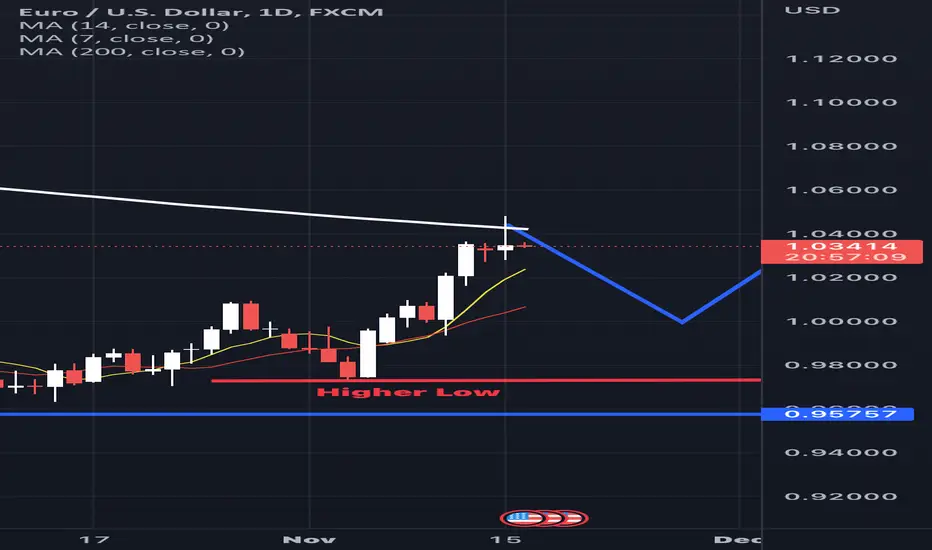
EURUSD DailyCan I just say WOW at the rejection at the 200MA ?!? Honestly this is playing out how I would like to see the market.
I recognize a price action candle, the shooting star. The shooting star often occurs when the market is buying and begins to react at some level of resistance. I am identifying my level of resistance as the 200MA.
I would like to see todays candle (11/16) to close as an engulfed candle. ONLY IF todays candle close with momentum, the market is likely to continue to sell…
But as of right now, I am going to sit on my hands and continue to watch the market form.
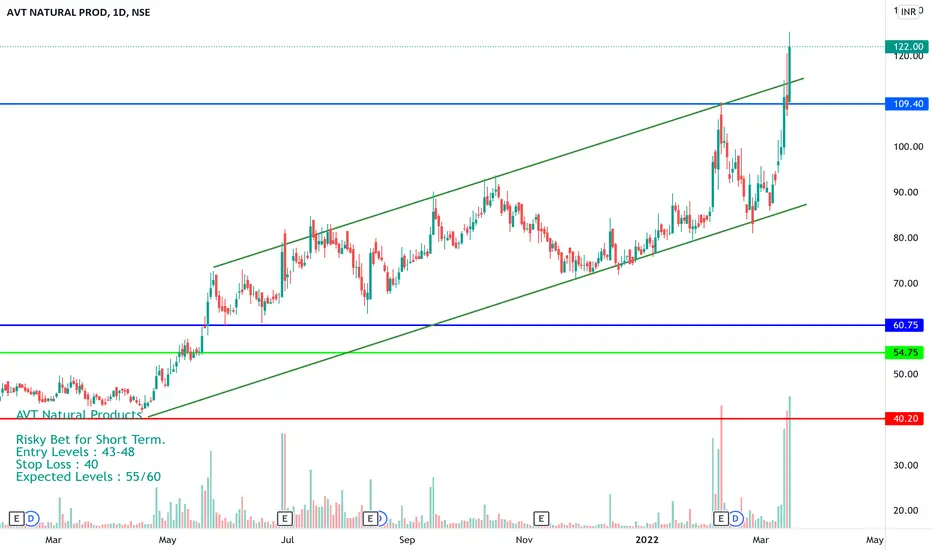
Bullish on AVT Natural Products AVT Natural Products looking bullish on charts with All Time High levels.
CMP - 122
I am expecting 150 - 160 soon.
Keep stop loss 109.
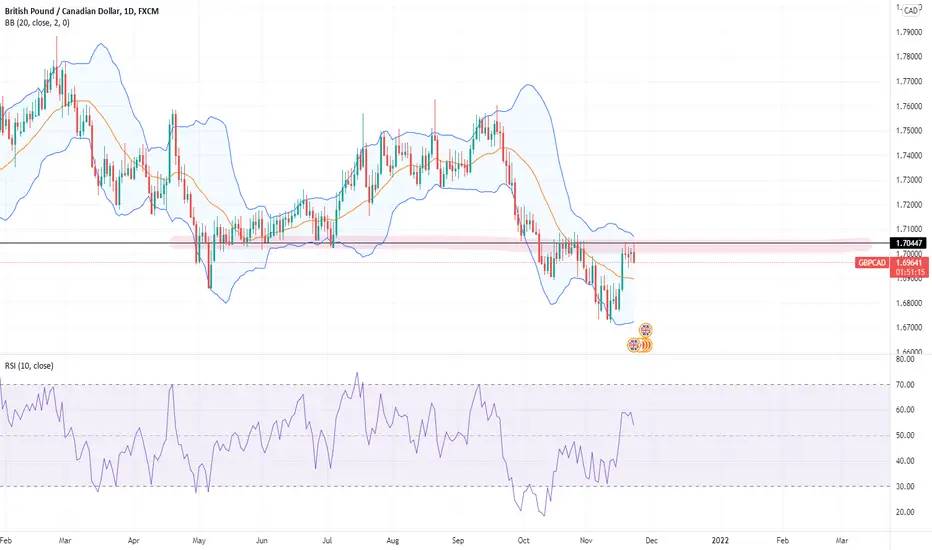
GBPCAD SELLDOJI Candle for last 3 days, Price stuck at the daily resistance level. The daily candle is bearish engulfing. Signal for sell.
AVAXUSDT 1D CHART TRIANGLE BREAKOUTThis is my prediction for AVAXUSDT on the 1D pattern. Not sure when this will happen as I mostly use lower timeframes. Keep your eyes peeled for this one. Not a financial advisor, beginner at this. Share your thoughts below.

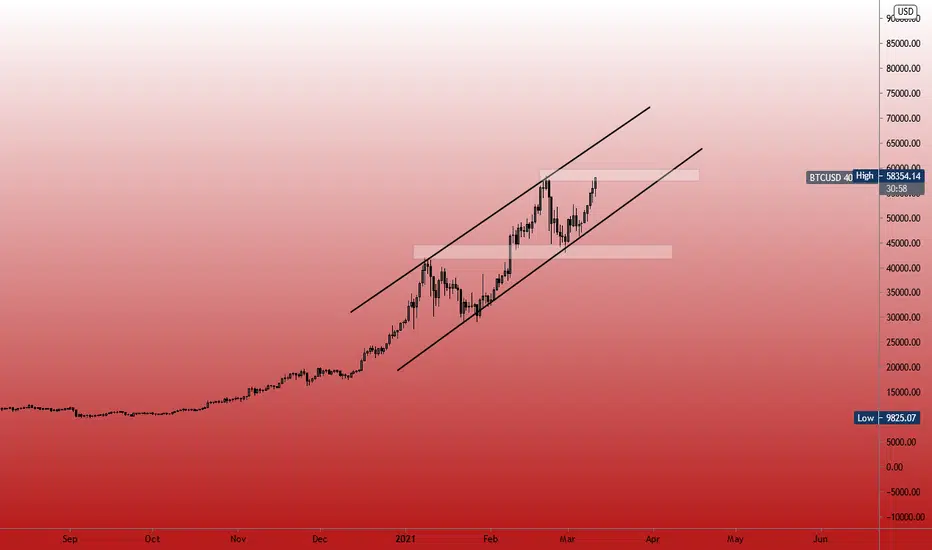
BTC daily chart - swing tradeBTC daily chart - swing trade
* This is my simple analysis *
(My trading style is strictly price action.)
Risk Disclosure
DISCLAIMER: Forex, futures , stocks, crypto and options trading involves substantial risk of loss and is not suitable for every investor. The valuation of futures , stocks and options may fluctuate, and, as a result, clients may lose more than their original investment. The impact of seasonal and geopolitical events is already factored into market prices. The highly leveraged nature of futures trading means that small market movements will have a great impact on your trading account and this can work against you, leading to large losses or can work for you, leading to large gains.
If the market moves against you, you may sustain a total loss greater than the amount you deposited into your account. You are responsible for all the risks and financial resources you use and for the chosen trading system. You should not engage in trading unless you fully understand the nature of the transactions you are entering into and the extent of your exposure to loss. If you do not fully understand these risks you must seek independent advice from your financial advisor.
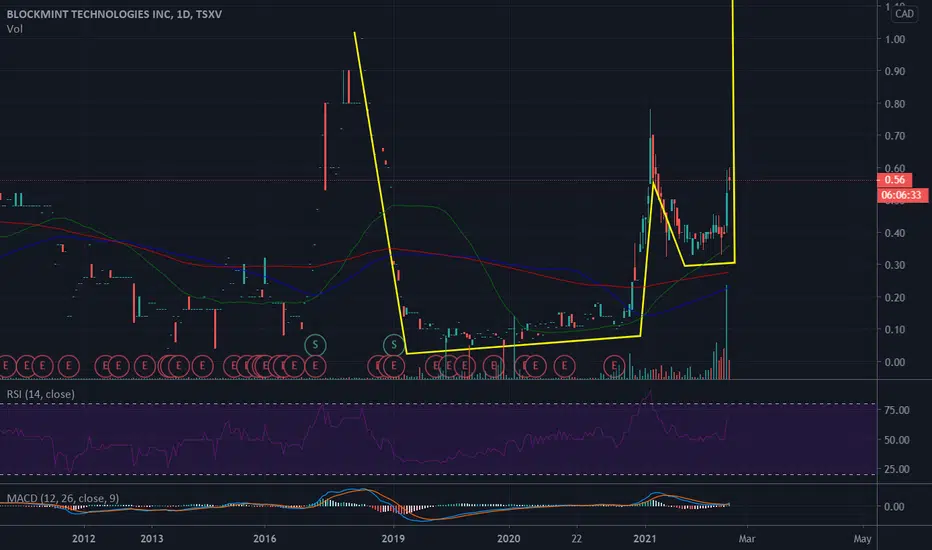
$BKMT / $BKLIF Alert!Cup and handle, golden cross, and Mac D cross on the the daily chart.
Amazing time to get a position before the price moves up!
GBPJPY: Analysis *Daily POV*I made a post about the head and shoulder earlier last week and price rose as I expected. Price has hit a pivot point and is now going towards the bears and i think price could reach the black median line in the box below and either keep falling until the blue support level below just below the head of the head and shoulder formation or rise from the median making a new high for the month.

GBPUSD ANALYSIS UPDATEFOREXCOM:GBPUSD
Hello guys, If you have any question, drop it below in the comment section. Remember to always react to the market.
