Daily Outlook – September 2025 (XAUUSD)Hello traders,
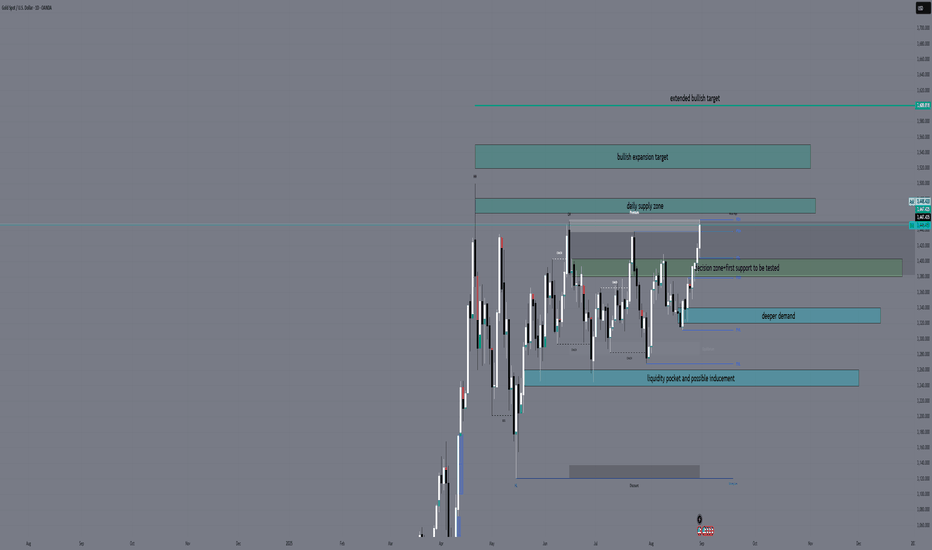
Gold closed August with a strong daily close in premium territory, pressing into the 3460–3480 supply. Bulls still control momentum, but September opens with price testing critical levels where continuation or retracement will be decided.
🔹 Daily Structural Zones
Premium Supply Zone (3460–3480) → overhead resistance where sellers may attempt control.
Decision Zone (3400–3380) → first key support, aligned with EMA 21, pivot for continuation or correction.
Mid-Term Demand Zone (3340–3320) → valid Order Block, aligned with EMA 100, stronger structural support.
Liquidity Retest Zone (3260–3240) → liquidity pocket / inducement area, a level where short-term sweeps and reactions may occur.
🔹 EMA Confluence (Daily)
EMA 5 (3409) → immediate bullish guide.
EMA 21 (3370) → inside Decision Zone.
EMA 50 (3349) → near Mid-Term Demand.
EMA 100 (3330) → aligned with Mid-Term Demand Zone.
EMA 200 (3074) → deeper long-term support, outside daily range.
💡 Interpretation: EMAs confirm layered supports. Decision Zone is short-term pivot, Mid-Term Demand is the first true OB, and below it price could sweep the Liquidity Retest Zone.
🔹 Daily Progression Map
Bullish scenario:
Break above Premium Supply (3460–3480) → unlocks Bullish Expansion Target (3520–3550).
Further continuation → Extended Bullish Target (3600).
Bearish scenario:
Rejection at Premium Supply → pullback into Decision Zone (3400–3380, EMA 21 confluence).
If Decision Zone fails → test into Mid-Term Demand OB (3340–3320, EMA 100 confluence).
Break below 3320 → liquidity sweep into Liquidity Retest Zone (3260–3240) before deeper targets are considered.
🔹 Daily Bias – September
Bullish → while above 3400 (Decision Zone).
Neutral → range between 3480 and 3400.
Bearish shift → only if D1 closes below 3320.
🔹 Conclusion
Gold opens September in premium territory, facing resistance at supply.
Breakout above 3480 → continuation to 3520–3550 and 3600.
Rejection → correction into Decision Zone (3400–3380), then Mid-Term Demand OB (3340–3320).
Below 3320 → expect liquidity play around 3260–3240 before any deeper move.
✨ What’s your view for gold in September? Drop your thoughts below 👇
Don’t forget to🚀🚀🚀my plan and follow GoldFxMinds for daily outlooks and precision sniper-entry plans 🚀📈
Dailyoutlook
XAUUSD Daily Outlook — 25 Aug 2025Hey team — wishing you a sharp start to the week! ✨ Here’s XAUUSD Daily Outlook based on the current range and supply/demand zones.
🔸 Market Context
Powell’s speech on Friday gave gold the momentum push, but the market is still trading inside a wide Daily range.
Monday brings no high-impact news, meaning price is likely to respect technical supply and demand zones until Tuesday’s catalysts arrive.
🔸 Structure & Bias (D1)
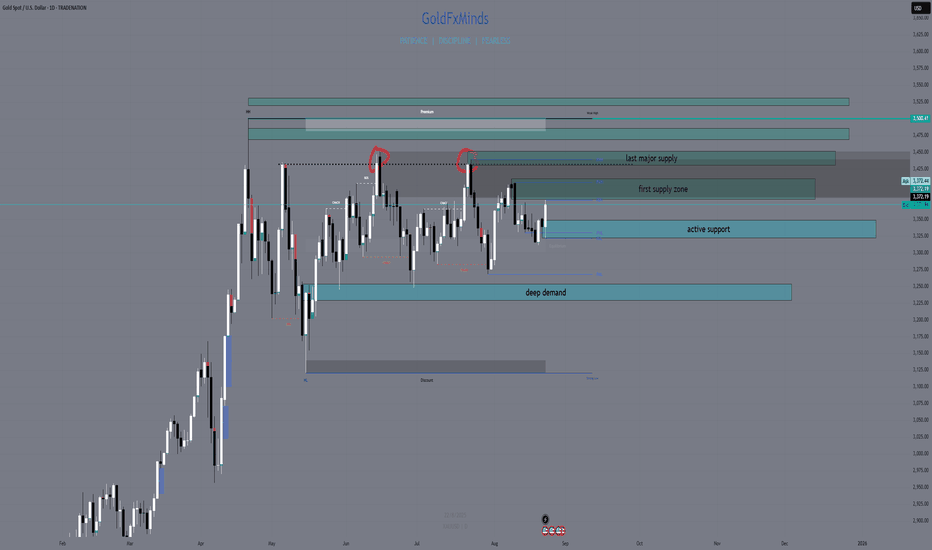
Current price: ~3372
Trend: HTF bullish, Daily still ranging between 3320 demand and 3439 supply cap.
EMA Flow: Price trades above EMA21/EMA50 → bullish tilt, but capped by multiple overhead supply zones.
Liquidity:
Buy-side rests above 3380–3410 → 3439 → 3470–3485 → 3500.
Sell-side sits under 3320–3340 demand zone.
Bias: Bullish as long as 3320–3340 demand zone holds.
🔸 Key Supply & Demand Zones
Lower Demand Zone: 3320 – 3340 (active support, line in the sand for bulls).
Upper Supply Zone 1: 3380 – 3410 (first resistance band).
Major Supply Zone 2: 3430 – 3439 (weekly wick high, range top).
Supply Zone 3: 3470 – 3485 (Daily supply, OB + liquidity pocket).
Supply Zone 4: 3495 – 3500 (critical ceiling before extensions).
Deep Demand Zone: 3250 – 3230 (only active if 3320 breaks decisively).
🔸 Scenarios
Bullish 🟢
If buyers defend 3320–3340 demand, gold can step up into each supply zone:
3380–3410 → first target
3430–3439 → range cap test
Break above 3439 → continuation to 3470–3485
Final supply before extensions: 3495–3500
Only above 3500 do extensions open:
3520–3530 (1.272 Fibo ext)
3635–3650 (1.618 Fibo ext)
Bearish 🔴
Rejection in any supply zone (3380–3410 / 3439 / 3470–3485 / 3500) → pullback into 3320–3340 demand.
Break below 3320 demand → activates the deeper 3250–3230 HTF demand zone.
🔸 Action Plan
3320–3340 demand = key support zone.
As long as this zone holds, bias is bullish toward step-by-step supply tests.
Watch reactions in each supply zone: rejection = range play, break = continuation.
Above 3500 → bullish extensions activate into 3520–3530 and higher.
✨ Gold remains in range, 3320–3439, with multiple supply zones stacked above. Powell lit the fire, but breakout confirmation hasn’t happened yet. If this gave you clarity, drop a like, share your bias below, and follow GoldFxMinds for more updates. 💛
Disclosure: Analysis built on Trade Nation feed (Gold Spot · TradeNation data).
XAUUSD Daily Outlook – 18 August👋 Hello traders,
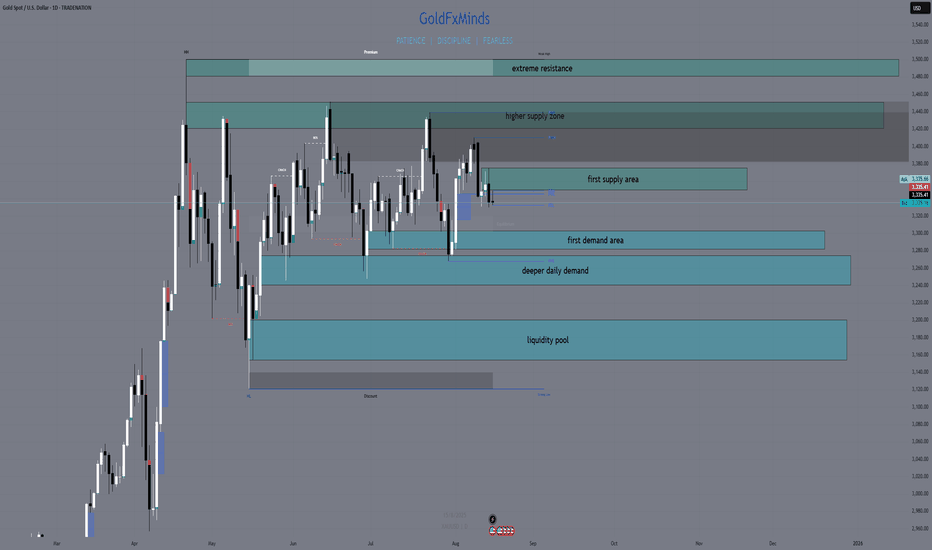
We start the new day with gold sitting near 3335, right under heavy resistance. Markets remain sensitive to this week’s Retail Sales, FOMC minutes, and PMI releases, which could inject volatility into dollar flows and gold’s momentum.
📊 Macro & News Context
The market is waiting on US CPI and FOMC minutes this week – both can set the tone for USD strength/weakness.
Geopolitical tensions (BRICS currency talks + Middle East headlines) keep safe-haven flows alive, giving gold extra volatility.
Dollar index is holding firm, but yields are softening, which adds fuel to gold’s upside pullbacks.
📈 Daily Bias & Trend
Trend: Still bullish on HTF, but daily is showing signs of exhaustion near supply zones.
EMA Flow: EMA 5 & 21 locked bullish above 3310; EMA 50 around 3280 is the deeper support.
RSI: Cooling off from overbought, but still above midline – showing room for retracement before another push.
🔑 Daily Key Zones
Resistance
3350–3370 → Immediate daily supply, strong reaction area above price.
3420–3450 → Extension resistance zone (OB + FVG confluence).
3480–3500 → Extreme long-term resistance cap.
Support
3300–3280 → First daily demand, aligned with EMA21 support.
3275–3240 → Stronger demand, deeper structure level.
3200–3150 → Refined zone:
Top (3200–3150) = OB-based support.
Bottom wick (3150–3120) = Liquidity pool / magnet, not an entry zone.
🎯 Outlook & Action Plan
If gold rejects 3350–3370, we could see a retracement first into 3300–3280, then deeper towards 3275–3240 if macro flows align.
A clean break above 3370 opens the door to 3420–3450. Watch for liquidity sweeps and OB reactions before committing.
Below 3240, gold risks tapping the 3200–3150 liquidity pool, which may attract buyers again for a long-term swing.
✨ This Daily map gives us a full range: immediate reactions near 3350–3370, supports at 3300 & 3275, and a long-term magnet around 3150.
💡 What’s your outlook? Do you expect gold to revisit deeper supports before extending higher, or push directly into fresh highs?
👉 If you find this helpful, boost this idea🚀🚀🚀 & hit follow to stay updated with every sniper-level outlook. Let’s grow this community together ❤️📝🌍
Stay sharp,
GoldFxMinds
📌 Disclosure: Outlook based on Trade Nation charts. Educational purpose only — not financial advice.
Daily XAUUSD OutlookGood day traders 🌟
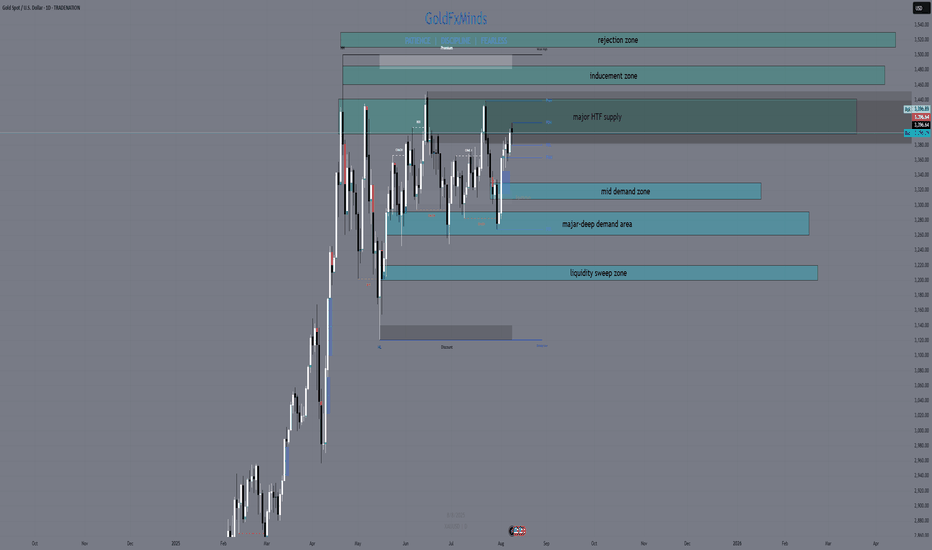
Gold opens today’s session still holding strong near the upper boundaries of its daily range, trading just beneath the dominant weekly supply zone. Buyers have kept control above the 3290 handle, while sellers continue to defend the ceiling around 3439. With a busy US data week ahead, the daily chart sets the stage for either a decisive breakout or a calculated pullback into fresh demand.
📌 Bias: Bullish — daily structure remains firmly intact above 3290, dynamic EMA flow is aligned for upside, and momentum is in buyers’ favor. Still, given we’re in premium pricing, waiting for confirmation is essential before entering fresh positions.
Macro Context
Markets are poised for volatility with US CPI, PPI, and retail sales lined up. Softer inflation data could give bulls the push to clear the 3439 ceiling, while stronger numbers may invite a retracement toward lower daily demand zones.
📊 Key Daily Zones
Immediate Resistance / Supply: 3395 – 3439 (HTF supply overlap + liquidity resting above).
Mid-Level Demand: 3330 – 3310 (recent bullish OB, intraday reload zone).
Major Daily Demand: 3290 – 3260 (untested breakout base).
📊 Key Zones
Above Current Price
Immediate Resistance / Supply: 3395 – 3439 (major HTF supply).
3460 – 3475 → H4/D1 imbalance + inducement zone.
3480 – 3490 → 1.618 Fibonacci extension from last weekly swing.
3510 – 3525 → minor HTF supply / wick rejection zone.
Below Current Price
Mid-Level Demand: 3330 – 3310 (recent bullish OB).
Major Daily Demand: 3290 – 3260 (untested breakout base).
3220 – 3200 → daily demand + liquidity sweep zone.
3155 – 3140 → daily OB + HTF BOS retest.
3100 – 3085 → HTF demand + liquidity shelf.
3040 – 3020 → deep daily demand + Fibo 0.786 retracement of May rally.
🚀 Bullish Scenario
A break and daily close above 3439 clears the path toward 3460 – 3475, with extension targets at 3480 – 3490 and 3510 – 3525.
Pullbacks into 3330 – 3310 or 3290 – 3260 with bullish confirmation may offer high-RR entries back toward the highs.
📉 Bearish Scenario
Rejection from 3439 could push price back toward 3330 – 3310 or 3290 – 3260.
A daily close below 3260 opens deeper targets at 3220 – 3200, 3155 – 3140, and potentially 3100 – 3085.
🔍 Confluence & Indicators
Dynamic EMA Flow: Bullish, price above all major EMAs.
RSI: Neutral-to-bullish, no divergence on D1.
FVGs: Unfilled gap above 3439 acts as liquidity magnet.
Fibonacci: Price near 1.272 extension, with 1.618 above at 3480–3490.
📌 Outlook Summary
Gold is coiled near the top of its range in a bullish structure. The best setups will come from either a confirmed breakout above 3439 toward higher HTF targets or a disciplined buy from demand after a healthy retracement.
💬 Your move — will gold finally push through the highs, or is a deeper pullback coming first? Share your thoughts below and let’s track the market together.
If you find these outlooks useful, hit like and follow for precision updates.
— GoldFxMinds
Disclosure: This analysis uses Trade Nation’s price feed and is for educational purposes only — not financial advice.
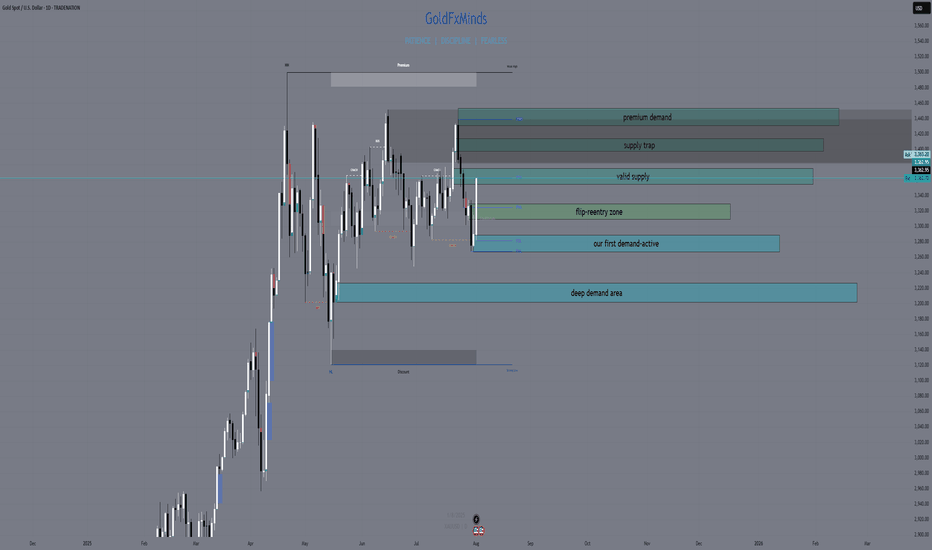
XAUUSD Daily Outlook – August 4, 2025We’re not in breakout. We’re deep in premium — and supply is stacked.
—
Gold is now trading at 3362, sitting right inside the first valid daily supply zone — the same block between 3355 and 3375 that caused the last rejection. The bullish rally from 3272 was clean: liquidity sweep, CHoCH, imbalance filled, HL confirmed. Bulls did their job. Now they’re walking straight into pressure.
Above this zone, things don’t get easier — they get trickier.
Just a bit higher, we have an internal supply trap between 3398 and 3412. It’s a reaction zone built from imbalance and inducement — not strong enough to hold a reversal on its own, but perfect to fake out breakout buyers. If price pushes through 3375 and enters this pocket, snipers should be watching carefully for early signs of weakness.
And finally, at the top of the current structure sits the HTF supply trap at 3430–3439 — the last weekly wick, the macro reversal zone. That level is sacred. If price makes it there, either we’ll see full-blown expansion… or a violent reversal born from overconfidence.
So what do we do now?
We wait.
If price starts to reject from this 3355–3375 supply with bearish intent, we target the flip reentry zone at 3318–3328 — the previous CHoCH break and dynamic EMA cluster. That’s your first intraday long trigger if bulls want to come back strong.
If that breaks, next is the demand base at 3287–3267, the origin of this entire bullish move. Below that? Imbalance support near 3225 — the final line before structure shifts.
—
🟥 Valid Supply Zone → 3355–3375
🟥 Internal Supply Trap → 3398–3412
🟥 HTF Supply Trap → 3430–3439
🟫 Flip Reentry Zone → 3318–3328
🟦 Demand Base → 3287–3267
🟦 Imbalance Support → 3225–3205
—
This isn’t a breakout. It’s a build-up inside premium.
The smartest move today might be no move — until structure speaks.
—
Are you watching for the rejection? Or the breakout trap?
Let us know your bias below 👇🏼
Tap that ❤️ if this gave clarity, and follow GoldFxMinds to stay ahead of every key level — no noise, just structure.
—
With sniper calm and strategic clarity,
GoldFxMinds 💙
Disclosure: Analysis based on Trade Nation TradingView chart feed.
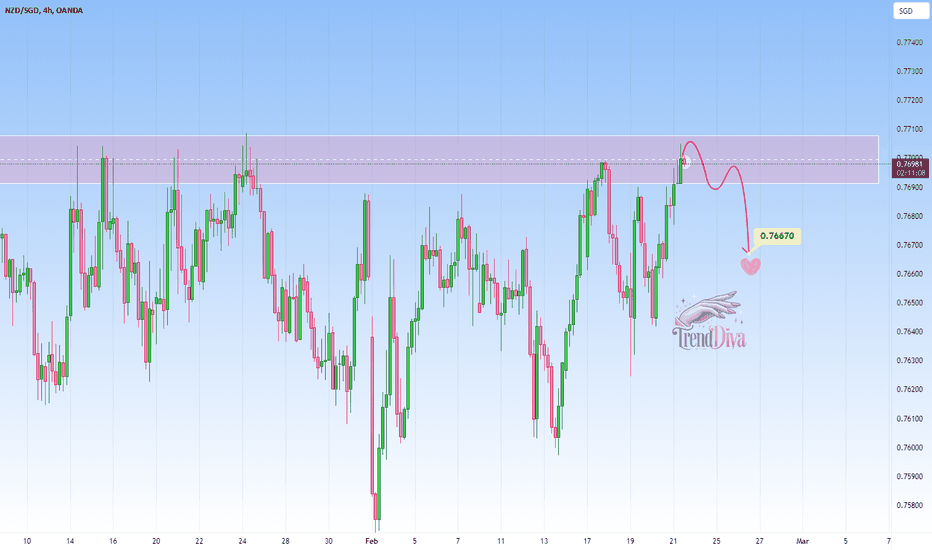
NZDSGD at Key Resistance – Will Sellers Step In? OANDA:NZDSGD has reached a significant resistance zone. This area has historically acted as a supply zone, increasing the likelihood of a pullback if sellers step in.
The current market structure suggests that if the price confirms a rejection from this resistance, we might see a move lower toward the 0.76670 level , a clear target based on past price behavior and current market structure.
Just my take on support and resistance zones—not financial advice. Always confirm your setups and trade with solid risk management.
Best of luck!
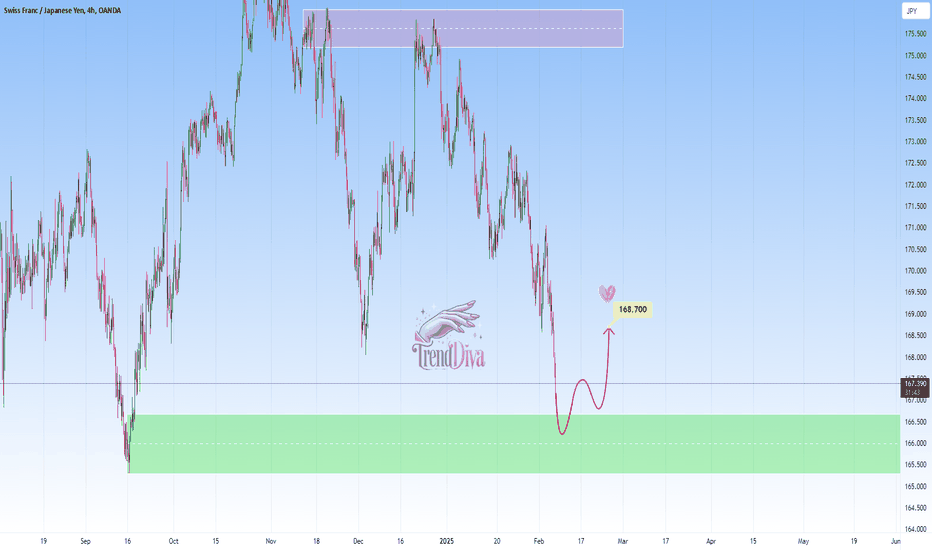
CHFJPY - Potential Buying Opportunity to 168.700OANDA:CHFJPY is currently approaching a critical demand zone and as the market has been in a strong downtrend, everyone’s watching to see if buyers will step in and turn things around.
That particular demand zone has previously acted as a strong support level and now as price tests this area again, the question is whether support will hold or if sellers will push through to lower levels.
If support holds, I anticipate a move toward 168.700, where price could encounter resistance.
However, the market rarely moves in a straight line. If buyers can’t hold this demand zone, we could see price break lower, leading to further downside and possibility for a continuation of the bearish trend. For now, let's see how price reacts at this key zone—will it be a turning point, or will sellers remain in control?
Platinum Approaching Key Resistance — Will It Drop to 1,010$?OANDA:XPTUSD is approaching a significant resistance zone, an area where sellers have previously stepped in to drive prices lower. This area has historically acted as a supply zone, making it a key level to watch for potential rejection.
If price struggles to break above and we see bearish confirmation—such as rejection wicks, a bearish engulfing candle, or weakening bullish momentum—I anticipate a pullback toward the $1,010 level. However, a strong breakout and hold above resistance could invalidate the bearish outlook, potentially opening the door for further upside.
This is not financial advice but rather how I approach support/resistance zones. Remember, always wait for confirmation, like a rejection candle or volume spike before jumping in.
Please boost this post, every like and comment drives me to bring you more ideas! I’d love to hear your perspective in the comments.
Best of luck , TrendDiva
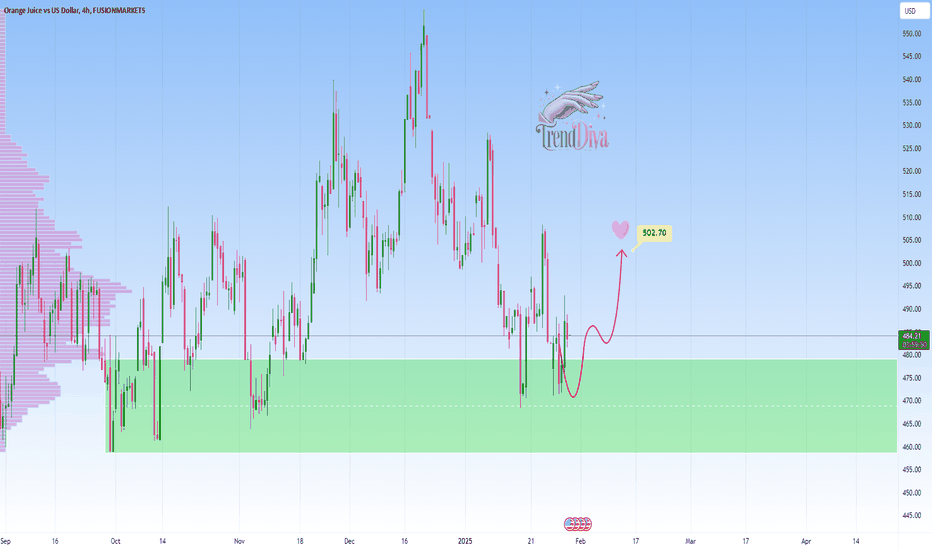
ORANGE JUICE Testing Key Support: Will Buyers Step In?FUSIONMARKETS:OJ has reached a significant demand area that has historically attracted buyers, leading to bullish momentum. This support level aligns with prior price reactions and represents a strong foundation for potential upward moves.
If the support holds and bullish confirmation appears, such as bullish engulfing candles or long lower wicks, I anticipate a move toward 502.70 level. Conversely, if the support is broken, the bullish outlook could weaken, paving the way for further declines.
This is not financial advice but rather how I approach support/resistance zones. Remember, always wait for confirmation, like a rejection candle or volume spike before jumping in.
Please boost this post, every like and comment drives me to bring you more ideas! I’d love to hear your perspective in the comments.
Best of luck , TrendDiva
GOLD is Setting Up For LONGS! Prepare to BUY!Price is pulling back to the Daily +FVG, which is nested in the Weekly +FVG, which is intersected by the Swing High. Three strong confluences for a high probability LONG.
Be patient, look for price to contact the POI, and then let your valid buy setup form.
Let the rest unfold.
Enjoy!
May profits be upon you.
Leave any questions or comments in the comment section.
I appreciate any feedback from my viewers!
Like and/or subscribe if you want more accurate analysis.
Thank you so much!
Disclaimer:
I do not provide personal investment advice and I am not a qualified licensed investment advisor.
All information found here, including any ideas, opinions, views, predictions, forecasts, commentaries, suggestions, expressed or implied herein, are for informational, entertainment or educational purposes only and should not be construed as personal investment advice. While the information provided is believed to be accurate, it may include errors or inaccuracies.
I will not and cannot be held liable for any actions you take as a result of anything you read here.
Conduct your own due diligence, or consult a licensed financial advisor or broker before making any and all investment decisions. Any investments, trades, speculations, or decisions made on the basis of any information found on this channel, expressed or implied herein, are committed at your own risk, financial or otherwise.
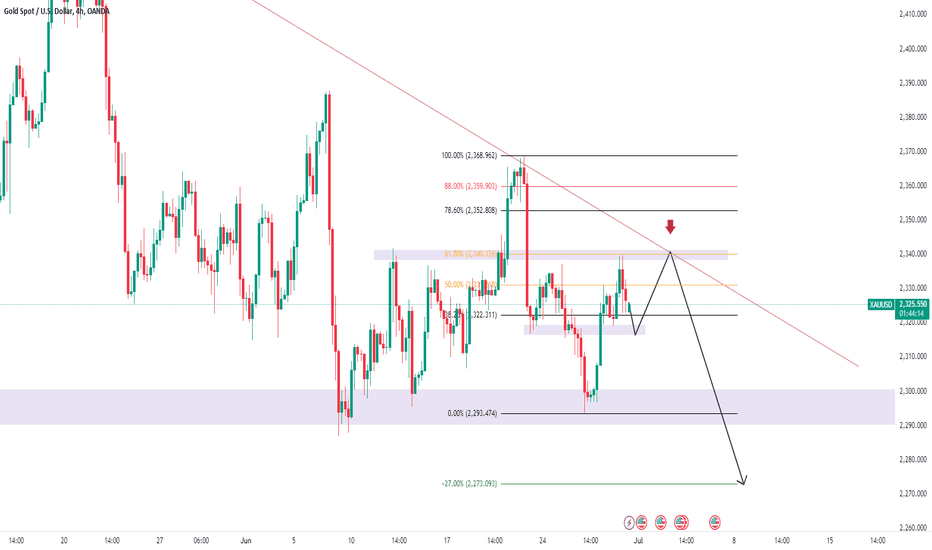
Seeing a huge drop coming for GOLD this weekGOLD may retest 2318 area and complete an inverted head and shoulders, and then head up to resistance level which lines up perfectly on trendline resistance AND lines up perfectly at the 61.8% Fibonacci level, this is a very interesting level for these 3 lining up this trendline has been valid for months and very strong trendline resistance that has been tested multiple times. I suspect GOLD will plummet down to 2300-2280 by the end of this week, probably during London session as from my personal experience I have seen this happen multiple times and have taken this opportunity to profit off this pattern
moreover the DXY has been making impulses to the upside and healthy retracements to continue with another impulse this week if the trend continues, keeping on eye on news to support this bias and watching these levels on particular the 2340-2350 area
10 Daily Outlooks. D6. BTCUSD, EU, XAUUSD, USDCAD and others☝️The main purpose of my resources is free, actionable education for anyone who wants to learn trading and improve mental and technical trading skills. Learn from hundreds of videos and the real story of a particular trader, with all the mistakes and pain on the way to consistency. I'm always glad to discuss and answer questions. 🙌
☝️ALL videos here are for sharing my experience purposes only, not financial advice, NOT A SIGNAL. YOUR TRADES ARE YOUR COMPLETE RESPONSIBILITY. Everything here should be treated as a simulated, educational environment. Important disclaimer - this idea is just a possibility and my extremely subjective opinion.
12/1/23 US30 Daily Outlook12/1/23 US30 Daily Outlook
#US30 #DailyOutlook
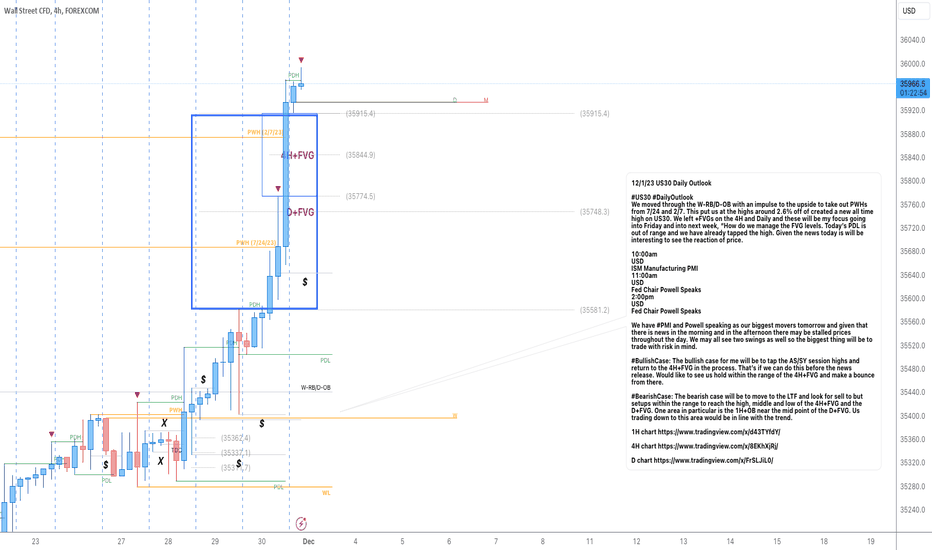
We moved through the W-RB/D-OB with an impulse to the upside to take out PWHs from 7/24 and 2/7. This put us at the highs around 2.6% off of created a new all time high on US30. We left +FVGs on the 4H and Daily and these will be my focus going into Friday and into next week, “How do we manage the FVG levels. Today’s PDL is out of range and we have already tapped the high. Given the news today is will be interesting to see the reaction of price.
10:00am
USD
ISM Manufacturing PMI
11:00am
USD
Fed Chair Powell Speaks
2:00pm
USD
Fed Chair Powell Speaks
We have #PMI and Powell speaking as our biggest movers tomorrow and given that there is news in the morning and in the afternoon there may be stalled prices throughout the day. We may all see two swings as well so the biggest thing will be to trade with risk in mind.
#BullishCase: The bullish case for me will be to tap the AS/SY session highs and return to the 4H+FVG in the process. That’s if we can do this before the news release. Would like to see us hold within the range of the 4H+FVG and make a bounce from there.
#BearishCase: The bearish case will be to move to the LTF and look for sell to but setups within the range to reach the high, middle and low of the 4H+FVG and the D+FVG. One area in particular is the 1H+OB near the mid point of the D+FVG. Us trading down to this area would be in line with the trend.
1H chart
4H chart
D chart
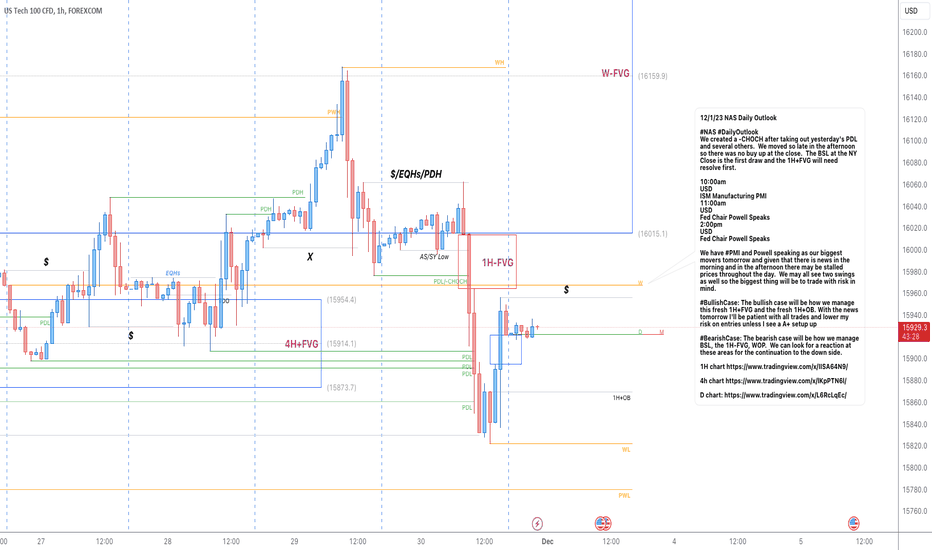
12/1/23 NAS Daily Outlook12/1/23 NAS Daily Outlook
#NAS #DailyOutlook
We created a -CHOCH after taking out yesterday's PDL and several others. We moved so late in the afternoon so there was no buy up at the close. The BSL at the NY Close is the first draw and the 1H+FVG will need resolve first.
10:00am
USD
ISM Manufacturing PMI
11:00am
USD
Fed Chair Powell Speaks
2:00pm
USD
Fed Chair Powell Speaks
We have #PMI and Powell speaking as our biggest movers tomorrow and given that there is news in the morning and in the afternoon there may be stalled prices throughout the day. We may all see two swings as well so the biggest thing will be to trade with risk in mind.
#BullishCase: The bullish case will be how we manage this fresh 1H+FVG and the fresh 1H+OB. With the news tomorrow I'll be patient with all trades and lower my risk on entries unless I see a A+ setup up
#BearishCase: The bearish case will be how we manage BSL, the 1H-FVG, WOP. We can look for a reaction at these areas for the continuation to the down side.
1H chart
4h chart
D chart:
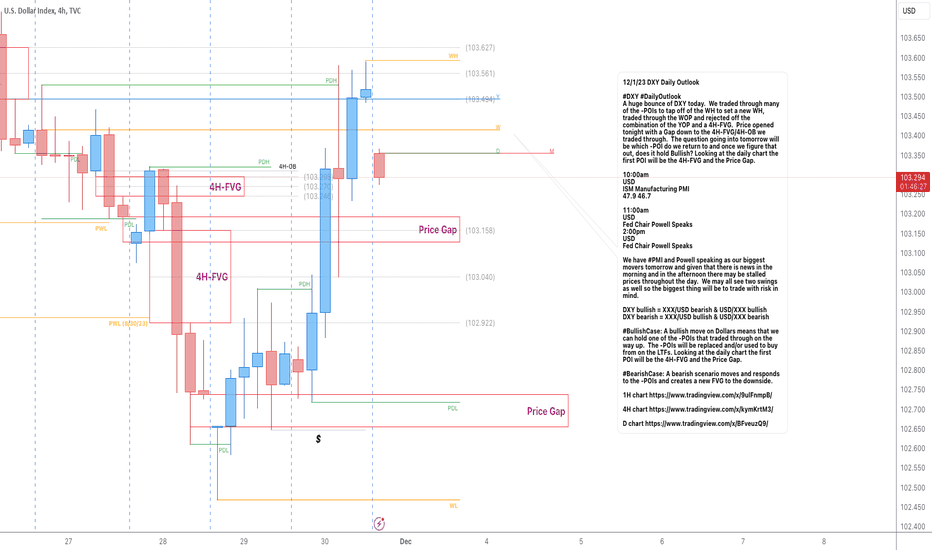
12/1/23 DXY Daily Outlook12/1/23 DXY Daily Outlook
#DXY #DailyOutlook
A huge bounce of DXY today. We traded through many of the -POIs to tap off of the WH to set a new WH, traded through the WOP and rejected off the combination of the YOP and a 4H-FVG. Price opened tonight with a Gap down to the 4H-FVG/4H-OB we traded through. The question going into tomorrow will be which -POI do we return to and once we figure that out, does it hold Bullish? Looking at the daily chart the first POI will be the 4H-FVG and the Price Gap.
10:00am
USD
ISM Manufacturing PMI
47.9 46.7
11:00am
USD
Fed Chair Powell Speaks
2:00pm
USD
Fed Chair Powell Speaks
We have #PMI and Powell speaking as our biggest movers tomorrow and given that there is news in the morning and in the afternoon there may be stalled prices throughout the day. We may all see two swings as well so the biggest thing will be to trade with risk in mind.
DXY bullish = XXX/USD bearish & USD/XXX bullish
DXY bearish = XXX/USD bullish & USD/XXX bearish
#BullishCase: A bullish move on Dollars means that we can hold one of the -POIs that traded through on the way up. The -POIs will be replaced and/or used to buy from on the LTFs. Looking at the daily chart the first POI will be the 4H-FVG and the Price Gap.
#BearishCase: A bearish scenario moves and responds to the -POIs and creates a new FVG to the downside.
1H chart
4H chart
D chart
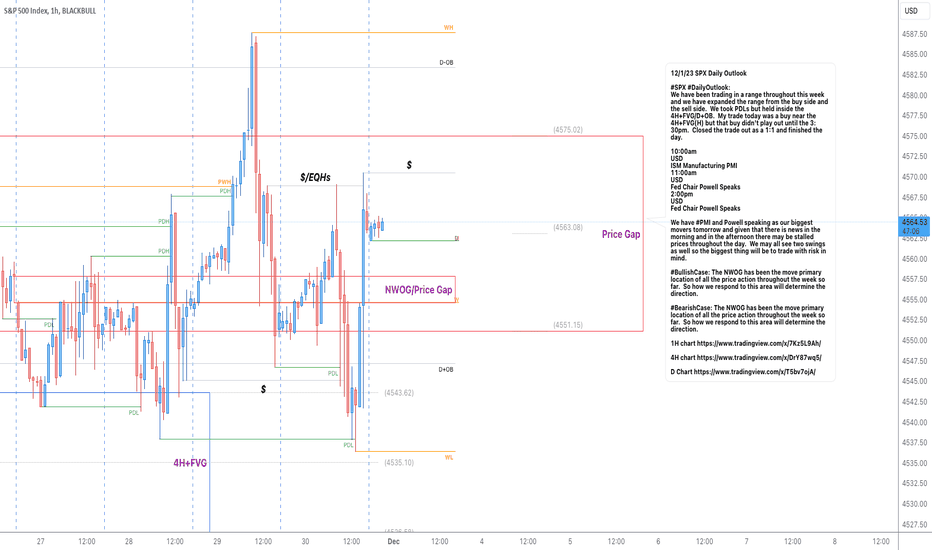
12/1/23 SPX Daily Outlook12/1/23 SPX Daily Outlook
#SPX #DailyOutlook:
We have been trading in a range throughout this week and we have expanded the range from the buy side and the sell side. We took PDLs but held inside the 4H+FVG/D+OB. My trade today was a buy near the 4H+FVG(H) but that buy didn't play out until the 3:30pm. Closed the trade out as a 1:1 and finished the day.
10:00am
USD
ISM Manufacturing PMI
11:00am
USD
Fed Chair Powell Speaks
2:00pm
USD
Fed Chair Powell Speaks
We have #PMI and Powell speaking as our biggest movers tomorrow and given that there is news in the morning and in the afternoon there may be stalled prices throughout the day. We may all see two swings as well so the biggest thing will be to trade with risk in mind.
#BullishCase: The NWOG has been the move primary location of all the price action throughout the week so far. So how we respond to this area will determine the direction.
#BearishCase: The NWOG has been the move primary location of all the price action throughout the week so far. So how we respond to this area will determine the direction.
1H chart
4H chart
D Chart
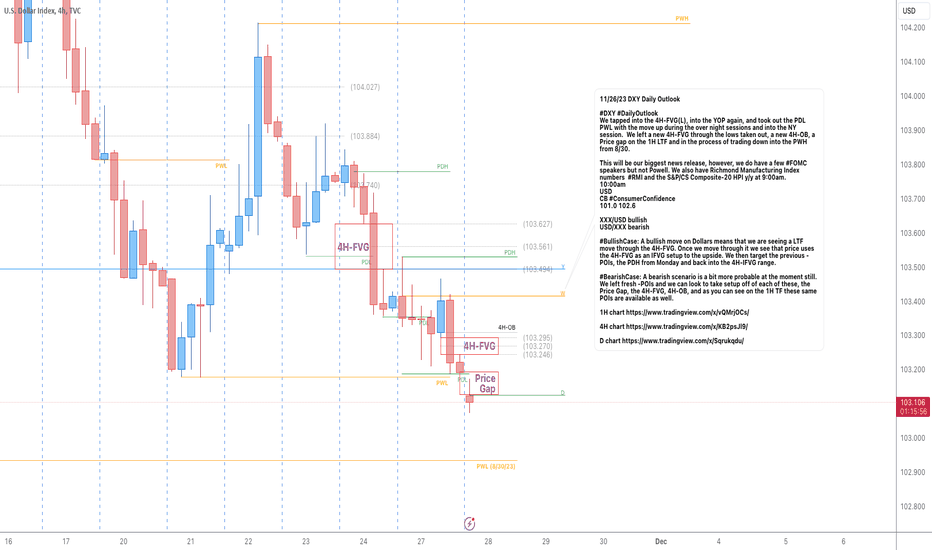
11/26/23 DXY Daily Outlook11/26/23 DXY Daily Outlook
#DXY #DailyOutlook
We tapped into the 4H-FVG(L), into the YOP again, and took out the PDL PWL with the move up during the over night sessions and into the NY session. We left a new 4H-FVG through the lows taken out, a new 4H-OB, a Price gap on the 1H LTF and in the process of trading down into the PWH from 8/30.
This will be our biggest news release, however, we do have a few #FOMC speakers but not Powell. We also have Richmond Manufacturing Index numbers #RMI and the S&P/CS Composite-20 HPI y/y at 9:00am.
10:00am
USD
CB #ConsumerConfidence
101.0 102.6
XXX/USD bullish
USD/XXX bearish
#BullishCase: A bullish move on Dollars means that we are seeing a LTF move through the 4H-FVG. Once we move through it we see that price uses the 4H-FVG as an IFVG setup to the upside. We then target the previous -POIs, the PDH from Monday and back into the 4H-IFVG range.
#BearishCase: A bearish scenario is a bit more probable at the moment still. We left fresh -POIs and we can look to take setup off of each of these, the Price Gap, the 4H-FVG, 4H-OB, and as you can see on the 1H TF these same POIs are available as well.
1H chart
4H chart
D chart
11/28/23 NAS Daily Outlook11/28/23 NAS Daily Outlook
#NAS #DailyOutlook
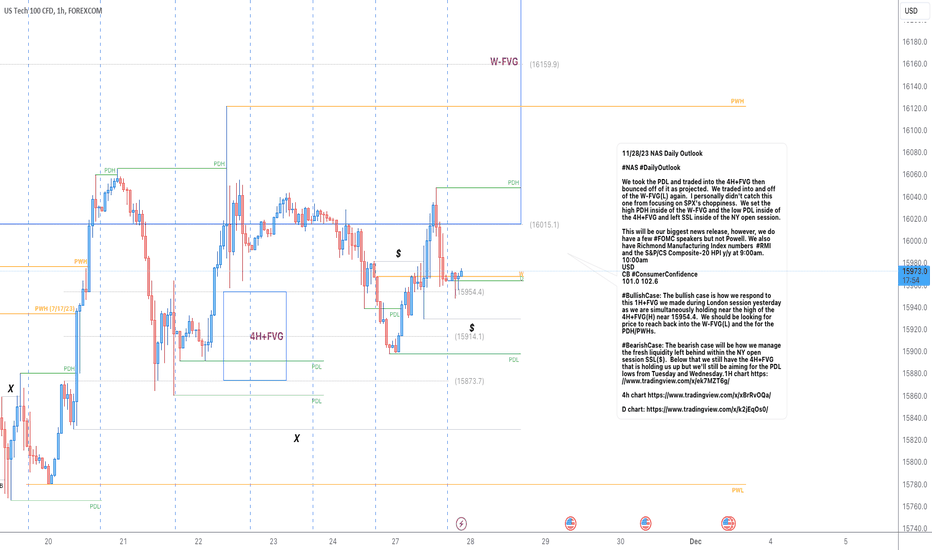
We took the PDL and traded into the 4H+FVG then bounced off of it as projected. We traded into and off of the W-FVG(L) again. I personally didn't catch this one from focusing on SPX's choppiness. We set the high PDH inside of the W-FVG and the low PDL inside of the 4H+FVG and left SSL inside of the NY open session.
This will be our biggest news release, however, we do have a few #FOMC speakers but not Powell. We also have Richmond Manufacturing Index numbers #RMI and the S&P/CS Composite-20 HPI y/y at 9:00am.
10:00am
USD
CB #ConsumerConfidence
101.0 102.6
#BullishCase: The bullish case is how we respond to this 1H+FVG we made during London session yesterday as we are simultaneously holding near the high of the 4H+FVG(H) near 15954.4. We should be looking for price to reach back into the W-FVG(L) and the for the PDH/PWHs.
#BearishCase: The bearish case will be how we manage the fresh liquidity left behind within the NY open session SSL($). Below that we still have the 4H+FVG that is holding us up but we'll still be aiming for the PDL lows from Tuesday and Wednesday.1H chart
4h chart
D chart:
11/28/23 US30 Daily Outlook11/28/23 US30 Daily Outlook
#US30 #DailyOutlook
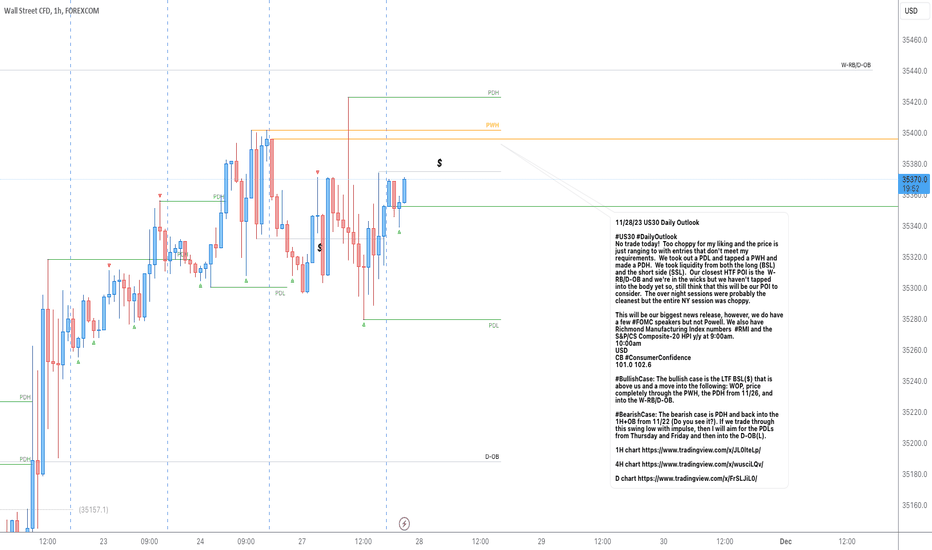
No trade today! Too choppy for my liking and the price is just ranging to with entries that don't meet my requirements. We took out a PDL and tapped a PWH and made a PDH. We took liquidity from both the long (BSL) and the short side (SSL). Our closest HTF POI is the W-RB/D-OB and we're in the wicks but we haven't tapped into the body yet so, still think that this will be our POI to consider. The over night sessions were probably the cleanest but the entire NY session was choppy.
This will be our biggest news release, however, we do have a few #FOMC speakers but not Powell. We also have Richmond Manufacturing Index numbers #RMI and the S&P/CS Composite-20 HPI y/y at 9:00am.
10:00am
USD
CB #ConsumerConfidence
101.0 102.6
#BullishCase: The bullish case is the LTF BSL($) that is above us and a move into the following: WOP, price completely through the PWH, the PDH from 11/26, and into the W-RB/D-OB.
#BearishCase: The bearish case is PDH and back into the 1H+OB from 11/22 (Do you see it?). If we trade through this swing low with impulse, then I will aim for the PDLs from Thursday and Friday and then into the D-OB(L).
1H chart
4H chart
D chart
11/28/23 SPX Daily Outlook11/28/23 SPX Daily Outlook
#SPX #DailyOutlook:
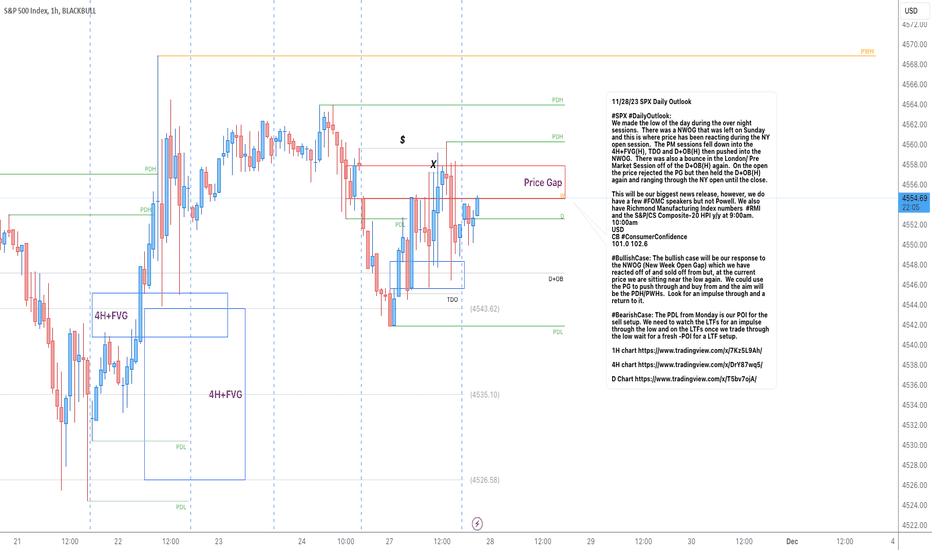
We made the low of the day during the over night sessions. There was a NWOG that was left on Sunday and this is where price has been reacting during the NY open session. The PM sessions fell down into the 4H+FVG(H), TDO and D+OB(H) then pushed into the NWOG. There was also a bounce in the London/ Pre Market Session off of the D+OB(H) again. On the open the price rejected the PG but then held the D+OB(H) again and ranging through the NY open until the close.
This will be our biggest news release, however, we do have a few #FOMC speakers but not Powell. We also have Richmond Manufacturing Index numbers #RMI and the S&P/CS Composite-20 HPI y/y at 9:00am.
10:00am
USD
CB #ConsumerConfidence
101.0 102.6
#BullishCase: The bullish case will be our response to the NWOG (New Week Open Gap) which we have reacted off of and sold off from but, at the current price we are sitting near the low again. We could use the PG to push through and buy from and the aim will be the PDH/PWHs. Look for an impulse through and a return to it.
#BearishCase: The PDL from Monday is our POI for the sell setup. We need to watch the LTFs for an impulse through the low and on the LTFs once we trade through the low wait for a fresh -POI for a LTF setup.
1H chart
4H chart
D Chart
11/21/23 All Indices Daily Outlook#NAS #SPX #US30 #DailyReview #DailyOutlook
In the over night sessions, price was the smoothest on the indices, as the price failed to take out the PDHs on SPX and US30. NAS tapped the PDH and traded above it only to move back into the previous day’s range. The #fomc meeting notes and Treasury Secretary Janet Yellen in the afternoon seems to have held up up for now. The #homesales numbers came in off projects:
10:00am
USD
Existing Home Sales
3.79M 3.90M 3.95M
The interest rates have dropped but this isn’t the time we’d typically see this number kicking up.
Each of the indices has traded into 4H+FVG and that implies that we could still move up from where we are. The PDL from yesterday is my SSL draw if we push to the downside and the PWHs are still my targets for an upside move.
#BullishCase As we have rest in this 4H+FVG on all 3 indexes, we’ll need to look for price to hold. As long as we don’t have an impulse to the downside through a PDL, we should be okay to still see a move from the FVG range. SPX and NAS, both have BSL as targets from the Closing session. But the targets, aside from this will be the the BSL, PDH and Was for all the Indices.
#BearishCase If we manage to trade through the PDL on each of the indices and we do so with an impulse this will change my view of the short-term/ midterm to look for a sell. This would imply that the 4H+FVG has been mitigated and we could potentially see that IFVG or inverse FVG setup play out.
For either situation patience and price action will lead the way!
All Charts 1H
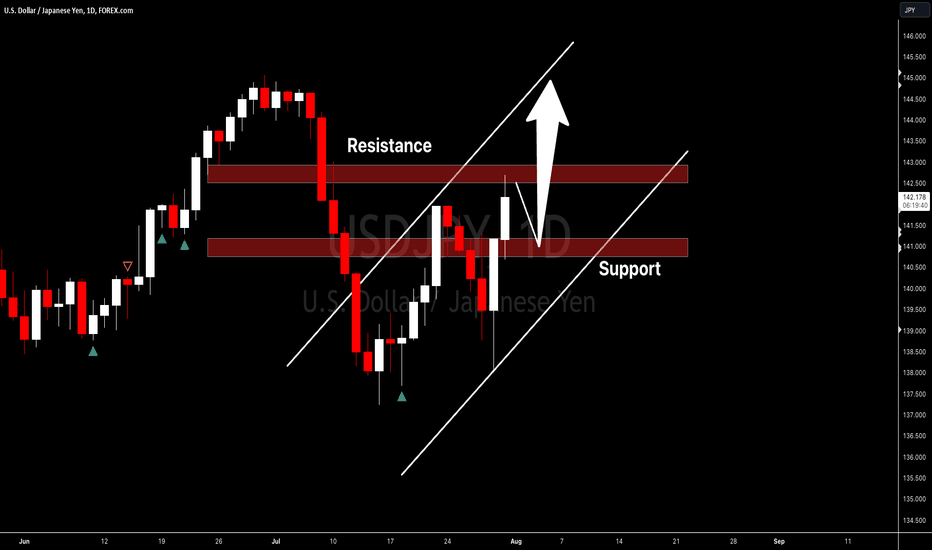
USDJPY I Daily forecast and execution planWelcome back! Let me know your thoughts in the comments!
** USDJPY Analysis - Listen to video!
We recommend that you keep this pair on your watchlist and enter when the entry criteria of your strategy is met.
Please support this idea with a LIKE and COMMENT if you find it useful and Click "Follow" on our profile if you'd like these trade ideas delivered straight to your email in the future.
Thanks for your continued support!
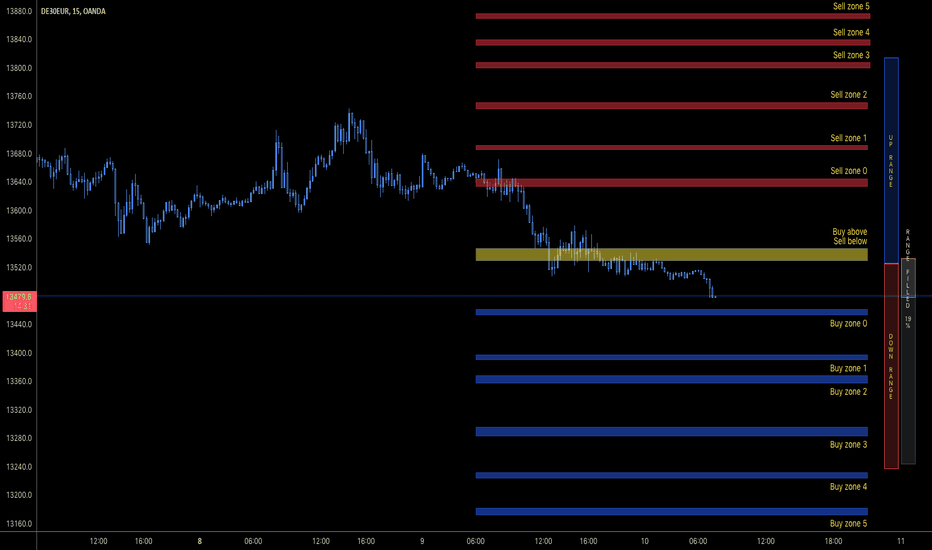
Daily analysis and trade setups on DAX Ger30 20220810Happy Midweek, Happy CPI Day,
As mentioned in yesterday's analysis, DAX not being able to hold above 13680 was ominous
Now a sustained move below 13440, break of 13300 will open it up to 12920. Will it happen today, we will see
It still has chance to gain back above 13680
13530 is the line in the sand today
Macro : DE HICP, US CPI
Buy
Break: 13550, 13630, 13685, 13740
Reversal: 13450, 13390, 13350, 13280, 13220
Sell
Break: 13460, 13400, 13370, 13300
Reversal: 13645, 13690, 13750, 13810, 13840
Green Goblin levels are here >>>
Fibonacci Confluence levels are here >>>
