USD/JPY - Daily OutlookUSD/JPY encounters strong support level
Contrary to expectations, the weekly S1 located at the 110.11 level proved to be a very strong support barrier.
Namely, it managed to neutralize multiple attempts of the currency exchange rate to slide downwards, including the 34-pip fall that happened in the middle of the day, under pressure from the 55-hour SMA. As soon as the pair made a fully-fledged rebound, it started to climb upstairs, crossing the above 55- and 100-hour SMAs.
Most likely, the surge will be stopped somewhere between the 111.00 – 111.20 levels, as they represent a location of the combined resistance level formed by the 200-hour SMA and the weekly PP.
On gradual decay of the upside momentum also point out certain technical indicators, suggesting that strength of the uptrend is coming to an end.
Dailyoutlook

GOLD Outlook Daily Chart Gold long positions is active, but approaching key zone levels.
Lets' see what will happen!!
Happy trading

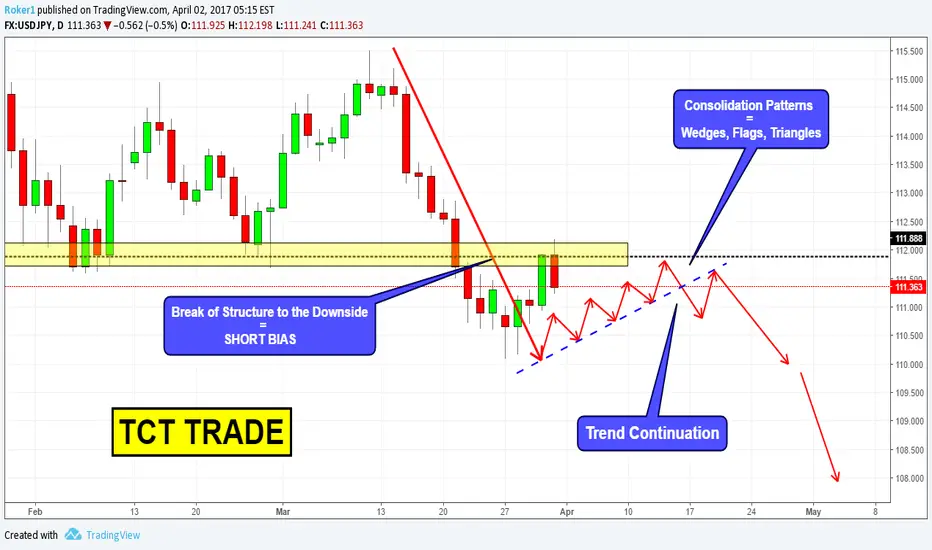
Daily Outlook on USDJPYHi guys,
today that markets are closed i thought i could share my outlook on USDJPY for the upcoming week: as you can see on the chart price has recently broke to the downside the previous support level, this means price is telling us it wants to go lower. Of course we shouldn't chase price, instead we should wait for it to come in our comfortable zones, like previous support that could turn into resistance.
While coming there, price could form a simple consolidation pattern (like a flag, traingle or wedge). A break to the downside of that pattern would mean a continuation to the downside, where we have actually a lot of space.
I'll update soon.
If you want to ask questions or share your view, go ahead and comment below.
Otherwise, see you in the next chart!
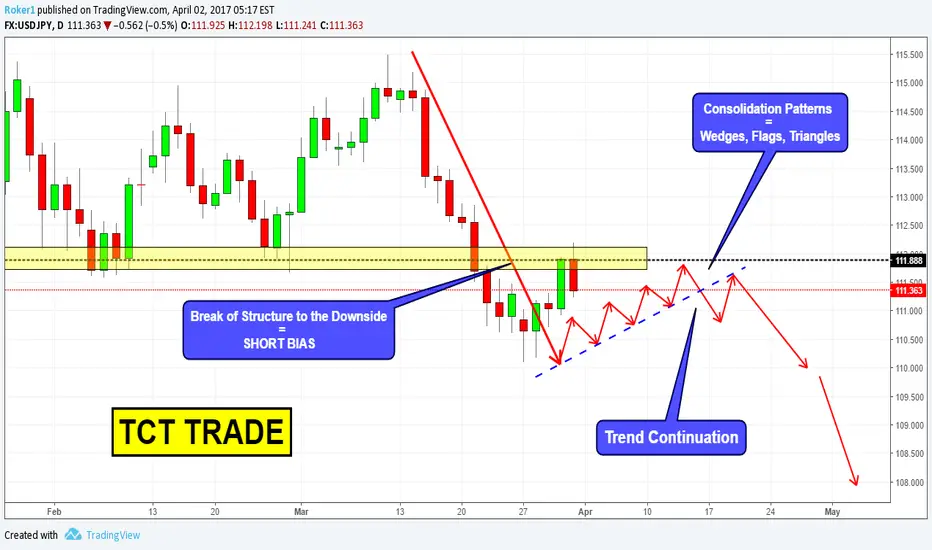
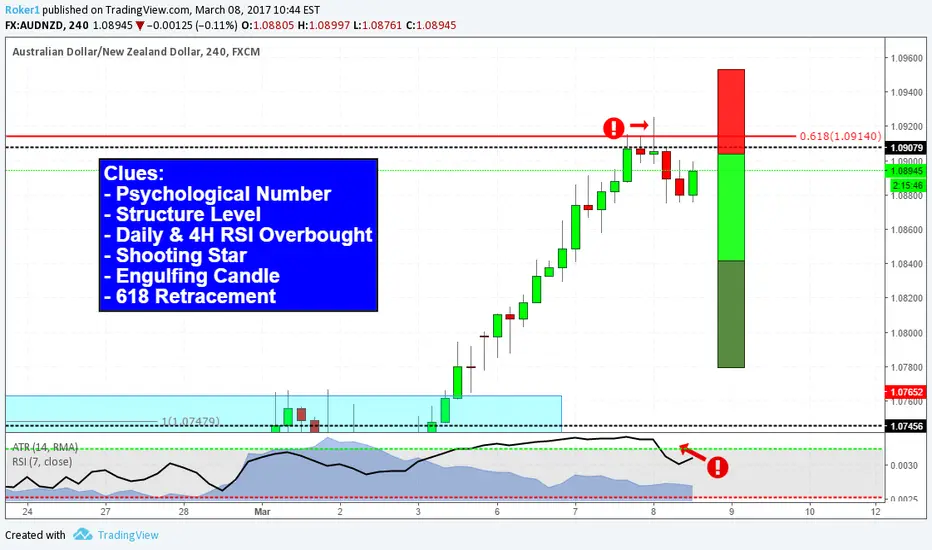
Bunch of different clues on AUDNZD!Hi guys,
i want to explain to you why i'm going to short this pair if price pulls back a little bit more. As you may know audnzd -0.12% has been moving upward without interruption: both in the daily and 4hr chart Rsi is in overbought condition, and this tells us that market is overextended and there's maybe some room to retrace and let the trend breath.
Obviously i don't trade based off of only RSI , but it gives me a good indication of what the market could do. In this case we have different clues pointing in the same direction.
First, we have structure at the black line level, together with a psychological threshold (1,0900): at this level you can see price has created a shooting star and then a nice engulfing candle.
Also, there's a 618 retracement of the bigger daily leg that happens to be right at this level.
With all those clues together i think there's no doubt.
I'm going to short at the 1,09 level, with stops above the highs, and target1 at a 1,25:1 RR. Target2 to be determined more accurately.
Good trading!
Feel free to comment below for any kind of questions or if you want to share your view.
Otherwise, see you in the next chart!
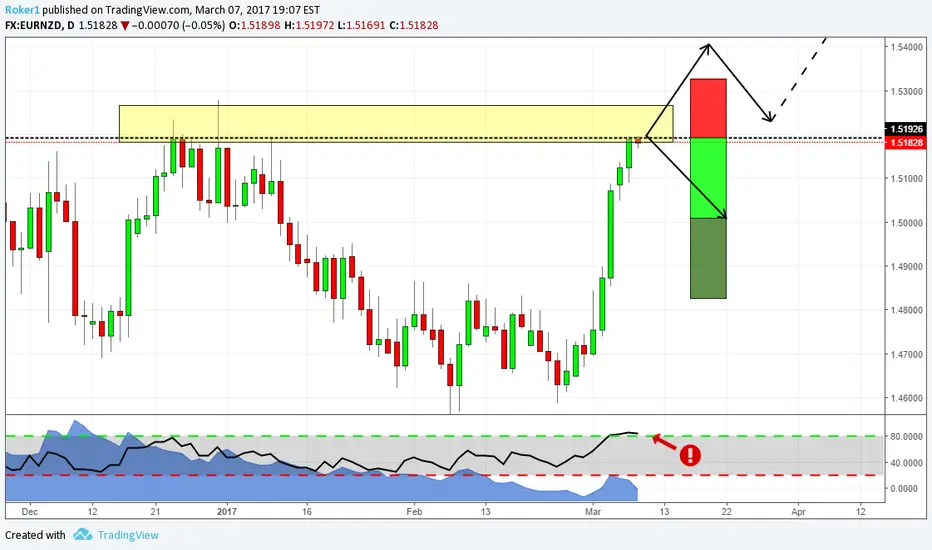
EURNZD has to decide where to go! Will it break or will it hold?Hi guys,
just wanted to let you know that i'm watching attentively to this pair, since price is testing a very important structure level that acted as support and resistance many times in the past.
As of now, i'm looking for weaknesses in order to short the market: notice that we're deeply in overbought condition and price is testing a psychological number (along with structure) so any other candlestick signal would make me sell at market.
Nonetheless we should be ready to change our mind if price breaks the structure yellow zone so that we can take advantage of both the situations.
Never be unprepared! Think ahead!
I'll keep you updated.
If you want to share your standpoint, feel free to comment below.
Otherwise, see you in the next chart!
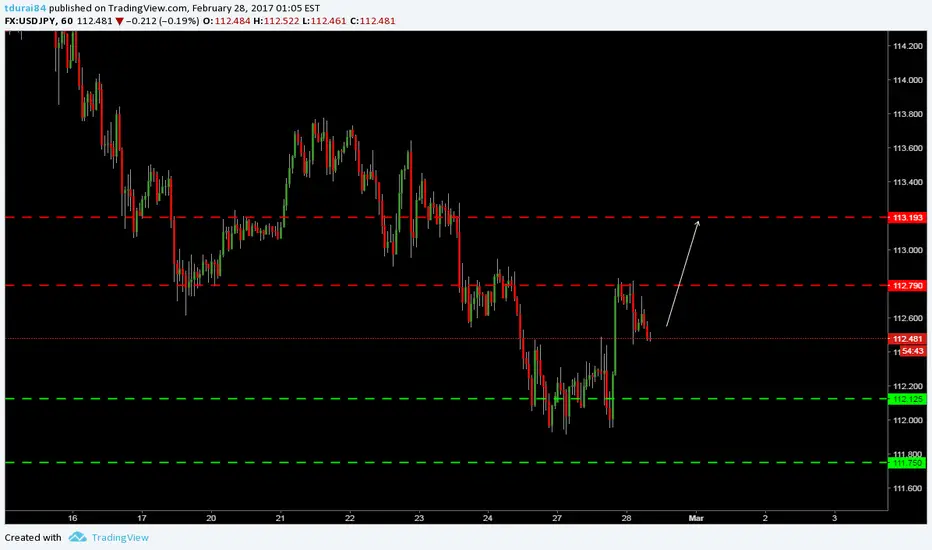
USDJPY DAILY OUTLOOKHi Everyone,
USD.JPY found some support from 112 psychological level on yesterday and gain nearly 80 PIPS on US session. Today also we can expect further DOLLAR strength USD.JPY move to 113.20 resistance level.
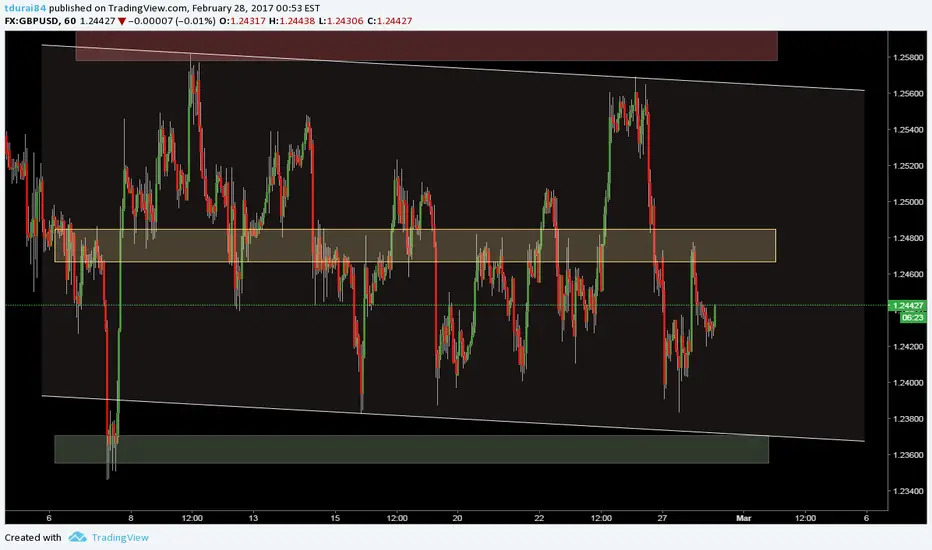
GBPUSD DAILY OUTLOOKHi Everyone,
Once again Psychological zone act as resistance to curb the advance of Pound on US session. I am looking for further weakness to 1.2370 - 1.2345 support zone
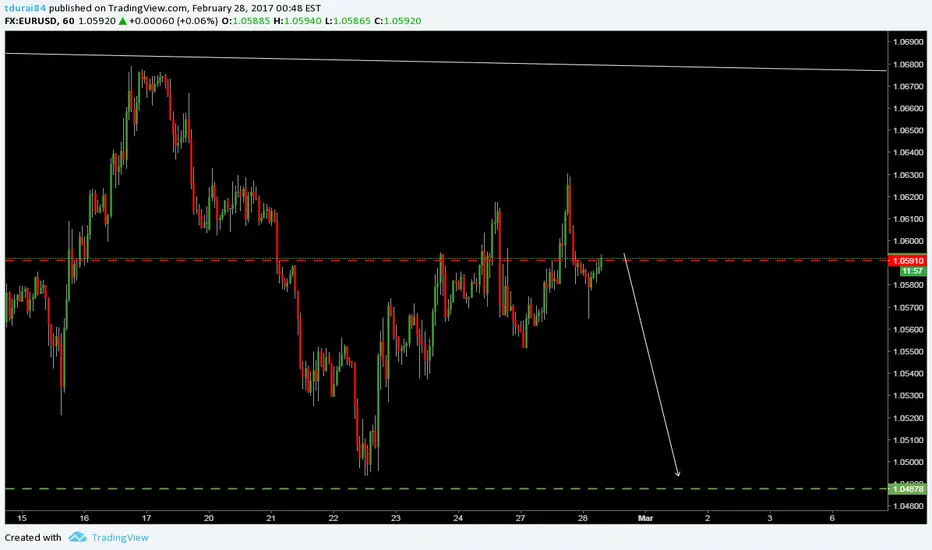
EURUSD DAILY OUTLOOKHi Every one,
EUR.USD trading on important resistance level, i am looking for further weakness to 1.0488 level.
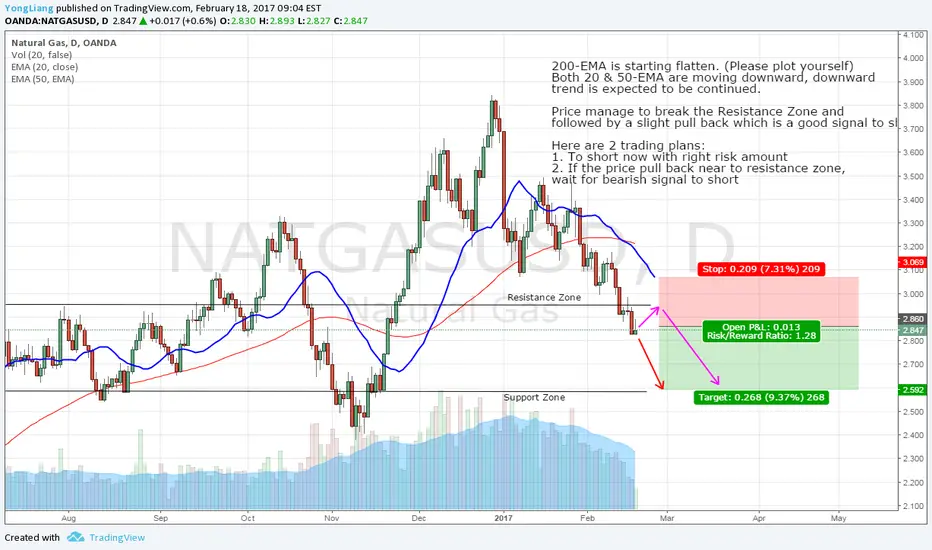
NATURAL GAS, DAY CHART, SHORT (18-FEB-2017)200-EMA is starting flatten. (Please plot yourself)
Both 20 & 50-EMA are moving downward, downward
trend is expected to be continued.
Price manage to break the Resistance Zone and
followed by a slight pull back which is a good signal to short
Here are 2 trading plans:
1. To short now with right risk amount
2. If the price pull back near to resistance zone,
wait for bearish signal to short
SUGAR, DAY CHART, SHORT (18-FEB-2017)There is a consolidation pattern near the
Resistance Zone.
From the price action, we can see stronger
selling pressure than buying pressure.
If the price managed to break the buyers' stop loss
level, we expect the price will fall further lower.
Here are 2 trading plans for you:
1. Wait the price to break the buyers' Stop Loss level
and entry
2. If the price pull back weakly to the resistance zone,
it might be a good opportunity to short with bearish
signal

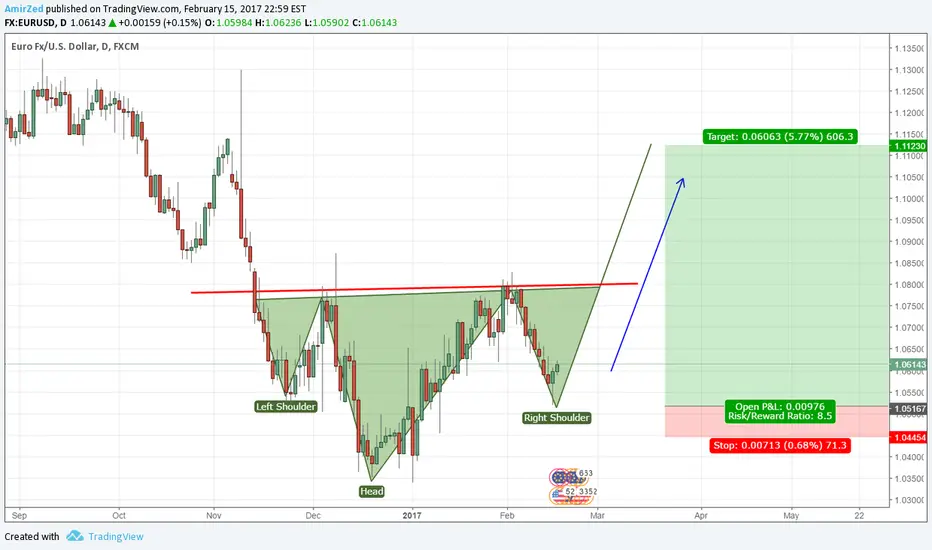
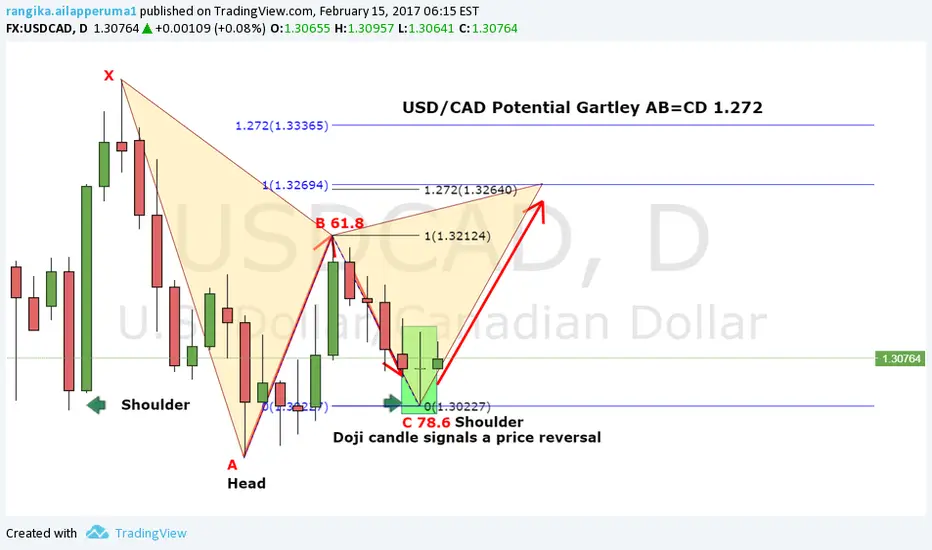
USD/CAD outlookDaily Doji candle shows a reversal to the price and the Head & Shoulder confirms the reversal. This is a great place enter a buy. Please check my entry signal
var tradingview_embed_options = {};
tradingview_embed_options.width = '640';
tradingview_embed_options.height = '400';
tradingview_embed_options.chart = 'JrzenL5z';
new TradingView.chart(tradingview_embed_options);
USD/CAD Gartley & Butterfly 15 minutes by rangika.ailapperuma1 on TradingView.com
The Gartley pattern shown here is to determin th targets of a buy and for future prediction that where price might go.
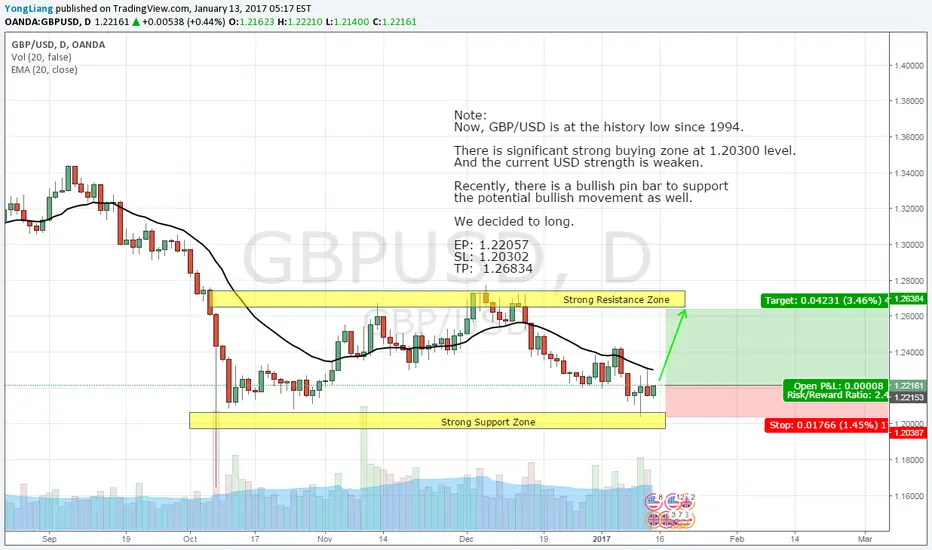
GBP/USD, LONG, DAY CHART (13-JAN-2017)Note:
Now, GBP/USD is at the history low since 1994.
There is significant strong buying zone at 1.20300 level.
And the current USD strength is weaken.
Recently, there is a bullish pin bar to support the potential bullish movement as well.
We decided to long.
EP: 1.22057
SL: 1.20302
TP: 1.26834
AUD/JPY, DAY CHART, SHORT (8-JAN-2017)Note:
AUD/JPY is reaching the strong resistance zone at
86.2x level.
There are 3 potential trading plans for this pair:
1. We expect the price will approach the resistance
zone at 86.2x level. If there are 1 strong bearish or
2-3 bearish signals, we will choose to short.
2. There is possibility that the price break the resistance
zone and reaching the previous peak at 86.9x level
before heading down. Need to watch this level.
3. If the price break both resistance level strongly,
we will support bullish view on this pair

EUR/USD, DAY CHART, SHORT (2-JAN-2017)Note: EUR/USD follows our prediction last week, a price
correction to the resistance zone is high likely to happen.
Overall, we remain bearish on this pair.
Now, there are 2 ways to trade this pair:
1. Wait for a bullish signal now near the 20-EMA and
resistance zone to short with right risk amount.
2. The price might further pullback to the next
resistance at 1.075x level. In this case, we also need
to wait for bearish signal to short.

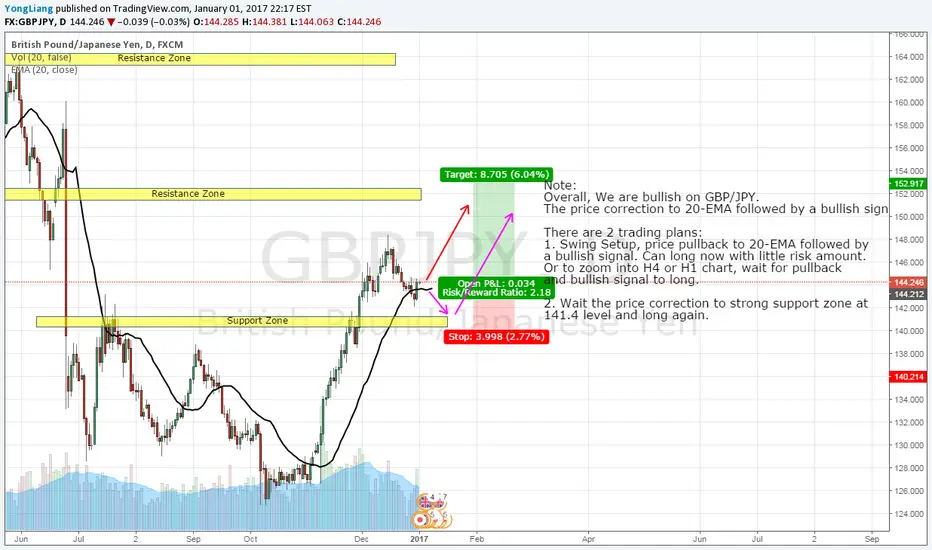
GBP/JPY, DAY CHART, LONG (2-JAN-2017)Note:
Overall, We are bullish on GBP/JPY.
The price correction to 20-EMA followed by a bullish signal.
There are 2 trading plans:
1. Swing Setup, price pullback to 20-EMA followed by
a bullish signal. Can long now with little risk amount.
Or to zoom into H4 or H1 chart, wait for pullback
and bullish signal to long.
2. Wait the price correction to strong support zone at
141.4 level and long again.
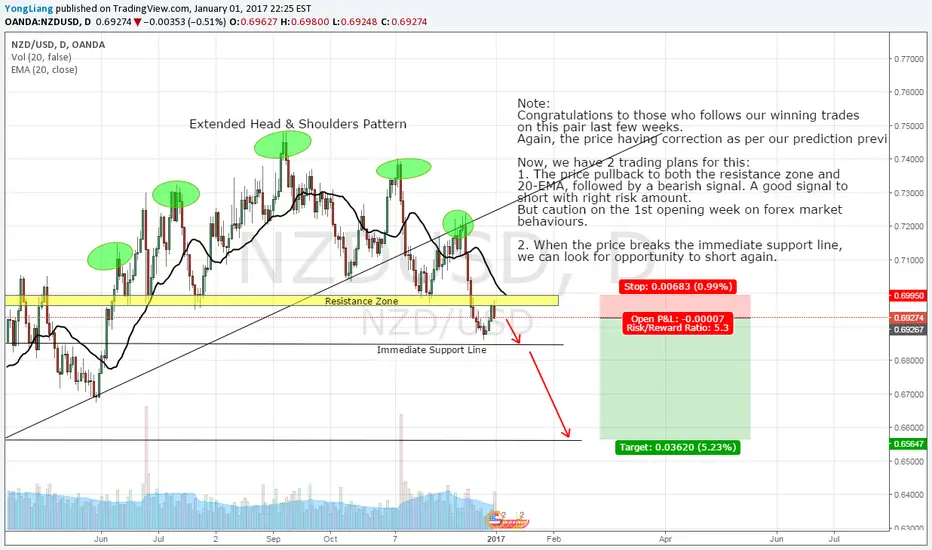
NZD/USD, DAY CHART, SHORT (2-JAN-2017)Note:
Congratulations to those who follows our winning trades
on this pair last few weeks.
Again, the price having correction as per our prediction previously.
Now, we have 2 trading plans for this:
1. The price pullback to both the resistance zone and
20-EMA, followed by a bearish signal. A good signal to
short with right risk amount.
But caution on the 1st opening week on forex market
behaviours.
2. When the price breaks the immediate support line,
we can look for opportunity to short again.
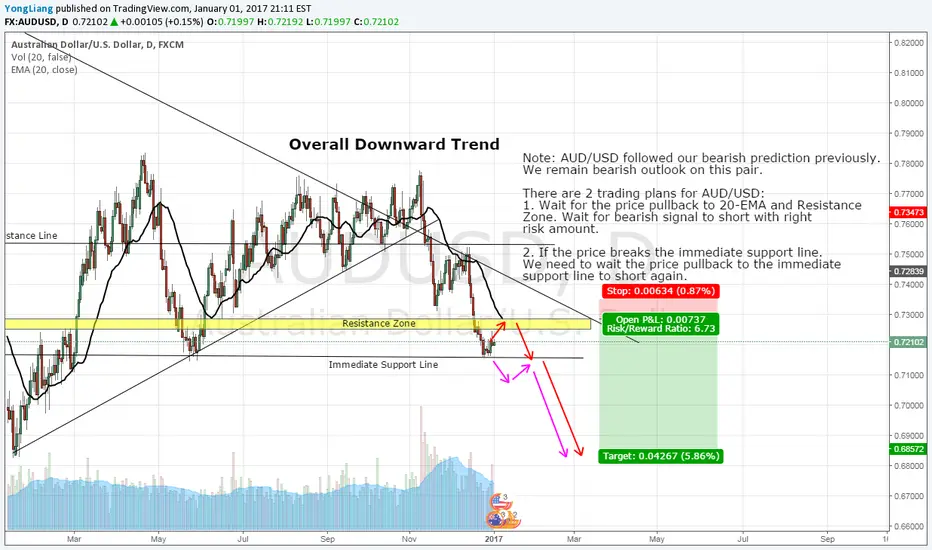
AUD/USD, SHORT, DAY CHART (2-JAN-2017)Note: AUD/USD followed our bearish prediction previously.
We remain bearish outlook on this pair.
There are 2 trading plans for AUD/USD:
1. Wait for the price pullback to 20-EMA and Resistance
Zone. Wait for bearish signal to short with right
risk amount.
2. If the price breaks the immediate support line.
We need to wait the price pullback to the immediate
support line to short again.
AUD/JPY, SHORT, DAY CHART (24-DEC-2016)Note: AUD/JPY didn't follow what we plan last week,
so we didn't trade this pair.
Now, we are bearish on this pair.
There are 3 trading plans for this trade:
1. Wait for price correction near the resistance zone
near 86.2x level, followed by a bearish signal to short.
We can short with right risk amount. But the chance
of the price correction to this level might be low.
2. Zoom into H4 or H1 to look for pullback to their respective 20-EMA, followed with bearish signal to
short with right risk amount.
3. Short now with little risk amount.

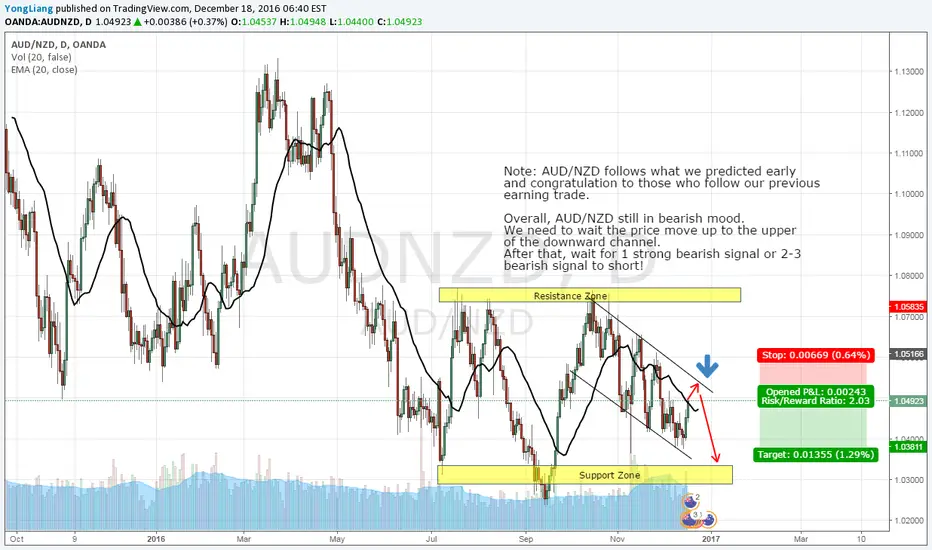
AUD/NZD, DAY CHART, SHORT (18-DEC-2016)Note: AUD/NZD follows what we predicted early
and congratulation to those who follow our previous
earning trade.
Overall, AUD/NZD still in bearish mood.
We need to wait the price move up to the upper
of the downward channel.
After that, wait for 1 strong bearish signal or 2-3
bearish signal to short!
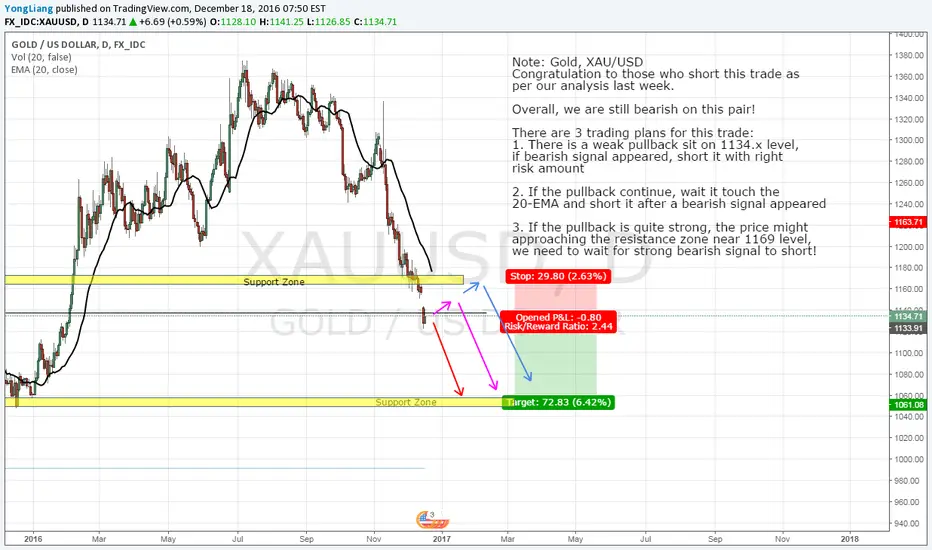
GOLD, XAU/USD, DAY CHART, SHORT (18-DEC-2016)Note: Gold, XAU/USD
Congratulation to those who short this trade as
per our analysis last week.
Overall, we are still bearish on this pair!
There are 3 trading plans for this trade:
1. There is a weak pullback sit on 1134.x level,
if bearish signal appeared, short it with right
risk amount
2. If the pullback continue, wait it touch the
20-EMA and short it after a bearish signal appeared
3. If the pullback is quite strong, the price might
approaching the resistance zone near 1169 level,
we need to wait for strong bearish signal to short!
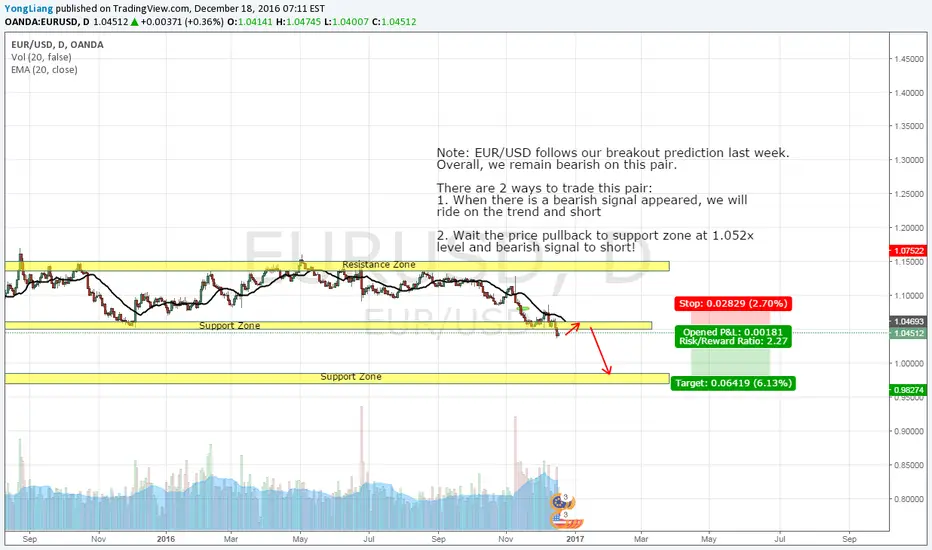
EUR/USD, DAY CHART, SHORT (18-DEC-2016)Note: EUR/USD follows our breakout prediction last week.
Overall, we remain bearish on this pair.
There are 2 ways to trade this pair:
1. When there is a bearish signal appeared, we will
ride on the trend and short
2. Wait the price pullback to support zone at 1.052x
level and bearish signal to short!