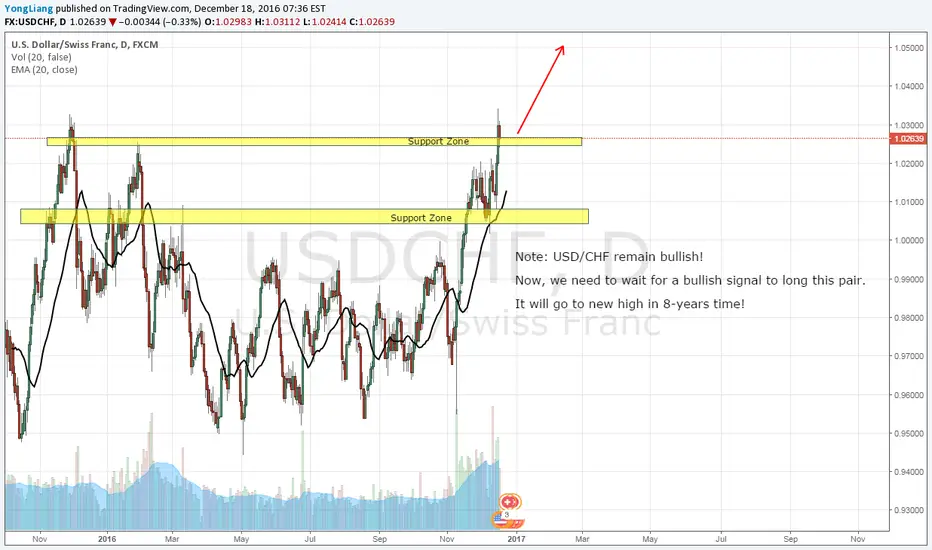
USD/CHF, DAY CHART, LONG (18-DEC-2016)Note: USD/CHF remain bullish!
Now, we need to wait for a bullish signal to long this pair.
It will go to new high in 8-years time!
Dailyoutlook
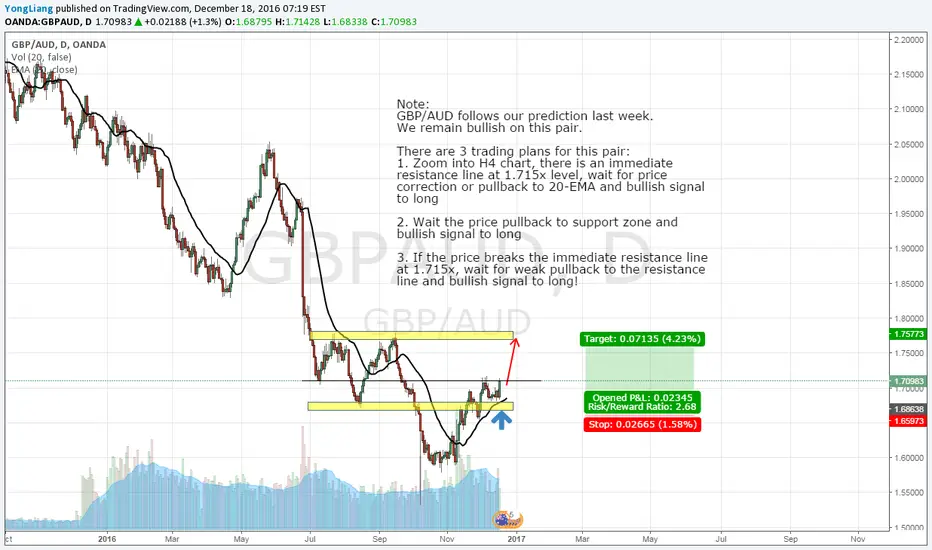
GBP/AUD, DAY CHART, LONG (18-DEC-2016)Note:
GBP/AUD follows our prediction last week.
We remain bullish on this pair.
There are 3 trading plans for this pair:
1. Zoom into H4 chart, there is an immediate
resistance line at 1.715x level, wait for price
correction or pullback to 20-EMA and bullish signal
to long
2. Wait the price pullback to support zone and
bullish signal to long
3. If the price breaks the immediate resistance line
at 1.715x, wait for weak pullback to the resistance
line and bullish signal to long!
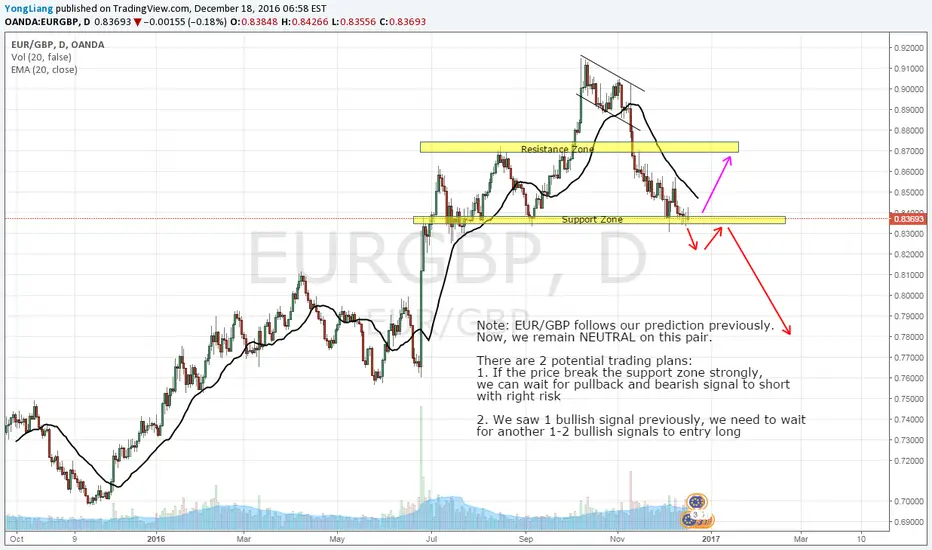
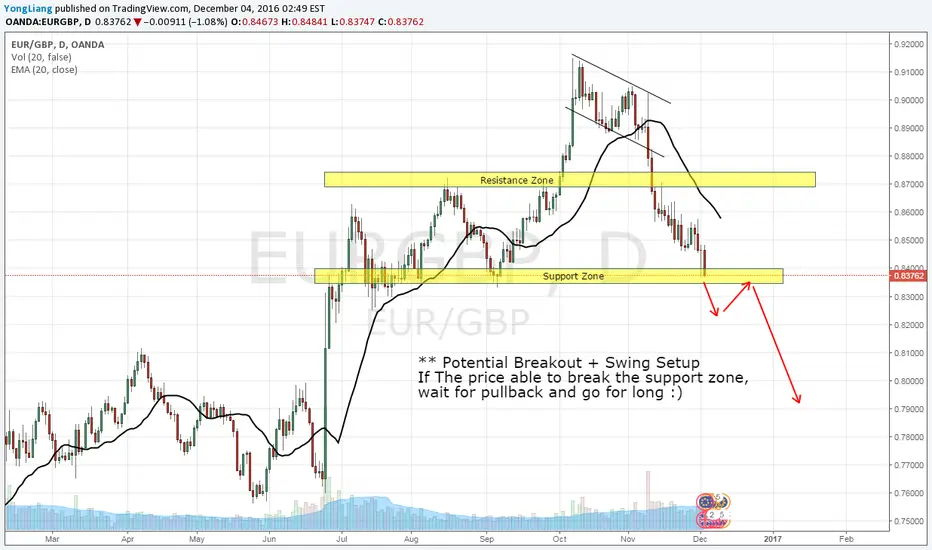
EUR/GBP, DAY CHART, NEUTRAL (18-DEC-2016)Note: EUR/GBP follows our prediction previously.
Now, we remain NEUTRAL on this pair.
There are 2 potential trading plans:
1. If the price break the support zone strongly,
we can wait for pullback and bearish signal to short
with right risk
2. We saw 1 bullish signal previously, we need to wait
for another 1-2 bullish signals to entry long
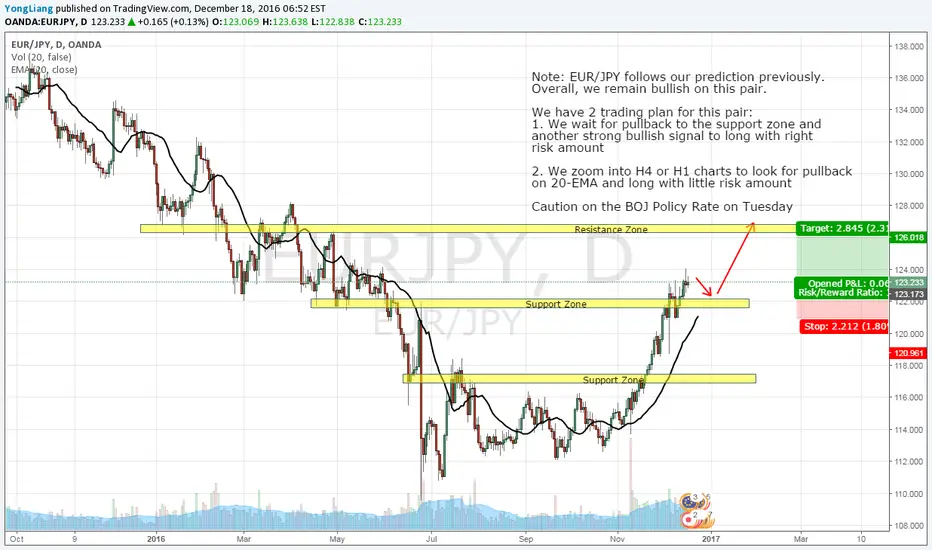
EUR/JPY, DAY CHART, LONG (18-DEC-2016)Note: EUR/JPY follows our prediction previously.
Overall, we remain bullish on this pair.
We have 2 trading plan for this pair:
1. We wait for pullback to the support zone and
another strong bullish signal to long with right
risk amount
2. We zoom into H4 or H1 charts to look for pullback
on 20-EMA and long with little risk amount
Caution on the BOJ Policy Rate on Tuesday
WTI CRUDE OIL, DAY CHART, LONG (11-DEC-2016)Crude Oil is trying its 2nd attempt to break the
resistance zone.
There are 3 possibilities here:
1. If it break the resistance zone, wait for PB
to the resistance zone and a bullish signal to long.
2. Eventually, it might form consolidation near
the resistance zone. If breakout, can directly long
3. If there are 2-3 "2 BARS REVERSAL" to trigger
the BEARISH movement, we will change our
view to short!
A Risk to Reward of 1:3 for this trade :)
Fundamentally, the crude oil price rally is due to the oil production cut by OPEC and potential cut from Russia and NON-OPEC Countries. The production cut might not able to reduce the current global stockpile significantly. It might be the reason to hold the crude oil price trading in the range!

USD/SGD, DAY CHART, LONG (9-DEC-2016)A good swing setup shows on USD/SGD Pair.
1. Overall trend is still bullish on USD
2. The price touched on 20-EMA and bounce back strongly from that,a good signal to long.
3. The price also bounce back from the support level at 1.416x
EP: 1.42417
SL: 1.41438
TP1: 1.43289
TP2: 1.44242

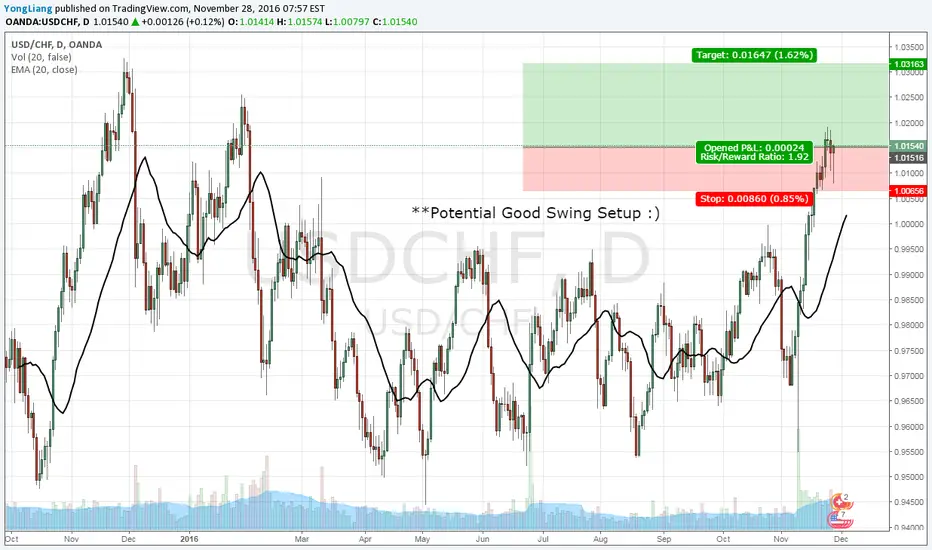
USD/CHF, DAY CHART, LONG (28-NOV-2016)A potential good swing setup.
After recent bullish trend, there is 1 pull back bar and followed by a bullish pin bar.
Good to entry with R/R of 1:2
EP: 1.01557
SL: 1.00646
TP: 1.03050
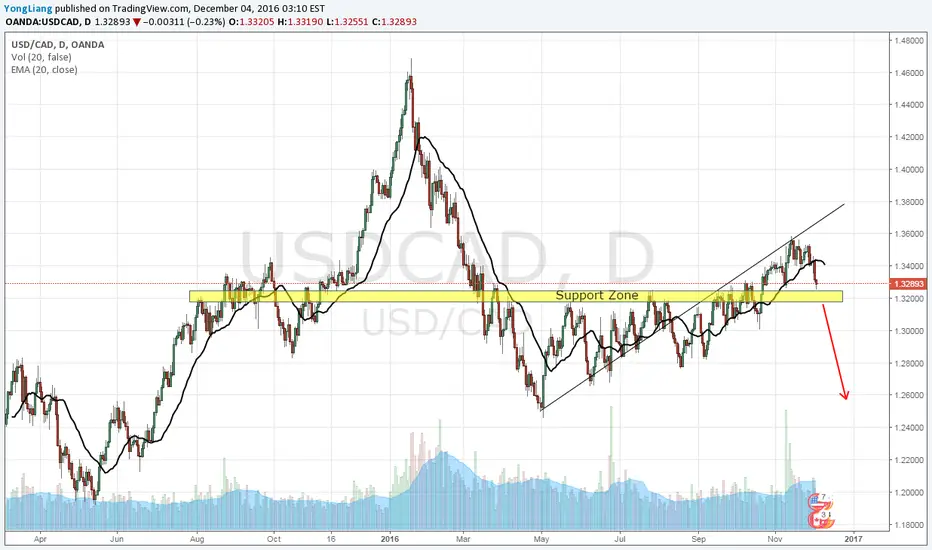
USD/CAD, DAY CHART, SHORT (4-DEC-2016)We see the price of crude oil spike last week due to OPEC decided to cut 1.2m crude oil daily production.
If the trend continues, we do see the strength of CAD.
Caution on the BOC Rate Statement on Wednesday which might influence the movement of this trade significantly.
Technically, if the price able to break the support zone, we will call a short for it!
EUR/GBP, DAY CHART, SHORT (4-DEC-2016)Our previous analysis on shorting EUR/GBP was correct.
Now, we need to pay attention to this support zone.
If the price manage to break the support zone with strong strength, wait for pullback and short for it :)
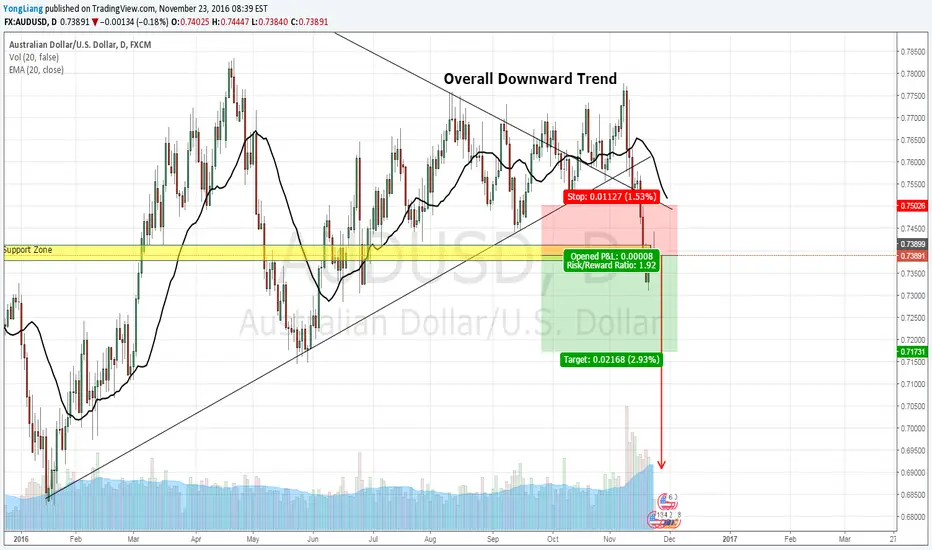
AUD/USD, DAY CHART, SHORT (23-NOV-2016)Overall Downward Trend.
After the price pull back 2 days, here we see a strong bearish bar as a good signal to short now.
EP: 0.73950
SL: 0.75049
TP: 71850
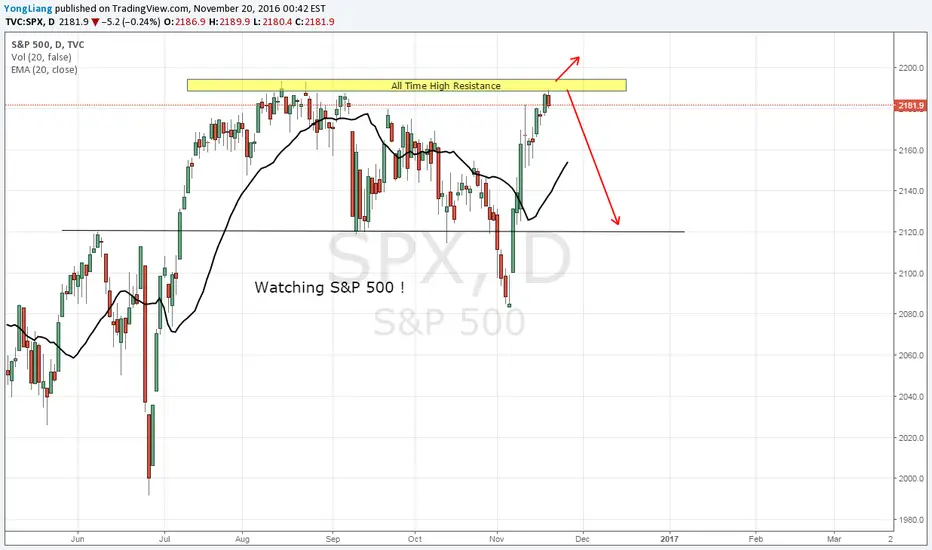
S&P 500, DAY CHART, NEUTRAL-SHORT (20-NOV-2016)S&P 500 is reaching its previous all-time high!
Monitor this index closely.
If it manages to break the Resistance Zone, we are bullish for it.
If there are few bearish signals appeared around resistance zone, we are bearish for it.
If shorting S&P 500, it will be a high risk to reward trade :)
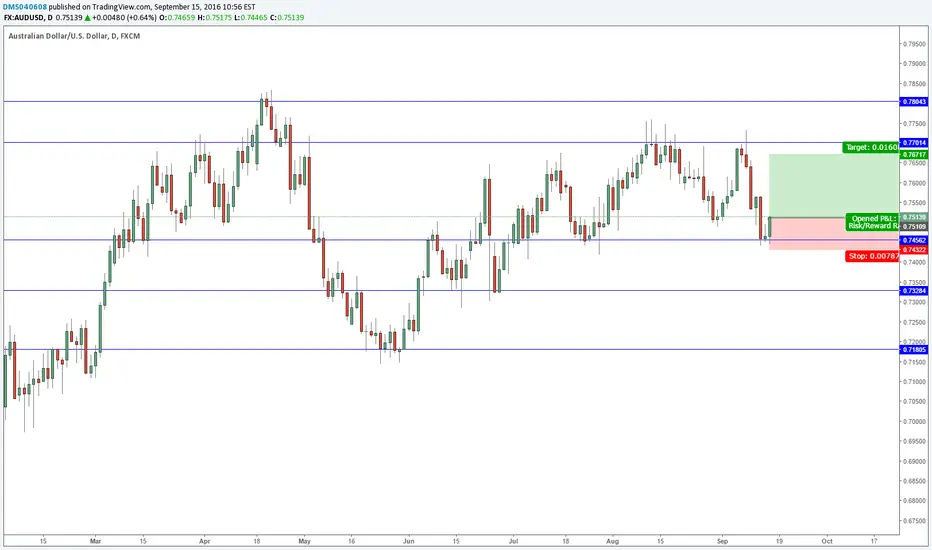
AUD/USD LONG? ENTRY@0.75110 STOP@0.74322 TARGET@0.76717Strong bounce can be seen around the 0.74500 area. Buyers have already made their move upwards, however, to consider this as a viable trade I would have to be sure that buyers are in control of price, and therefore for todays candle to close above yesterday's highs. In addition, be aware of the consumer price index report that may have a big impact on this trade.
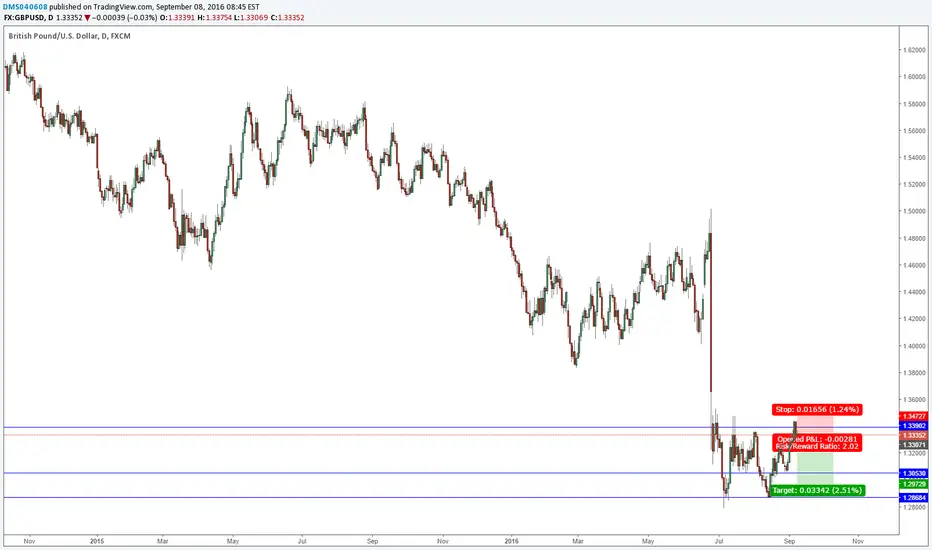
GBP/USD SHORT? ENTRY@1.33070 STOP@1.34720 TARGET@1.29729Strong rebound seen here on the daily chart. Before I look to enter this trade, I would have to be sure that sellers are in fact in control of price. Therefore I will keep an eye on the lower time frames to gauge confirmation, and look to enter on the daily time frame.
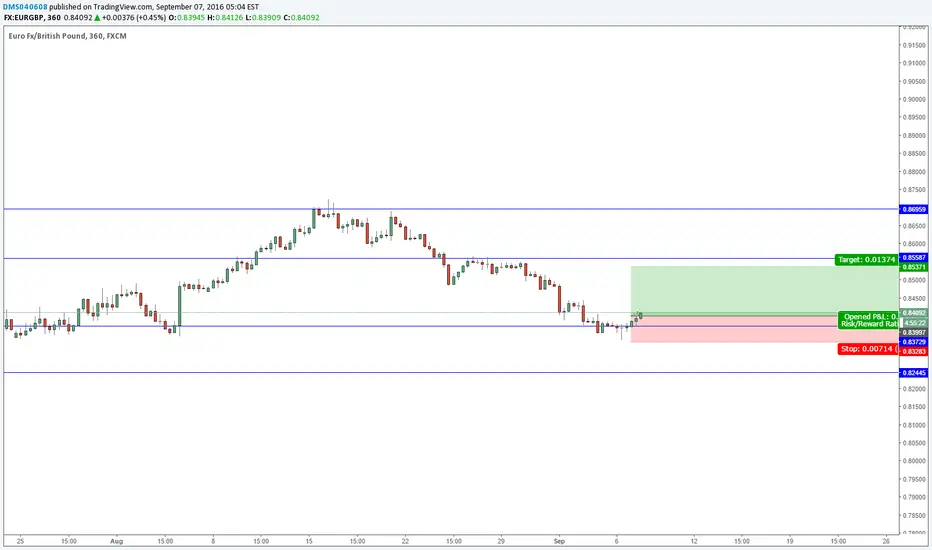
EUR/GBP POTENTIAL LONG? Entry@0.83997 Stop@0.83283 Target@0.8537A little bit late to the party as price has already pushed up passed my desired entry. However for me to still consider this a trade to take, price would have to retrace back down slightly to a more favoured entry to benefit my risk to reward ratio. In addition, if I were to enter toady it would likely be on one of the lower time frames, but if I were to enter on the daily chart then I would have to wait until tomorrow to ensure that buyers are in control of price (price opens higher than today's close).
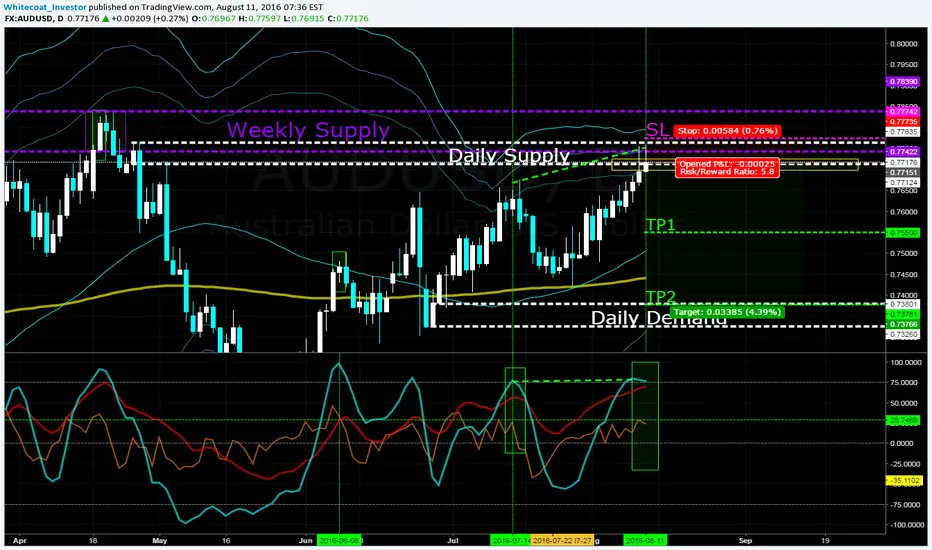
AUDUSD - Downside PotentialFX:AUDUSD is showing overbought on the Stoch and the Bollinger Bands, and has touched the daily and weekly supply levels twice. Good reward:risk ratios. 2:1 for TP1 and 4:1 trade for TP2.
Happy Trading
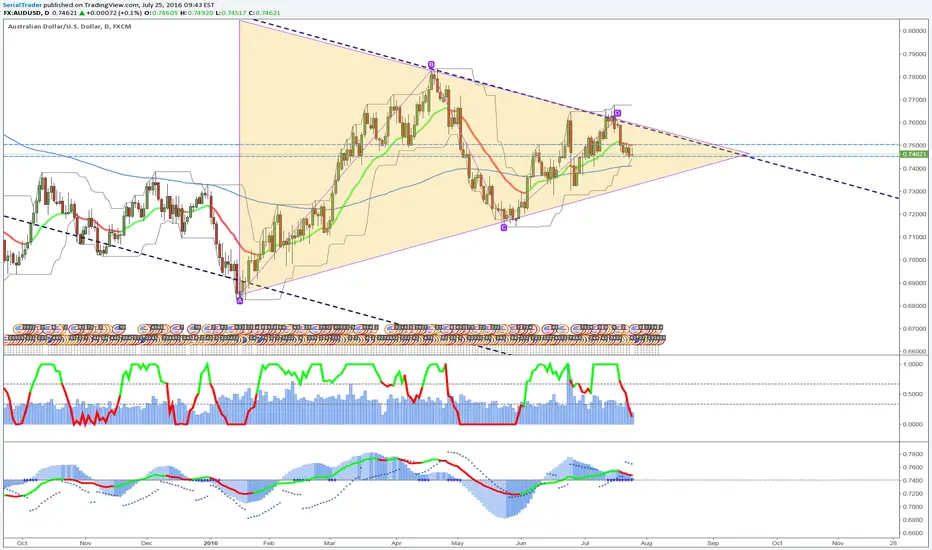
Long term outlook in the AUDUSD - Daily Chart
The price in the AUDUSD is inside a triangle pattern, and whatever be the direction that the price is going to go, the oportunity to trade this pair is huge because the position where the price is.
For the risky traders, to buy this pair it's recommended to wait until the price get close to the A-C line, just below the 144 EMA. But, you have to be cautious in case that the price break out that line in the bearish direction to change your strategy to the sell side. The other way in where you could buy this pair is waiting until the price break out the triangle in the B-D line.
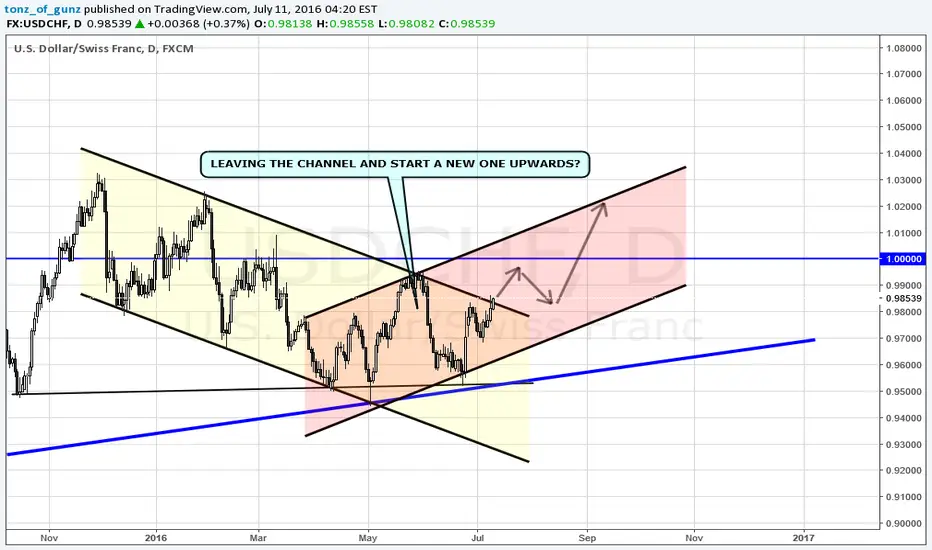
USDCHF MEDIUM TERM ANALYSISUSDCHF giving us signals that it wants to leave downward channel and maybe starting a new one upwards.
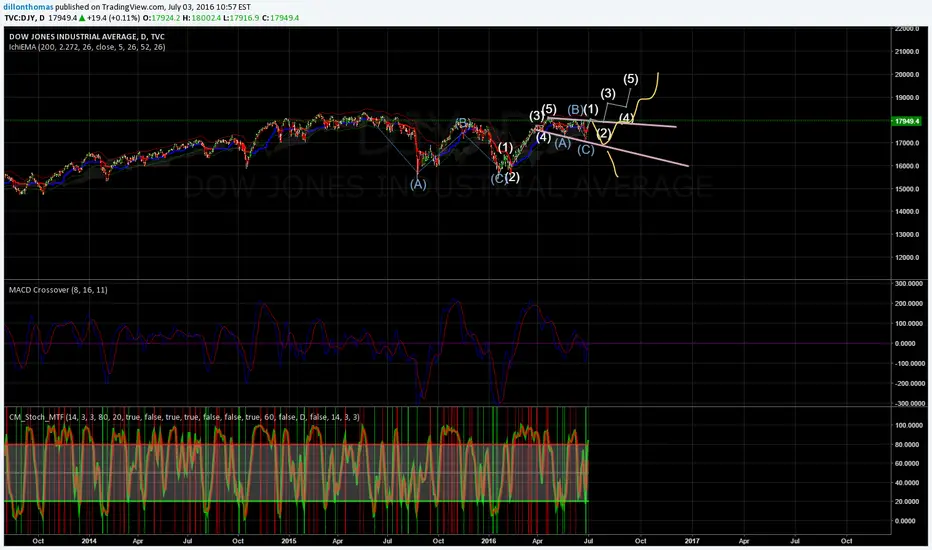
DJY - DOW JONES - Long - Daily After Break -DJY is about to break to the upside, unless a deeper correction starts.
Buy after break of consolidation
This might be the beginning of a 1-5 impulse to the upside, if it is not the correction may last longer for an ABCDE
or as part of a larger correction to the downside.
Short-Term Daily Look for a break to the upside to buy.
NZDUSD Daily Outlook + TCT+ Bat PatternNZDUSD has been in a downtrend on the Daily chart for a very long time. We may be in the middle of another retracement giving us a great opportunity short into strength. This will be a Huge trade and would require a 350 Pip Stoploss. But the Reward is over 1,200 Pips. This is an excellent opportunity for a Position Trader as it will take months to play out.
I have made a "Kill Zone" using a variety of technical patterns.
1. We have a Bat Pattern completion @ .7565
2. ABCD Pattern (just barely makes into my kill zone) completion @ .7414 along with the 78.6% Fib Retrace
3. 1.618% Ext - Pulled from lows to B leg of Bat Pattern. It has a nice confluence with the Bat Pattern
This will be a HIGH CTS (Combined Technical Score) trade IF market will push back up there.
Best of Luck!

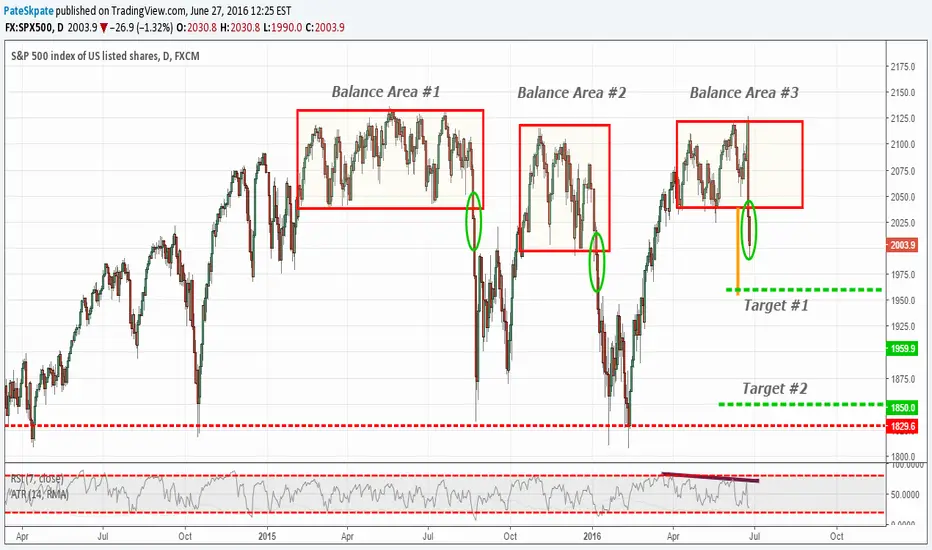
S&P 500 Daily Balance Area BreakdownEvery time the S&P has made a Balance area at it's all time highs it has sold off hard.
We just broke the most recent balance area to the downside again.. Looking for a bear run for quite some time. I fully expect market to revisit 1850's again, just given previous patterns.
Best of Luck
AUDUSD could retrace to 0.73/0.725 on a close below 0.7450Australia dollar is starting to retrace its gains after flirting with 0.750 resistance. A bearish close today below 0.745 could see the declines extending back to the price zone of 0.73 - 0.725. Establishing support here could pave way for a new leg in the rally back to 0.745 and eventually to 0.76.

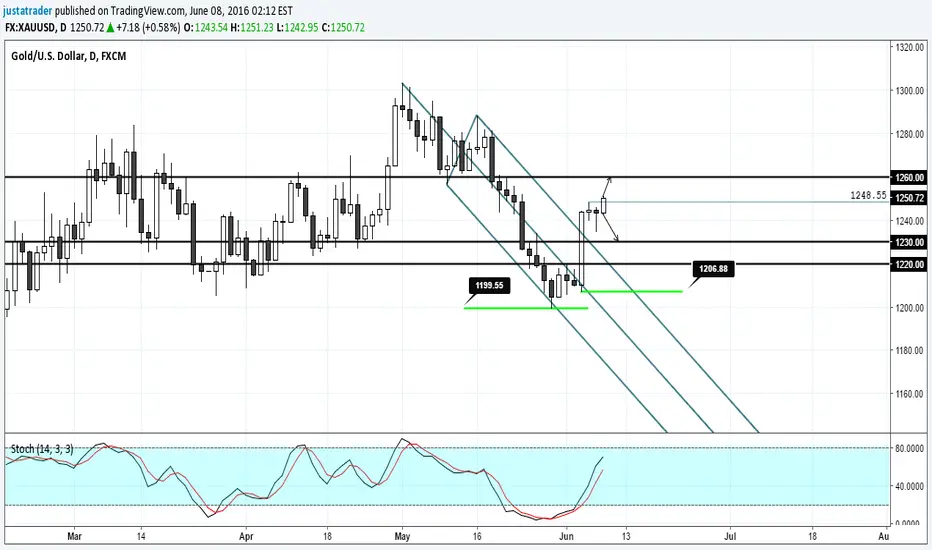
Gold inching higher. Daily close above 1248.55 could be keyAfter briefly testing sub 1200 levels last week, Gold quickly reversed its losses after Friday's NFP report. Monday/Tuesday was relatively flat but today's price action showing some early gains. Above 1248.55, 1260 remains the next key level to target.
But a pullback/correction is missing
To the downside, 1230 - 1220 levels could act as support. Forming a third consecutive low here (after 1199.55 and 1206.88) could signal a near term strength to the upside.
EURUSD formed an inside bar - Breakout in the making?After rallying strong on last Friday's NFP print, EURUSD has remained flat on Monday/Tuesday, forming an inside bar at the top end of the rally. A breakout is therefore likely to set the direction in the near term.
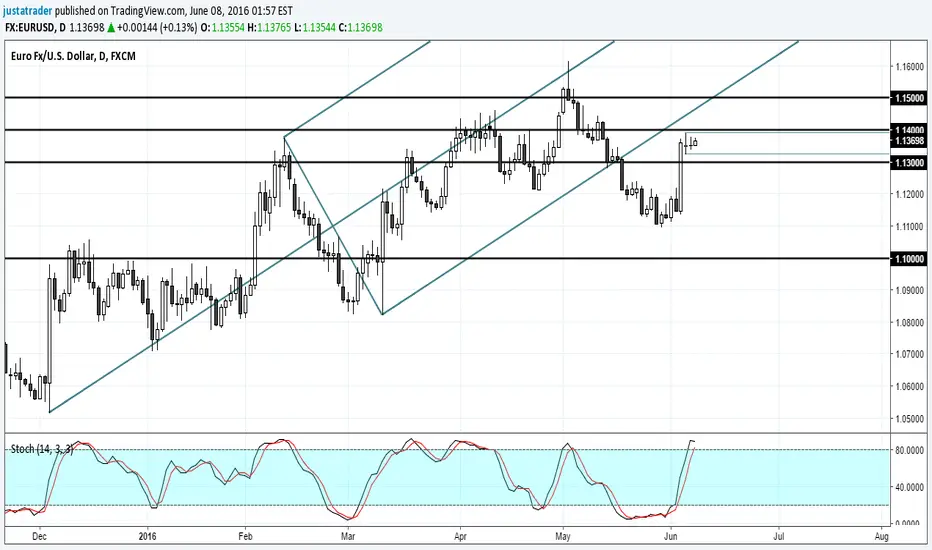
To the upside , 1.140 is the key level to watch, a break higher could extend gains above 1.140 but keep prices range bound below 1.15.
To the downside , 1.130 is the key level to watch out for which could see EURUSD slide towards 1.120 and to 1.10.
For you Fib fans, 1.1418 remains the 61.8% retracement level of the previous decline from 03/05 highs of 1.16163 and 30/05 lows of 1.10978.