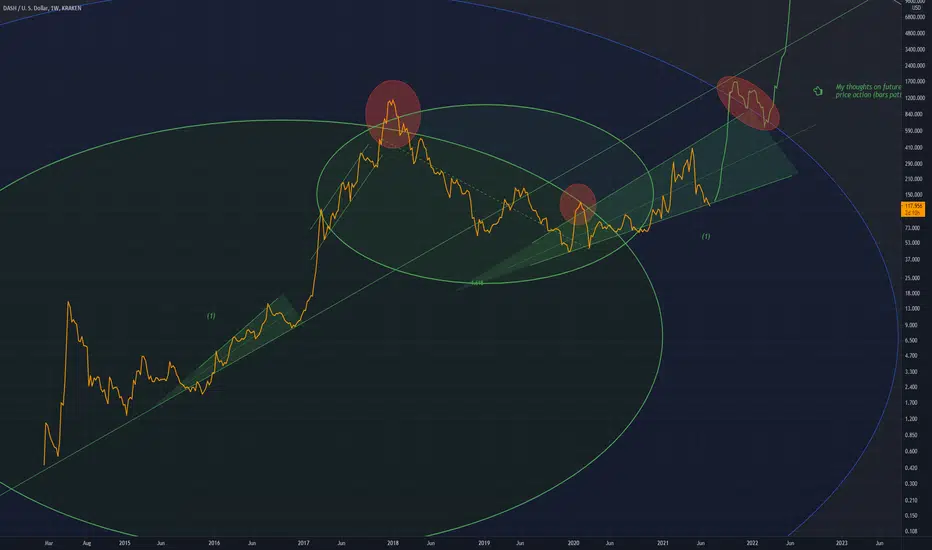
DASHUSD idea / outlookDash is currently under the major trendline,
yet is forming a similar pattern (1)
I believe price will come up and sit above 2.618 (just below the major trendline)
And then smash through the trendline (as indicated by the bars pattern)
Dash
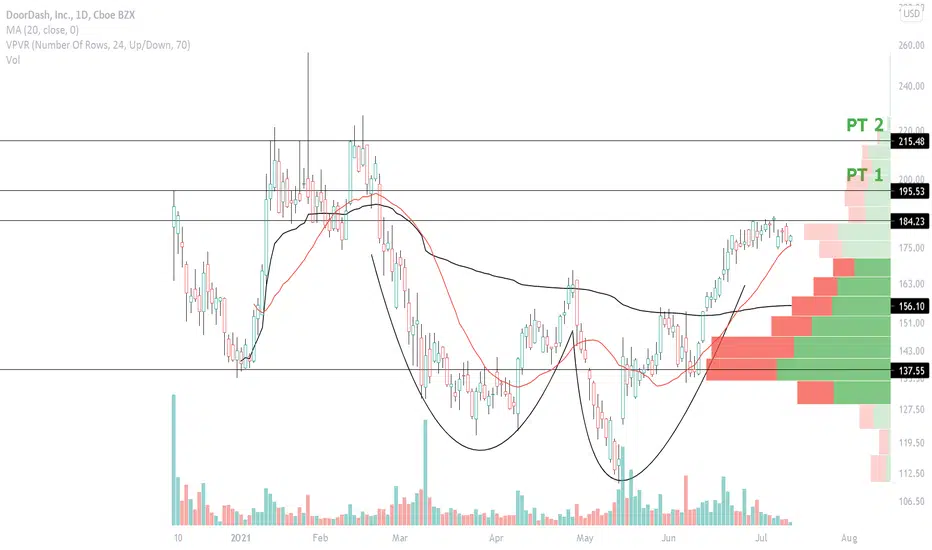
DASH Long U/RTook DASH 200 Calls for 8/20 off of a U/R setup on the daily and the tightening above the 20 MA (red line). Targets are indicated by the black lines with PT 1 and PT 2. Earnings are on August 12, 2021. Volume has been decreasing nicely on this topside consolidation. The weekly also paints a textbook cup and handle.
🌪 🌪 Dash/USDT Good time to buy and holdJUST BUY AND HOLD THIS TIME.
The Ichimoku clouds is forming a cloud similar to the previous wave, price is very close to the support line and prices are still in the 0.618 zone.
Target 264$ and 299$ and 333$
Anything that doesn't make sense, please give me a comment. Please motivate me to develop myself and help someone needed.
Don't forget click like, it's a hug for me. Thanks you!

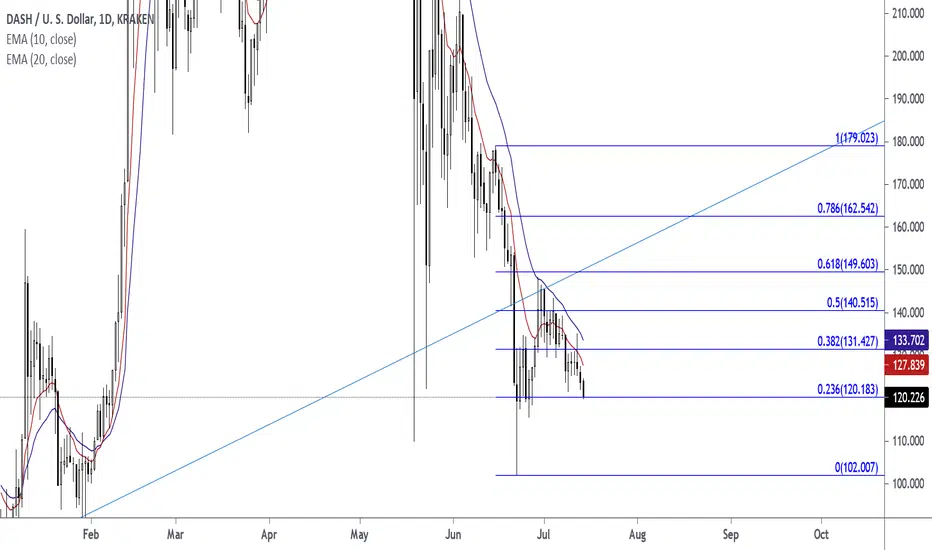
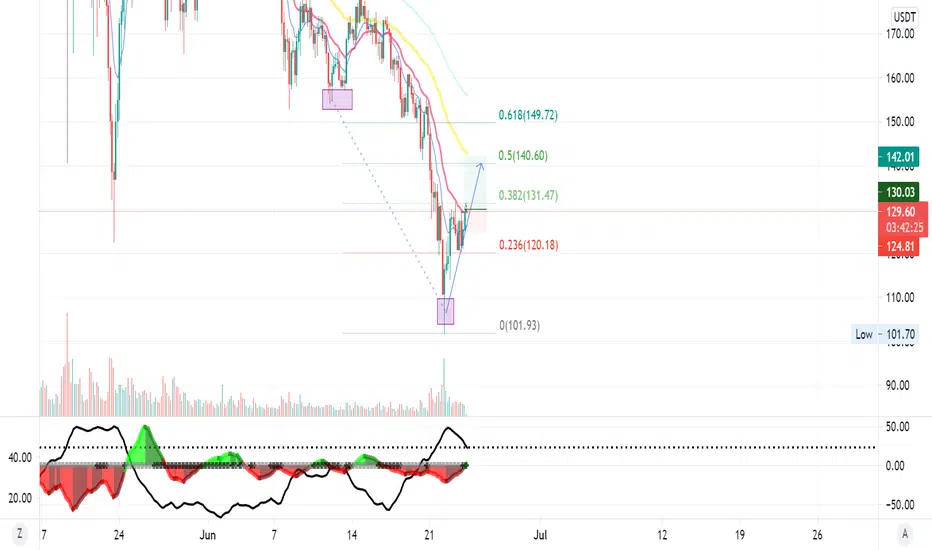
DASHUSD Entry Price Fibonacci Retracement 38.2% (Price 131.427)DASHUSD Target Price 110.000
Confluence and Entry Area
Close Price 126.977
EMA 10 Close Price 130.819
EMA 20 Close Price 136.319
Fibonacci Retracement Level 38.2% (Price 131.427)
July 12, 2021
ECT paving the way for DASH to $5600 I love finding leaders and lagers and this seems like a perfect example. Its easy to see the similarities in these charts- they're not exactly the same but wow are they close. The last time I noticed something like this BTC had just hit 20k while ETH was still at $500 (see below). Just like BTC was leading the way then; it looks like ECT might be leading DASH (& others) now. The ball's in your court.
There are a few way to tackle this trade;
Entry 1: here $125 - $131
Stop 1: tight $124.5 or loose $120 depending on how aggressive you want to be
Entry 2: on retest of breakout
Stop 2: below the retest pivot
Entry 3: on a test of the lower trend line
Stop 3: below the pivot at the trend line or on the break and close below trend line
Entry 4: on retest of breakout
Stop 4: below the retest pivot
Target for all of the above at your own discretion. I'm treating this as an entry for a longer term position; so I'm holding it for much higher prices.
Trade ideas:
BTC leading ETH:
Never Trust. Verify.
D.Y.O.R . Not Financial Advice, this is my trading journal.
Always remember: Technical Analysis is not about being right, it's about increasing your odds.
Be prepared to be wrong. Risk management is key . Capital preservation above all else.

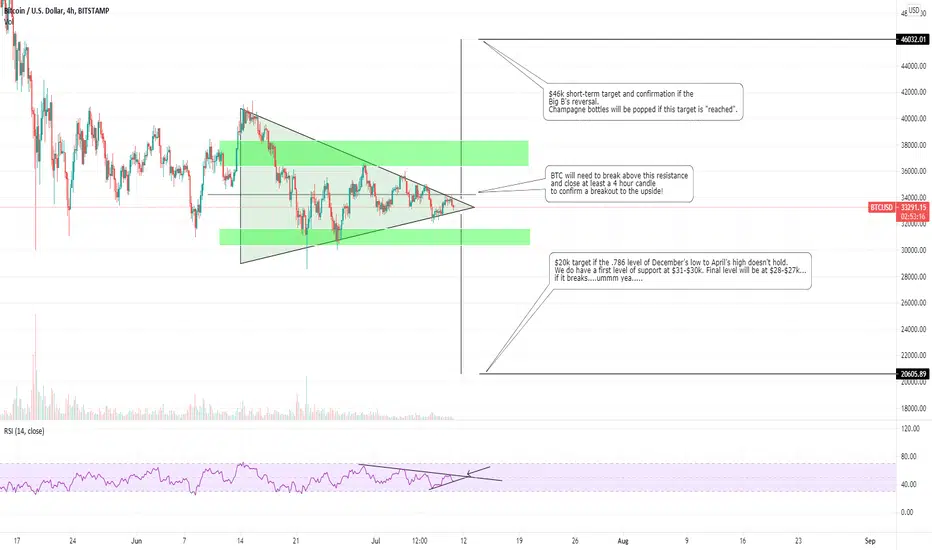
THE MOMENT WE'VE BEEN WAITING FOR??BTC is trading in a decent side symmetrical triangle. This pattern is not bearish nor is it bullish, it can go either way ladies and gents. So I will stay neutral until conformation. As you can see, a break out is imminent! PRESSURE BREAKS PIPES AND THE PRESSURE IS ON THE CHARTS! I believe it will occur no later then the 13th of July and this breakout will be the moment of truth. A huge dip can occur before breaking up....this is what I call a "fake out" or shaking out weak hands lol...the same goes for the upside. Volume and breaking/closing above resistance or below support will confirm the direction that SIR BITCOIN will choose. This story is far from over in my opinion. So buckle up ladies and gents! This one will be a ride.
Disclaimer: I'm NOT a financial adviser...just a regular "joe" voicing my opinion :)
Peace Love Money ;)
DASHGood ole boring DASH tested support $121 multiple times, trying to count the V complex EW ABC WXY count seems kinda a watse of time, I am just going to my TA roots here to see that soon we test $145 resistance, from there we should get an impulsive count 12345 IMO


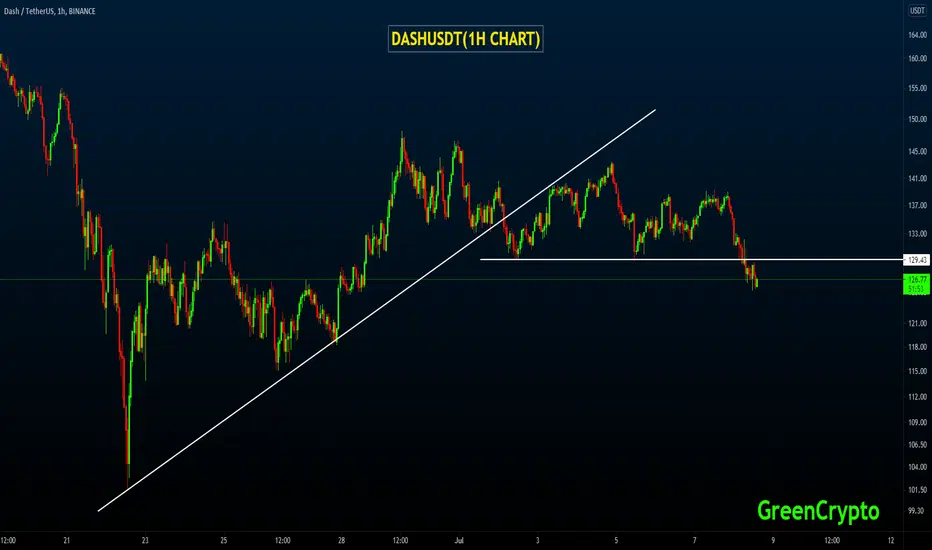
DASHUSDT Suppport BreakoutDASHUSDT(1H CHART) Technical Analysis Update
Support Breakout
DASHUSDT(1H CHART) currently trading at $126.50
Short Entry : $129.00 - $126.00
Stop loss: Above $133.00
Target 1: $119.00
Target 2: $115.00
Target 3: $108.00
Max Leverage: 3X
ALWAYS KEEP STOP LOSS...
Follow Our Tradingview Account for More Technical Analysis Updates, | Like, Share and Comment Your thoughts.
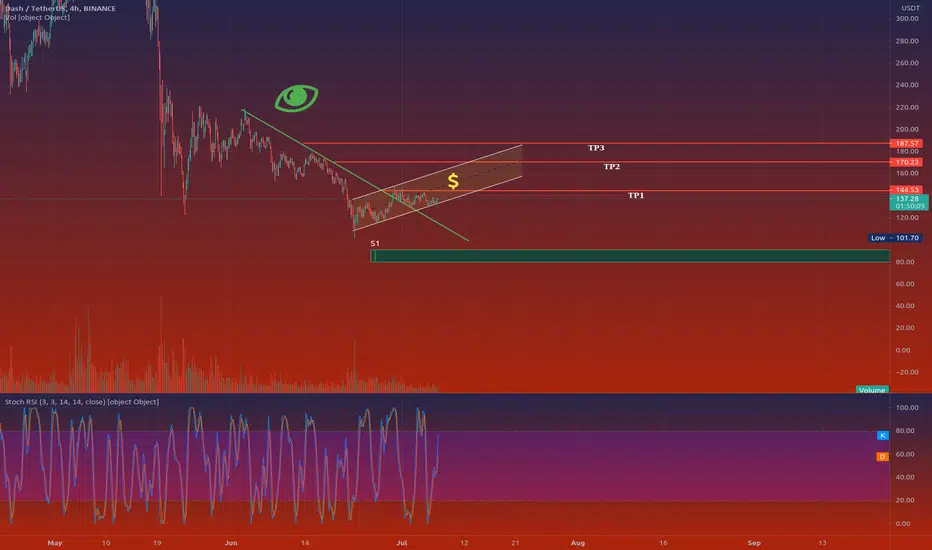
DASHUSDTHello to you all. Mars Signals team wishes you high profits at all times.
We are in a 4 hour time frame. The price has been able to break its resistance and is moving inside the ascending channel. At the moment, the price is at the bottom of the channel. We can buy for the above purposes. In case of loss of the canal floor, there is a possibility of price correction. We have identified support and resistance for you.
Warning: This is just a suggestion to you and we do not guarantee profits.
Wish you luck!
🆓Dash (DASH) July-6 #DASH $DASHDASH has just been rejected from the $140 zone so it will head towards the $120 or even $90 zone, where DASH will definitely approach in the future. However, if there is a strong and unexpected buying force that helps DASH regain the $140 zone, DASH will surge to the $190 zone
📈BUY
🔴Buy : 117-123$ if A. SL if B
🔴Buy : 137-143$ if A. SL if B
📉SELL
🔴Sell : 137-143$. SL if A
🔴Sell : 186-194$. SL if A
♻️BACK-UP
🔵Buy : 137-143$ if A. SL if B
🔵Sell : 186-194$. SL if A
🔵Sell : 117-123$ if B. SL if A
🔵Buy : 88-92$. SL if B
❓Details
🕯Timeframe : 1 Day
📈Red Arrow : Main Direction as BUY and SELL section
📉Blue Arrow : Back-Up Direction as BACK-UP section
🟩Green zone : Support zone as BUY section
🟥Red zone : Resistance zone as SELL section
🅰️A : The Close price of candlestick is Above the zone
🅱️B : The Close price of candlestick is Below the zone

Checking in on an old draw, from the depths the old Bear MarketWOW
Look at how we hit the 3.618 Fib Extension!
I'm not an OG Bitcoiner, but became aware of it early maybe in 2012
started doing my research on BTC in 2016 after noticing it was still alive and kicking
and the chart started to look real interesting to me in the mid $400's
and started invested and learning in 2017
we've come a long way since
many inroads & milestone have been made in that time
Now is the s curve adoption phase everything is in place for some unimaginable prices!
(not saying we wont expereince luls, dips, & "crashes" but from what heights!)

Dash to $200 this week Sideways consolidation is set for a big move to the upside. I see dash usually increases all at once.

ALT Coins Close to Large Bounce MartyBoots here. I have been trading for 14 - 15 years and I am here to share my ideas with you to help the Crypto space.
If ALTs can hold this Level we should see a large bounce
------------------------------------------------------------------------------------------------------------------------------------------------------------
If you want help trading Bitcoin or any other ALT coins hit me up , We will improve your trading . Have a look at the link below
----------------------------------------------------------------------------------------------------------------------------------------------------------

BTCDH&S pattern forming on the hourly TF, all we need is the break of that neckline a retest and we should hit W3 stride


Dash coin has formed a bullish BAT for upto 51.5% bullish moveHey dear friends, hope you are well, and welcome to the new update on Dash coin.
On the monthly time frame chart, the price action has formed a big Cypher pattern .
At the same time on the daily time frame chart, the price action of the Dash coin has formed a bullish BAT and just entered the buying zone.

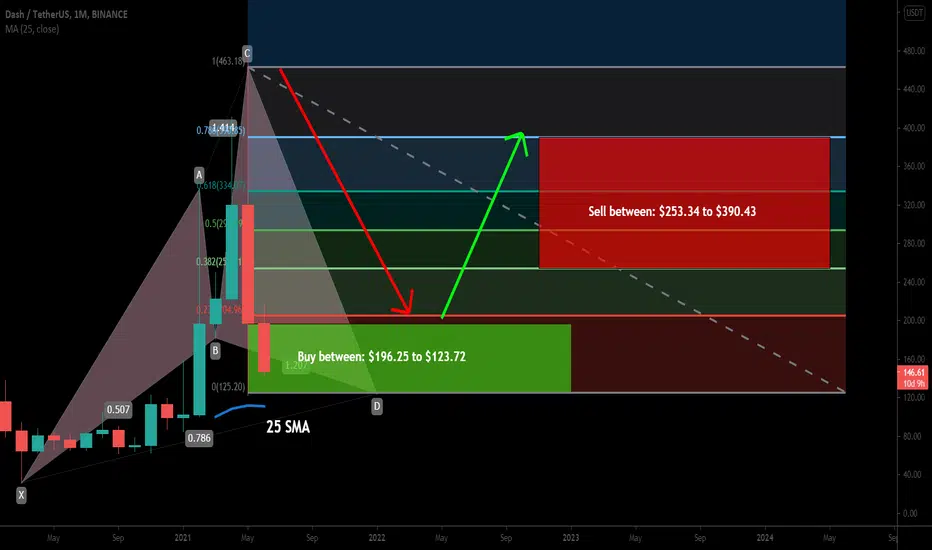
Dash coin has formed a huge Cypher for upto 215% bullish moveHI dear friends, hope you are well and welcome to the new update on Dash coin.
Previously we had a nice trade of the DASH coin when it formed a bullish BAT.
Now on the long-term monthly time frame chart, the price action of Dash has formed a big bullish Cypher pattern. There is also 25 simple moving average support below the buying zone.
Buy and sell targets:
Buy between: $196.25 to $123.72
Sell between: $253.34 to $390.43
Stop loss:
The maximum extent of potential reversal zone $123.72 can be used as stop loss.
Possible profit and loss ratio:
As per the above targets, this trade has a big profit possibility of 215%, and the high loss possibility is 37%, however at this time the risk is low as the price action is already close to the end of the buying zone.
Note: Above idea is for educational purpose only. It is advised to diversify and strictly follow the stop loss, and don't get stuck with trade.
Dash is in it's support areaThe price is now in the support zone.✔️
In 4h timeframe, stochastic is in buying area.
S.L=148$❗
Resistance zone is around 178-181$🔱

🔥 DASH Bullish Triangle ContinuationOver the last couple of days, DASH has been forming a bullish triangle. Helped by the overall bullishness of BTC, alts (especially bigger ones) are seeing some nice returns. After yesterday's mini correction, DASH has yet again bounced from the triangle support, confirming the pattern further.
BTC is a little bit on edge at the moment, so I'm not expecting a full fledged break out just yet. For the moment I'm expecting DASH to follow the triangle, breaking out of it at a later point in time.
When trading alts, always keep an eye on BTC.
Happy trading!
