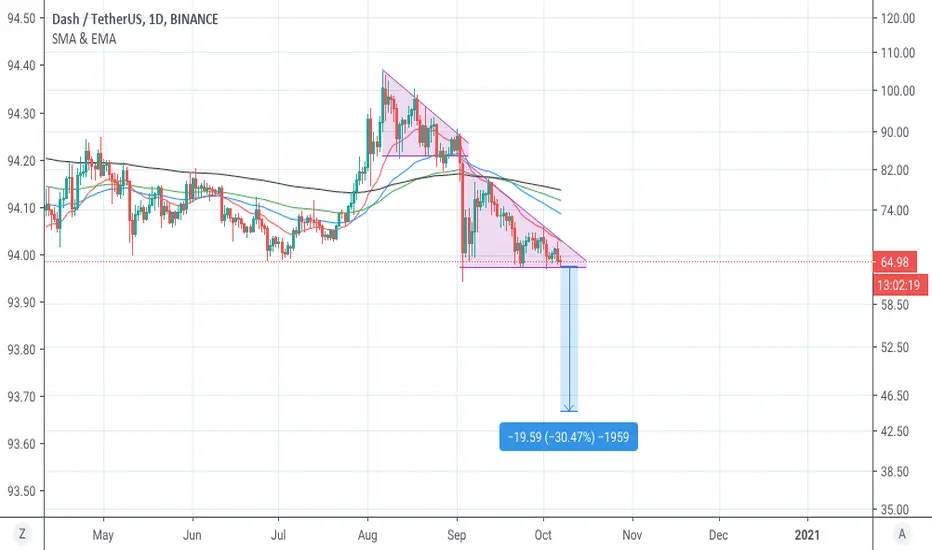
Dash DASHUSDT - Descending triangleBitcoin dominance is currently forming Head and Shoulders reversal pattern, that is bad for altcoins. I see this descending triangle on DASH, which is extremely bearish setup. Also, this coin breaking down from major horizontal support.
Please, hit the like button and follow me for more of these ideas!
Also, check my signature down below ↓
Dash

DASHUSDT, 4H and 1D | Descending triangles, Good short positionIt seems that Dash likes triangles! We can see descending triangles obviously in both 4H and daily time frames. I think it could be a good short position. The target could be around 45 and stop-loss should be around 70.

DASHBTC, Will it repeat?It will be a good signal for us if we will see a volume increasing ner the Support level.
The price falls almost a full year to this level and can bounce off.
It will be a good trade with low risk and potentially big profit.
Push like if you think this is a useful idea!
Before to trade my ideas make your own analysis.
Thanks for your support!

Dash Weekly Forecast - Bullish Descending Wedge FormingEpic descending wedge could be in the makings here.. Expecting one more drop into the $50 range then rally to $200 as descending wedge pattern completes. Timing for the upside breakout ~ Q1 2021. Lets watch.
0049 - Short DASH on MarginPrecio de Entrada: 63.45 USD
Stop-Loss: 71.60 USD
Objetivo Mínimo: 42.30 USD
Objetivo Máximo: 33.00 USD
Nivel de Riesgo: 1%
Razonamiento:
- Setup super sencillo. Precio de entrada justo por debajo del soporte señalado en los $65. La operación seria ejecutada con una orden stop-sell al precio indicado. Estaríamos operando un breakdown.
- Stop-loss por encima del ultimo swing high. Ahí se invalidaría la idea. Sin misterios ni complicaciones.
- Objetivo mínimo: El low del 12 de Marzo. Nos brinda una R:R bastante razonable.
- Objetivo máximo: El low del 13 de Marzo que, a su vez, es el low del 2020. Seria el primer retest desde entonces. Esperen demanda allí.
-

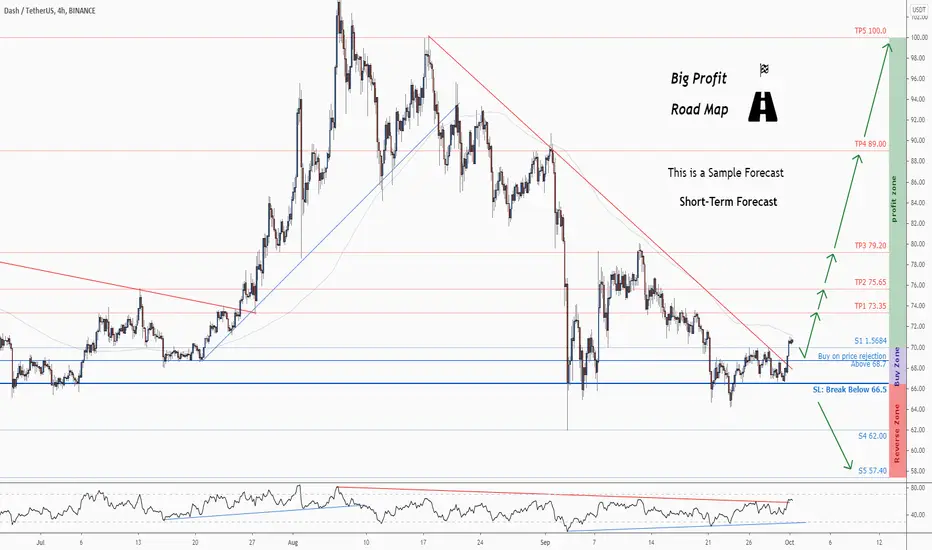
Don't miss the great buy opportunity in DASHUSDTTrading suggestion:
. There is a possibility of temporary retracement to suggested support line (68.70). if so, traders can set orders based on Price Action and expect to reach short-term targets.
Technical analysis:
. DASHUSDT is in a range bound and the beginning of uptrend is expected.
. The price is below the 21-Day WEMA which acts as a dynamic resistance.
. The RSI is at 62.
Take Profits:
TP1= @ 73.35
TP2= @ 75.65
TP3= @ 79.20
TP4= @ 89.00
TP5= @ 100.00
SL= Break below S3
❤️ If you find this helpful and want more FREE forecasts in TradingView
. . . . . Please show your support back,
. . . . . . . . Hit the 👍 LIKE button,
. . . . . . . . . . . Drop some feedback below in the comment!
❤️ Your Support is very much 🙏 appreciated! ❤️
💎 Want us to help you become a better Forex trader ?
Now, It's your turn !
Be sure to leave a comment let us know how do you see this opportunity and forecast.
Trade well, ❤️
ForecastCity English Support Team ❤️
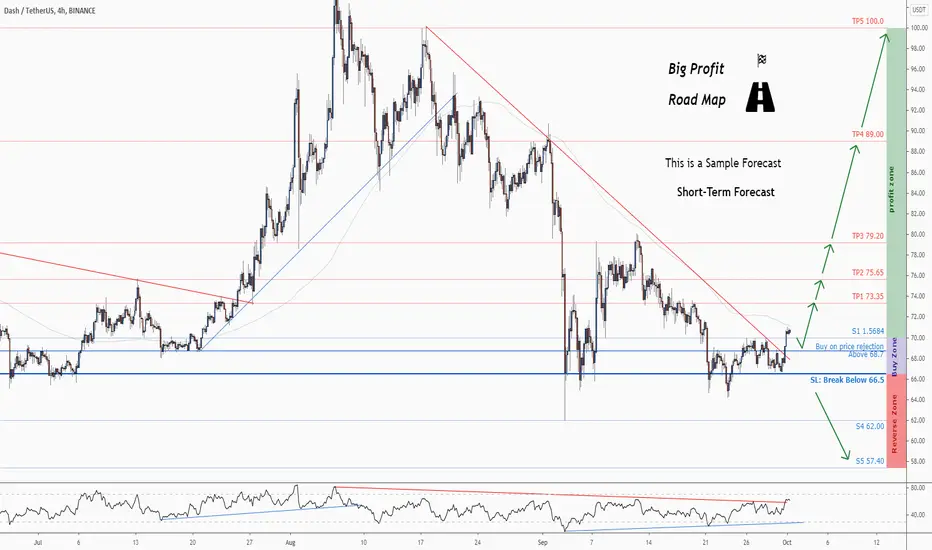
Don't miss the great buy opportunity in DASHUSDTTrading suggestion:
. There is a possibility of temporary retracement to suggested support line (68.70). if so, traders can set orders based on Price Action and expect to reach short-term targets.
Technical analysis:
. DASHUSDT is in a range bound and the beginning of uptrend is expected.
. The price is below the 21-Day WEMA which acts as a dynamic resistance.
. The RSI is at 62.
Take Profits:
TP1= @ 73.35
TP2= @ 75.65
TP3= @ 79.20
TP4= @ 89.00
TP5= @ 100.0
SL= Break below S3
❤️ If you find this helpful and want more FREE forecasts in TradingView
. . . . . Please show your support back,
. . . . . . . . Hit the 👍 LIKE button,
. . . . . . . . . . . Drop some feedback below in the comment!
❤️ Your Support is very much 🙏 appreciated! ❤️
💎 Want us to help you become a better Forex trader ?
Now, It's your turn !
Be sure to leave a comment let us know how do you see this opportunity and forecast.
Trade well, ❤️
ForecastCity English Support Team ❤️

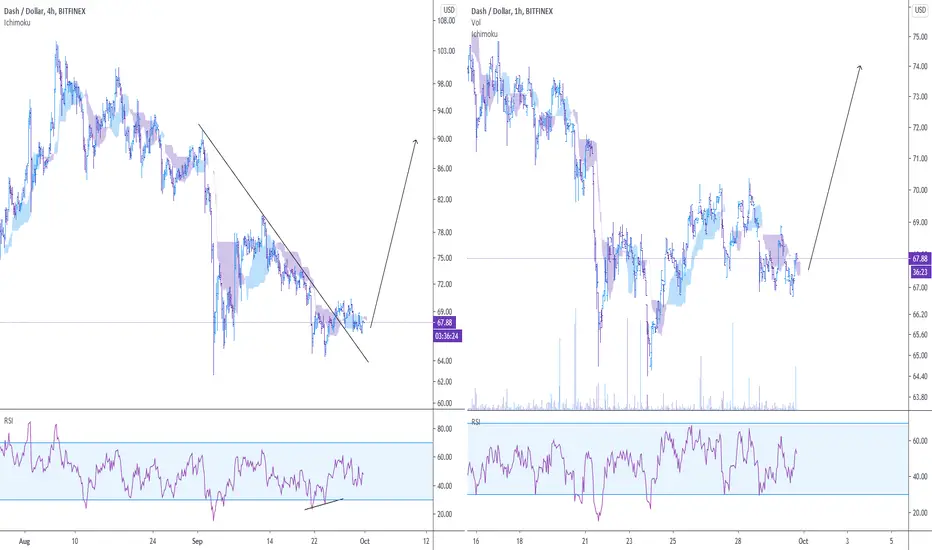
DSHUSD: Possible Long (30.09.2020)On the 4 hours chart, the price found support at 65, where a divergence formed between the price and the RSI, indicating a temporary cessation of the downward movement. In addition, the price has broken the trend line.
An upward impulse is forming on H1, which heralds a possible continuation of the price growth, while the price found support at 67.
We recommend buying now, as well as when the RSI reaches the oversold level.
DASH/USD - ATS SWING BACKTEST Script settings for 12H timeframe:
· Signal calculation type - "low"
-TP for Long - none
-SL for Long - none
-TP for Short - none
-SL for Short - none

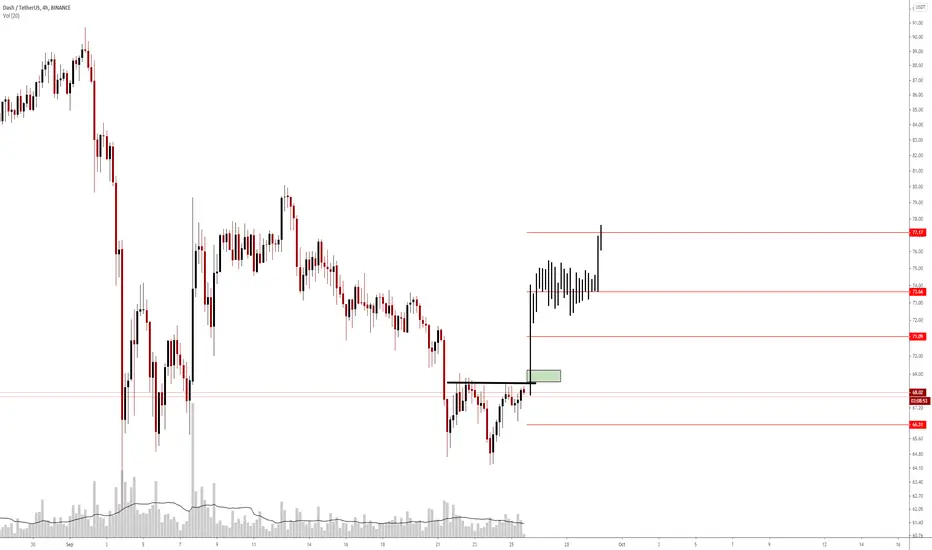
Dash will Dash up! Dash is pushing into the resistance area quite heavily for some time.
This means, that if the price breaks the key level of $77.2 by a full candle, I expect a quick leg up.
Setup.
Enter market.
Leave if the price breaks the uptrend.
Take profit around $84.
Indicators.
EMA's can see a trend change, the fact the ema's are so close together can mean, there will be an increased volume.
RSI is trending higher.
MACD is indiferrent.
Uptrend line is active.
The price is pushing into the resitance with a higher lows.
This should be a quick and easy trade, if Bitcoin doesn't fall below $10.200.
Good luck with this trade!
Tibor

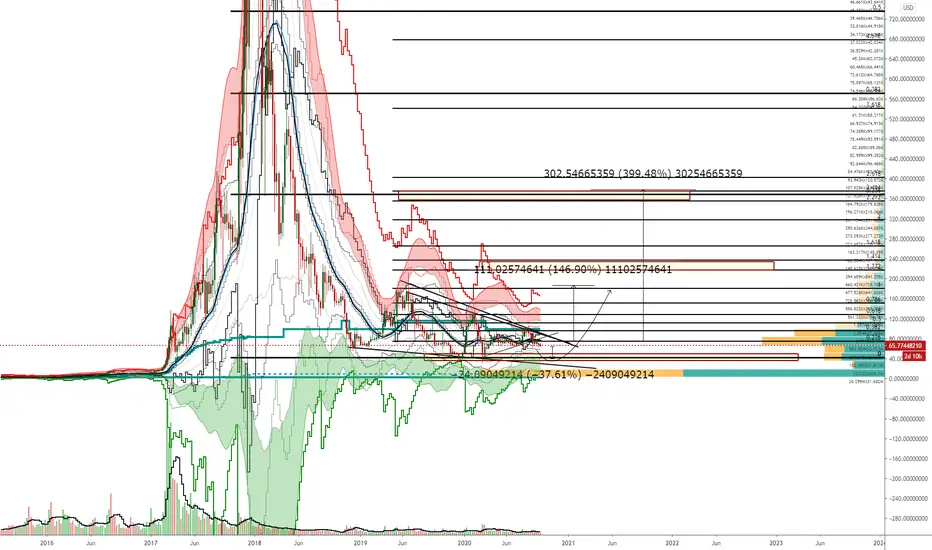
Long Term Dash Projections- Long Term Breakout in Progress.Dash analysis
Beautiful longterm growth chart with DASH shows a significant breakout in progress as the wRSI(18) lines up exactly with the move during the last cycle and a break of the diagonal downtrend resistance.
We also see a bullish divergence between our price and momentum oscillator as it created a higher low on wRSI and a lower low on price.
Monthly b bands have pulled back together as well.
In the near term I would expect the first pullback as price moves towards the 200wEMA. Being above the wEMA ribbon we should have solid support as it regains bullishness. Sideways movement here can also fulfill the required time and accumulation necessary to move higher.
Other volume indicators like OBV and Accumulation/Dist are basically flat.
Slow growth will be followed by an explosive parabolic move towards the $5-6K range if the pattern plays out the same. Long term traders and investors, buy on pullbacks and look for exponential growth some time in late 2021.
-Rob D Swinging Crypto

LONG DASHUSD - Pefect JunctionPrice action just fell out of both of my custom bollinger bands. It's at a cross roads for the trend to continue upwards. It appears to have been in accumulation for quite some time and it just had a push down that may give the bulls the go ahead. And with Crypto , there's still time to analyze to see where you think is the best entrance. Mine is as shown 76.20. I should've waited just a little longer. but oh well. I believe this is a goof position.
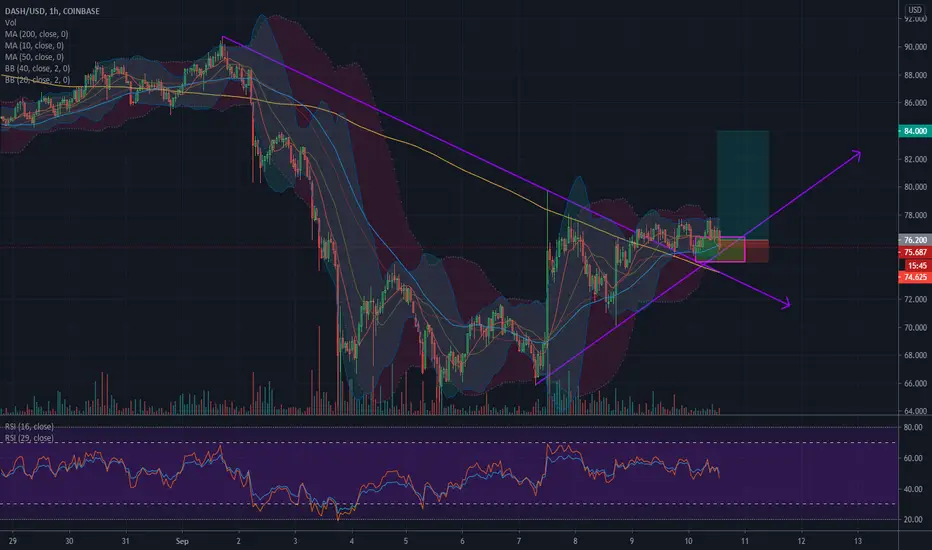
DASH Long 23.6% or 50% Retracement - Depending on placementUsing Bollinger bands and Fibs, I placed the trade which gave me a bit of a spread at 76.17 when I'd rather have it at 75.75. Either way, the way Dash has been moving, this looks to be going long as their was wguite a time of accumulation and it just needed the push down to accelerate it long. Here's to hoping we make a new High. Just FYI these are two trades that have been placed making indicision candles on the hourly. Until it just jumped down. But I have moving average support from Under on most time frames.
