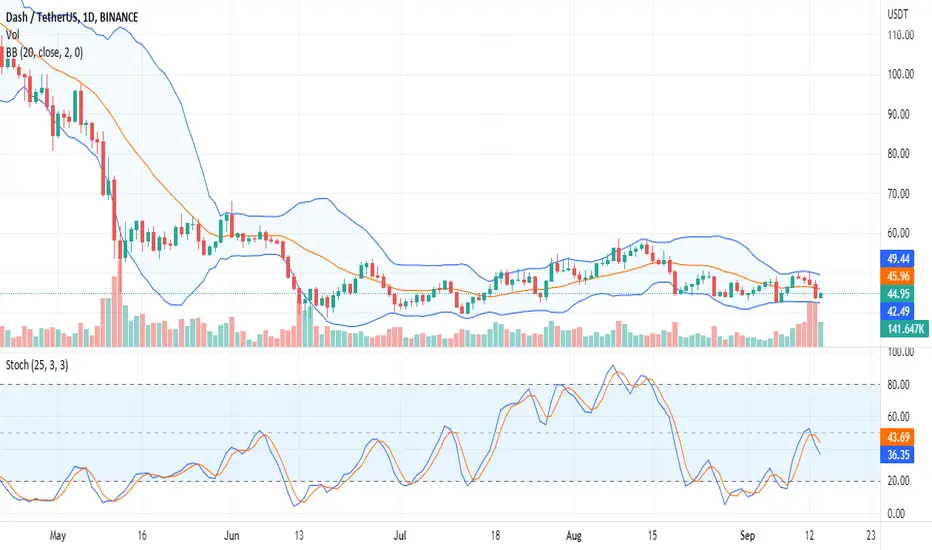
#DASH Pinned to an $8 Range as Bears Flow BackPast Performance of DASH
Like other crypto assets, DASH failed to stand tall against a wave of sellers. As of writing, the coin is down five percent and bending back to follow strong bears. The dominant trend remains bearish in the short term, and this forecast will stand provided prices are below $50.
#DASH Technical Analysis
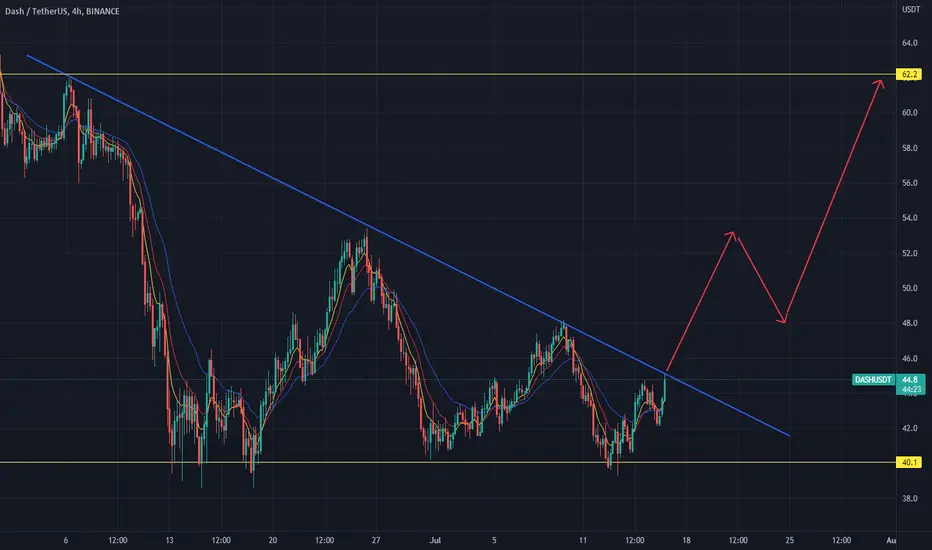
DASH is in accumulation in a bear flag when analyzed from a top-down preview. The immediate resistance is at $50, while the coin's support is at $42, marked by last week's lows. If bears press on and DASH cracks below $42, aggressive traders can unload on every attempt higher, targeting June 2022 lows of $38 and later $30 in a bear continuation formation. Already, the drop of the past two days is within increasing volumes hinting at bears. This move will confirm losses of Q2, signaling another wave of lower lows that could push DASH to the brink.
What to Expect from #DASH?
DASH is on a weak footing, and buyers should keep prices above $42 if the uptrend is to be sustained. A close above $50 and last week's highs will draw strength and attract buyers as the coin recovers.
Resistance level to watch out for: $50
Support level to watch out for: $42
Disclaimer: Opinions expressed are not investment advice. Do your research.
DASHUSDT
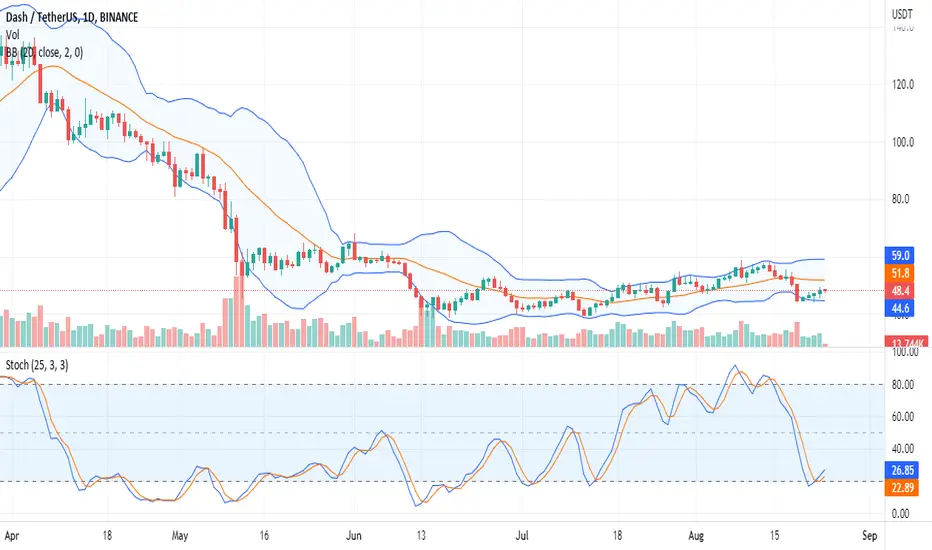
#DASH in a Bear Breakout with Resistance at $52Past Performance of DASH
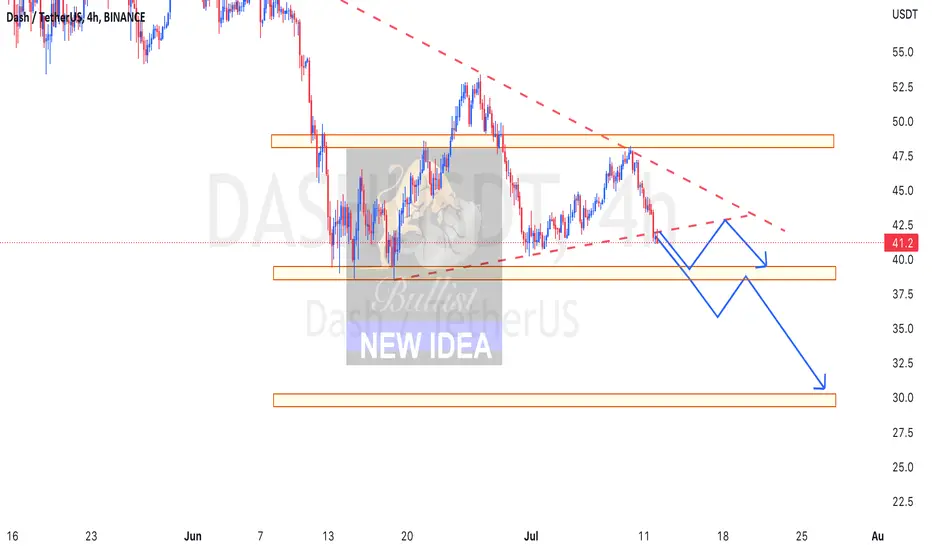
DASH prices are stable at press time, following encouraging gains on August 23. The primary trend remains positive, and the pullback may represent further selling opportunities for opportunistic bear traders. This preview, gauging from how candlesticks are arranged in the daily chart, is valid, provided prices are within the August 19 bear bar.
#DASH Technical Analysis
DASH is up four percent in the past 24 hours at press time versus the USDT. Still, the coin is broadly within a bear breakout formation below the long-term support trend line and the middle BB. Furthermore, since prices are floating higher with relatively low trading volumes, the immediate trend swings to favor sellers. From the daily chart, the first level of support is at $44, marking last week's lows. A close below this mark may see DASH retrace to 2022 lows at $40 in continuation of selling pressure set in motion at the tail end of last week. This preview will, however, be null should DASH bulls force prices above $52, reversing the losses of August 19.
What to Expect from #DASH?
The primary trend is bearish, and the coin is within a bear breakout formation. The relief rally of August 23 may be short-lived if there are no sharp gains above $52. Any reversal below last week's low may see even more liquidation in the short term.
Resistance level to watch out for: $52
Support level to watch out for: $44
Disclaimer: Opinions expressed are not investment advice. Do your research.
🔔 DASH is near the horizontal supportHello, dear TradingView members.
This idea is a DASH brief analysis.
This coin has reached the Horizontal Support area in the 1H timeframe.
There is a high possibility that the price will go up from this level.
If you are interested in opening long positions or buying this coin, this would be a good chance.
If you want to open short positions, it's better to hold for further confirmations to see what happens.
Let me know if you guys have any questions;
I will be more than happy to help.
Good luck, and thank you.

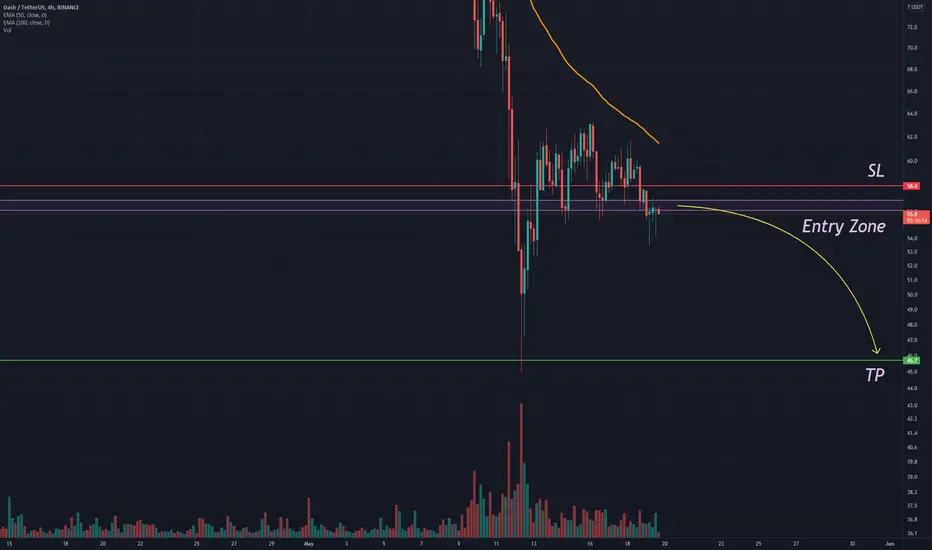
DASH Potential LongThe above trade idea is based on symbol DASHUSDT - Binance.
An alert has been set for the entry price.
Risk Management is always important. Let the trade come to you.
Stoploss(SL) 1% above entry. Take Profits(TP) at 1% increments.
First TP1 will have a higher percentage of take profit.
Do Techincal Analysis(TA) stick to your plan, let the trade come to you, and don't FOMO, if your plan does not come to fruition (not hit) then you have not lost any money, have a SL to ensure best practice so you can continue trading, journal your trade for self development and reflection.
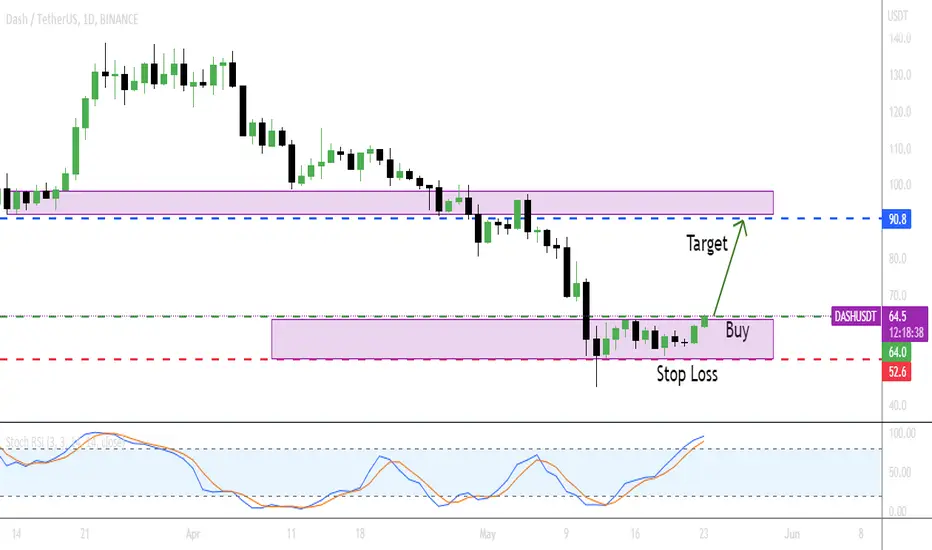
Long DASHUSDI am buying simple because DASHUSDT is breaking above resistance level
Long at market
Stop: 52.6
Target: 90.8
DASHUSD AnalysisA long term view for DASH
The previous break out was due to a relatively large ascending triangle
The top resistance of this pattern can be used for a following pattern of a symmetrical triangle, which is much larger and yet to break out
Similar top points above the hammer
Both patterns are bullish
Daily timeframe

DASHA measured move on DASH break out is $70 & ETH is the yellow comparison & wants dash at $54 right now. Should play nice with BTC close to breaking $22k.

DASHUSDT long ideaaccording to the 4 hours chart dash is ready to break above with the current market small bullish momentum. Main target is around 62 Usdt.
TP1 48.2 Usdt
TP2 62 Usdt
SL 41.9
DASHUSDT will we see 30$ again? the price can't hold 41.5 $ and if it loses 40$ there is a probability to see 30$ again.
if the price lose 40$ or retest the dynamic support as a resistance we could set a short position.
this is not a buy or sell offer and is only educational.
if you liked this idea or if you have your own opinion about it, write in the comments for us. we will be glad
hoping for more profit for you ...
dashDash is above the 200 DEMA vs ETH for the 1st time since 3/2020.
Dash has previously broke above and then Nuked quickly below.
But still something I think is worth paying attention to.

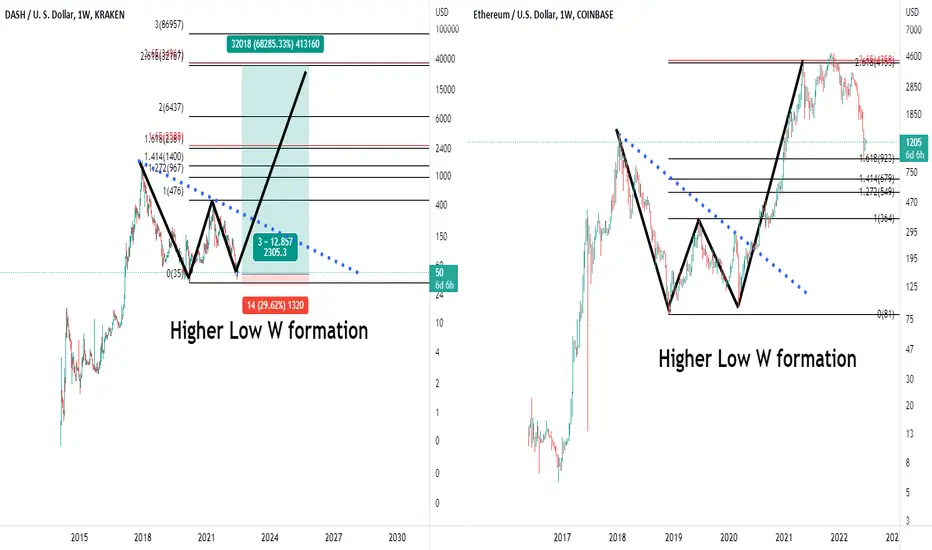
Quickpost: Comparing W patterns on Dash and EthereumI am taking this almost purely as a pure chart formation play. The Fib draw is from the bridge of the W and that was very effective in target setting ethusd last uptrend. The blue dotted trendline is where I would suspect price would stall and create some uncertainty in Dash just like it did with Eth. Of course, that may be aggressive and a look the W on btc with the same draw show price only reached the 2 fib level before coming back down. Partial profits will be taken, of course, as we move up.
As I look at the DashBTC chart this gray area looks concerning as if the pair could stall and that would mark highs on Dashusd. I will be looking for confuence with Dashusd at a major fib level while dashbtc approaches the gray area.
DASHUSDT hold short till 35 and buy limitYou can hold short till 35, looking there for buy limit. Look my previous analysis about May month short

DASHUSDT LONG TERM PREDICTION !Hello my Friends , there is two senario here for dash you can see in the chart !
NOT FINANCIAL ADVICE
Dash coin has formed a huge Gartley for upto 1187% big moveHi dear patrons, hope you are well, and welcome to the new update on Dash coin.
Previously we had a nice harmonic trade on a monthly time frame:
Now again on the monthly time frame, Dash has formed a big bullish Gartley pattern.
Note: Above idea is for educational purpose only. It is advised to diversify and strictly follow the stop loss, and don't get stuck with trade.

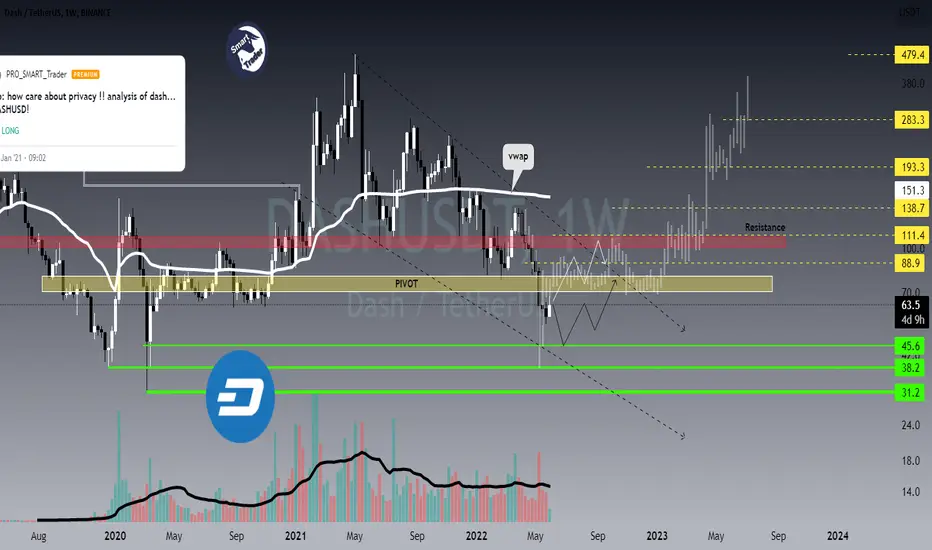
DASH/USDT Analysis Update 📈📉HEY ,SUP GUYS !
In the last analysis that I posted for DASH, although it was not be able to reach my final target but was be able to rise by more than 400 % 🎯💰 .
So today as we can see in 1w time frame for DASH/USDT, since ATH it has been declining in downtrend channel so far, now It is trying to test the pivot zone , and if be able to take over this zone then it will face to another resistance zone , but in order to receive the higher Targets , should take over both higher key zone , as good as breakout the trend line , then continue its uptrend , probably similar to bars pattern, will act , but otherwise it will fall on the lower support lvls.
✌️ Good luck with your trading and investing and remember: Trade smart…OR JUST DON’T TRADE!
--------------------------------------------------------------------------------------------------------------------
👉This analysis is my personal opinion ,not a financial advice ,so do your own research.
💜 if you're a fan of my analyses PLZ follow me and give a big thumbs 👍 OR drop comment 🗯💭
DASH Long: Bounce incomingLooks like DASH is ready for a bull bounce.
The price did break out from the triangle and 50 MA resistance
So we can expect 200MA touch as a minimal target.

DASH Long setupHello to everybody!
I am waiting for the break of the red trendline.
When 4h candle close above 65 USD, then could DASH go to 70-75USD.
Check my long setup.

Does the Dash currency have any growth prospects?Today is a global review of the DASHUSDT trading pair.
Probably not many current crypto participants remember this, but at the end of 2017 in early 2018 at absolute highs Dashcoin was worth almost $1600.
And then the dark times for Dash investors began, as the $50 level the third time in 4.5 years pulled a price to them
By now, the Dashusd price is trying to get a foothold above $50. This maneuver gives a chance to suppose that in the coming weeks/months we might see a rebound up to the level of 115$ on the chart.
Then in the area of $115 will be decided the fate of the Dashcoin's price further movement: the continuation of growth to the area of 200$ or down to 50$ again.
But we will write about it in our further reviews of Dashusdt pair, analyzing the actual trading situation on crypto in the future on smaller timeframes, looking back at this global chart of Dashusd price.
_______________________________
Since 2016 , we have been analyzing and trading the cryptocurrency market.
We transform our knowledge, trading moods and experience into ideas. Each "like under the idea" boosts the level of our happiness by 0.05%. If we help you to be calmer and richer — help us to be happier :)

Dash (DASH) Sell ZoneDash (DASH) Sell Zone
--------------------
BIAS
Short-Term : Bearish
Risk : Medium
On lower timeframe Dash is showing short-term weakness and could easily tp gp for retest in this zone.
--------------------
$DASH/USDT SHORT SETUP
Leverage : x3 - x5
Entry Price : 56.1 - 56.9
TP 1 : 54.8
TP 2 : 53.8
TP 3 : 52.2
TP 4 : 51.1
TP 5 : 49.9
TP 6 : 48.8
TP 7 : 47.2
TP 8 : 45.7
Stop Loss : 58.3
*Maximum 3% of Portfolio.
*Unload 12.5% at each TP. Whenever TP 2 hits, Move stop loss to entry.
--------------------
DASH bottomed? 5 years from now people will remember this time... best buying opportunity in crypto!!

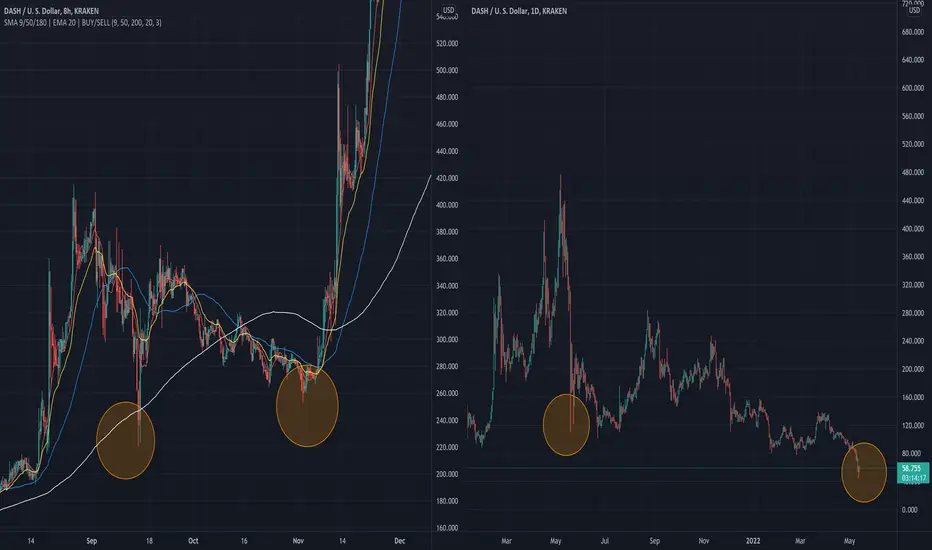
DASH Fractal / Chart PatternSxS comparison from the 2018 bull run.
DASH is about to make a dash w/the bulls!
DASH falling wedge#DASH/USDT
$DASH inside falling wedge.
there is a long term support zone between $60 and $36 that is the same with lower line of wedge.
🐮 holding this support zone will increase price to upper line and if break out from wedge the target of this pattern will be around $200 in long term.
🐻 break down from lower line will drop price to $16 and $0.7.

DASHUSDT AnalysisHello friends.
Please support my work by clicking the LIKE button👍(If you liked). Also i will appreciate for ur activity. Thank you!
Everything on the chart.
Entry: market and lower
Target: 100 - 125 - 145
after first target reached move ur stop to breakeven
Stop: (depending of ur risk). ALWAYS follow ur RM .
risk is justified
Good luck everyone!
Follow me on TRADINGView, if you don't want to miss my next analysis or signals.
It's not financial advice.
Dont Forget, always make your own research before to trade my ideas!
Open to any questions and suggestions.
