GBP/CAD 1H Chart: Channel DownGBP/CAD 1H Chart: Channel Down
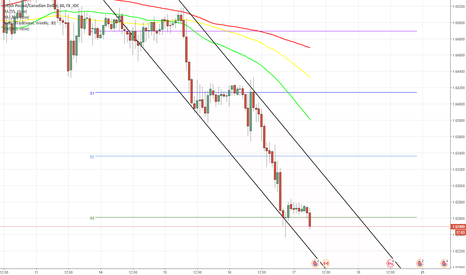
The British Pound is losing value against the Canadian Dollar in a two day long descending channel.
The pattern was shaped by a reaction on release of information on the UK CPI and Average Earnings Index.
At the moment, the currency pair struggles to pass through the support level set up by the weekly S3 at 1.6268.
Generally, the rate is expected make a rebound and surge to the top for some short period of time.
Firstly, because in the end of the previous trading session the pair made a second fully-fledged rebound from the bottom trend-line of the channel.
Secondly, because a number of technical indicators point out that the currency rate is oversold.
However, there is a need to take into account that release of data on the UK Retail Sales at 8:30 GMT, depending on the result, will either help the Pound to reach the pattern’s upper boundary for the third time, or it will accelerate the fall towards the monthly S1 at 1.6187.
Datadependent
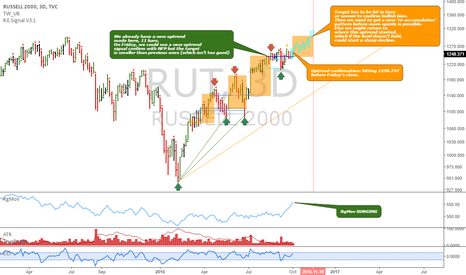
Russell 2000: The bullish caseWe have potential for a new uptrend signal emerging this week, after NFP comes out.
If I'm right, we might see a strong rally in equities, lasting well into November. The time target would put a top by November 16th or sooner, which interestingly aligns with the Federal Reserve's FOMC November meeting, which has been hinted that will be a 'live' meeting, regarding an increase of interest rates.
I'm mostly net long equities, but today I added back my CLX short position, and I'll be looking to take other strategic shorts going into this Friday's meeting, if viable. I still think it's likely to see more upside, so this signal here seems highly likely to trigger.
The bearish case, can be obtained from my weekly 'terminal pattern' chart for the DJIA.
That idea is still valid, and we have ample time to validate the decline, breaking the trendline connecting waves 2 and 4, and hitting the price target in time after that.
Trade accordingly, buy undervalued, quality companies, short overloved, overowned, overvalued companies, try to play uncorrelated instruments, use different timeframes...hedge accordingly, but don't be biased, and let activity confirm your analysis as you move forward.
Follow me and Tim West here for more insights of this kind, check out our publications and the Key Hidden Levels chatroom for more information on Tim's methodology.
Cheers,
Ivan Labrie.

